How to Use Marketing Mix Modeling to Increase ROI
Marketing Mix Modeling uses historical data to measure each channel's ROI. Learn MMM use cases, implementation steps, and data requirements.

Marketing Mix Modeling (MMM) is one of the oldest and most reliable frameworks in a marketer’s toolkit — and it’s having a well-deserved comeback. Privacy regulations, cookie deprecation, and platform-level attribution inflation have all made pixel-based measurement increasingly unreliable. MMM fills that gap with a statistical approach grounded in actual sales data.
In this article we cover what Marketing Mix Modeling is, the three most common use cases, how to implement it in practice, and how to ensure the underlying data is trustworthy enough to act on.
What is Marketing Mix Modeling?
What is Marketing Mix Modeling?
Marketing Mix Modeling is a data-driven statistical method that uses historical sales and marketing data to estimate the contribution of each marketing channel to revenue. Marketers use MMM to measure effectiveness across channels and predict the impact of future budget decisions.
In a modern multi-channel setup, businesses run search ads, paid social, display, PR, organic social, email, affiliate, promotions, and more — often simultaneously. Each channel touches customers at different funnel stages. A Facebook ad might build brand awareness; email nurtures leads; search closes deals.
With so many moving parts, it quickly becomes hard to know which channels are actually driving results. That’s where MMM comes in — it untangles the combined effect of all those activities on sales.
Nowadays, there are a lot of things to track:
- Advertising channels, Website activities,
- Mobile applications,
- Email activity,
- Sales in your crm tool.
And as you add different channels to your stack, you will quickly find it more difficult to determine which of those channels are contributing the most to your goals. That’s where advanced analytics tactics like MMM can help you out.
Elements of a marketing mix model
Elements of a marketing mix model
Before building or interpreting an MMM, it helps to understand the underlying structure — which has evolved significantly since the model was first described in 1960.
Basic 4P model
The original marketing mix consists of four elements: Product, Price, Place, and Promotion. Each answers a specific strategic questio
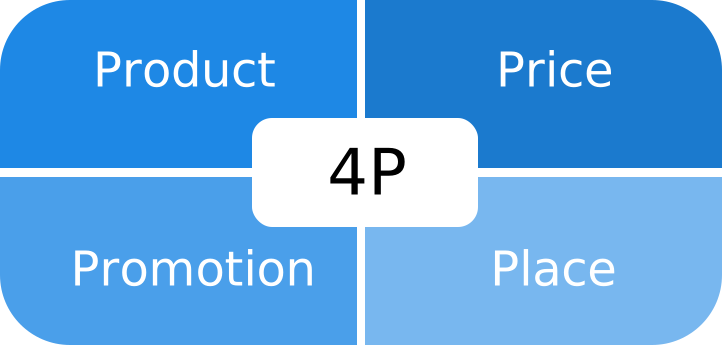
Each of these elements answers a specific question.
- Product: What is needed by the market and target audience?
- Price: What should the product cost?
- Place: What is the optimal distribution model to deliver the product to the customer?
- Promotion: How will information about the company’s products be distributed in the market?
Modern 7P model
Since McCarthy introduced the 4P framework, practitioners have expanded it to reflect the complexity of modern businesses — particularly in services.
Updated marketing mix models:
- 5P model: 4P + People. Answers the question, How should your employees be perceived by customers?
- 7P model: 5P + Process + Physical evidence. The Process element answers the question, How can we optimize the process of creating and delivering the product to customers? The Physical evidence element answers the question, How can the appearance of your store influence the buyer’s decision?
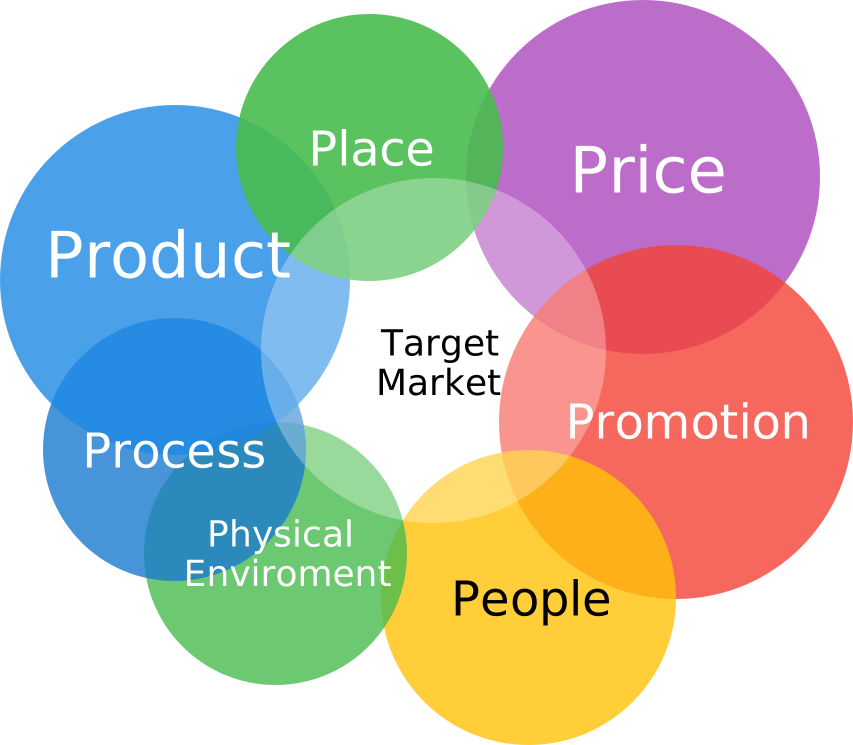
For MMM purposes, the most relevant elements are Price and Promotion — these are the variables most directly tied to short-term sales fluctuations and budget optimization.
OWOX Data Marts
See your first report built in real time. 15 minutes.
- Connect your data warehouse
- Pick your metrics
- Get a live Google Sheets report
In the time it takes to write a ticket. Then imagine never writing that ticket again.
Book a DemoWe'll use your actual use case
Use cases of Marketing Mix Modeling
Use cases of Marketing Mix Modeling
MMM gives marketers a macro-level view of what’s driving revenue — which channels are contributing, which are redundant, and where the next incremental dollar should go. Here are the three most common use cases.
Use case #1: Performance analysis
Performance analysis is about understanding which channels are genuinely contributing to sales versus which are just spending budget.
Imagine you have spend running across Google Ads, paid social, email, and out-of-home. Each channel claims attribution. But MMM doesn’t rely on last-click or platform-reported conversions — it uses regression analysis on actual sales data to isolate each channel’s true contribution.
If your social media spend shows high impressions but weak correlation with revenue lifts, MMM makes that visible. If email is quietly driving a disproportionate share of conversions, it surfaces that too.
The result: budget reallocation grounded in what’s actually working — not in what each platform’s dashboard claims. And because MMM is run repeatedly over time, those reallocations stay current as market conditions shift.
Use case #2: Forecasting and predictive modeling
Predictive modeling uses historical patterns to simulate future outcomes — giving budget planners a more informed starting point than gut instinct.
For example, if historical data shows that increasing social spend by 20% during Q4 correlates with a 12% revenue lift, you can use that relationship to model next quarter’s plan. MMM doesn’t guarantee exact predictions, but it replaces guesswork with statistically grounded scenarios.
Forecasting with MMM is especially useful when:
- Planning seasonal campaigns where past patterns are strong predictors
- Evaluating the ROI of entering a new channel
- Stress-testing a budget cut — where does it hurt most?
Think of it as a GPS for budget planning: it can’t account for every unexpected detour, but it plots the best route based on where you’ve been.
Use case #3: Pricing strategy
MMM isn’t just about channel mix — it also helps model how price changes interact with demand. By incorporating historical pricing data alongside promotional spend and sales volume, MMM can predict whether a price increase will erode demand or hold.
Practical applications include:
- Identifying the optimal discount depth for promotions
- Modeling how a price hike affects volume across different segments
- Comparing the revenue impact of bundling vs. premium pricing
In short, MMM turns pricing decisions from intuition-driven guesses into data-backed strategic choices — aligned with both margin targets and market positioning.
Why MMM matters now more than ever
Why MMM matters now more than ever
Privacy regulations, cookie deprecation, and browser-level tracking restrictions have made traditional pixel-based attribution increasingly unreliable. MMM doesn’t depend on cookies or user-level tracking — it works at the aggregate level, using sales and spend data your business already has.
A few specific reasons MMM is gaining traction:
- Cookie lifespans are shrinking. Sessions and conversions that used to be attributed to a source are now showing up as “(direct)” or “unknown.” MMM captures the effect even when the source is invisible.
- Platforms over-report their own contribution. Every ad platform has an incentive to claim as many conversions as possible. MMM cuts through the noise by looking at what actually moved in your sales data.
- Non-consented traffic has no session source. For visitors who haven’t consented to tracking, pixel-based tools return nothing. MMM models their contribution statistically.
The data used for MMM must be accurate, trusted, and complete. If your spend data is missing channels, or your sales data isn’t unified across sources, the model will produce misleading results. This is where data infrastructure matters as much as modeling technique.
How to implement Marketing Mix Modeling
How to implement Marketing Mix Modeling
Implementing MMM follows three stages, each with distinct data and analytical requirements. Getting the data foundation right is the most critical — and most commonly underestimated — part of the process.
Stage 1: Pre-planning (data collection)
This stage involves gathering and unifying all historical data: ad spend by channel, sales revenue, CRM deal data, pricing history, seasonal indices, and any external factors (economic conditions, competitor activity).
The data needs to be clean, consistent, and at the same level of granularity (typically weekly or monthly). A common failure point is having spend data in one system, CRM data in another, and no reliable way to join them.
Teams using OWOX Data Marts define the SQL logic for each source — ad costs, CRM sales, website sessions — as governed, reusable Data Marts stored in their own warehouse (BigQuery, Snowflake, Athena, Redshift, or Databricks). Data stays in your warehouse. Analysts own the SQL; OWOX governs, schedules, and publishes it so the rest of the team can self-serve without touching raw tables.
Because every number traces back to analyst-approved SQL — not platform-reported estimates, not AI-generated summaries — there are no hallucinations in the underlying data. That matters when the outputs of your MMM are going to drive million-dollar budget decisions.
Stage 2: Planning (model building)
This stage involves building the regression model that relates sales to marketing inputs. The dependent variable is typically sales or market share. Common independent variables include:
- Spend by channel (TV, digital, out-of-home, email)
- Price and promotional activity
- Website traffic and engagement
- Seasonal factors and external macroeconomic indicators
The marketing mix model uses a regression method to quantify the relationship between each predictor and sales. The resulting beta coefficients show how much sales change when a given input increases by one unit — holding all other factors constant.
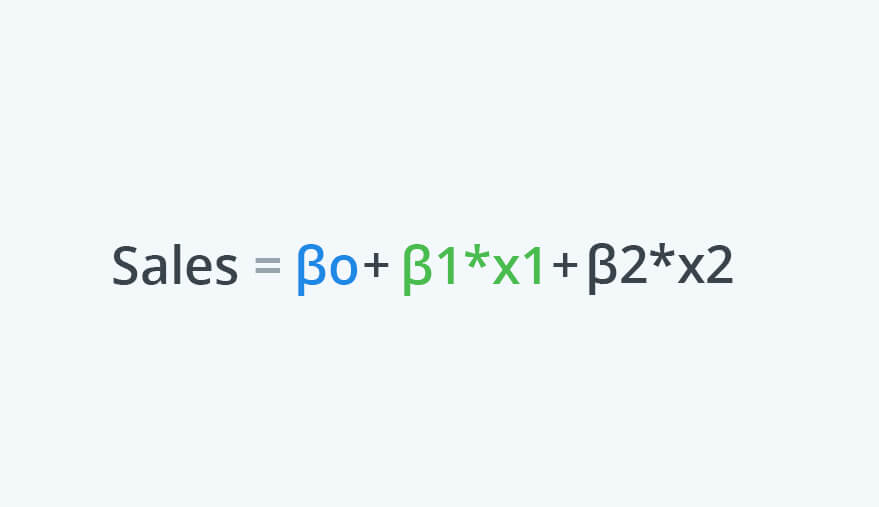
The model distinguishes two types of sales:
- Base sales — revenue that would occur without any marketing (driven by brand equity, seasonality, or external factors). These are relatively stable unless the market shifts significantly.
- Incremental sales — revenue generated directly by marketing activities. This is what MMM attributes to each channel.
Multiple iterations are run until the model explains observed volume and cost trends with acceptable accuracy. Business logic validation is critical here — if the model says billboards drive more revenue than your entire paid search budget, something’s off in the data or specification.
Important: MMM is not well-suited to analyzing new products with limited sales history. Short data histories make the regression unstable and the outputs unreliable. For new launches, MMM is best reserved for post-launch retrospectives once 12–18 months of data have accumulated.
Stage 3: Results tracking and optimization
Once the model is running, this stage involves monitoring actual results against model predictions, updating the model as new data arrives, and using scenario planning to optimize future spend allocation.
Common optimization actions from this stage:
- Shifting budget from low-ROI channels to high-ROI ones
- Adjusting spend timing based on seasonal effectiveness patterns
- Testing pricing or promotional hypotheses the model suggested
A note worth keeping in mind: the relationship between marketing and sales can look very different in growth phases versus stable periods. Coca-Cola’s launch of Coke Zero showed poor early sales despite significant media spend — a simplistic MMM would have recommended cutting the budget, which would have been the wrong call. Statistical outputs always require business judgment to interpret correctly.
The data foundation MMM depends on
The data foundation MMM depends on
A model is only as good as its inputs. This is the part of MMM that teams most often underinvest in — and then wonder why the outputs don’t match reality.
For MMM to produce trustworthy results, you need:
- Unified spend data across all paid channels — not platform-reported, but pulled directly from source APIs into your warehouse
- Consistent sales data from your CRM or ERP, at the same time grain as your spend data
- Clean, versioned SQL logic for any derived metrics (e.g., blended CAC, channel-level ROAS) so the model uses the same definitions every time it runs
OWOX Data Marts support this workflow directly. Analysts define the SQL logic for each data source as a governed Data Mart — ad costs from Facebook Ads, Google Ads, LinkedIn Ads, and others; CRM sales from your warehouse tables; session data from your event stream. No transformation templates, no automatic data cleaning — the analyst writes the SQL, OWOX schedules and publishes it, and the whole team self-serves from Google Sheets or their BI tool of choice.
The audit trail is complete: every number in the MMM input dataset traces back to a specific SQL query reviewed and approved by an analyst. That’s the foundation for budget decisions you can actually defend in a board meeting.
Key takeaways
Marketing Mix Modeling is a proven, privacy-safe method for understanding how marketing activities drive sales. It works without cookies, isn’t manipulated by platform attribution, and provides a unified view of channel effectiveness that no single dashboard can match.
The most important things to get right:
- Data quality first. MMM outputs are only as reliable as the inputs. Unified, warehouse-native data with clear lineage beats scraped dashboards every time.
- Start with the right scope. MMM works best for established products with 12+ months of sales history across multiple channels.
- Combine statistical outputs with business judgment. The model quantifies relationships — you still need to interpret them in context.
- Run it repeatedly. A one-time MMM is useful; a regularly updated MMM is a genuine competitive advantage.
Implementing MMM requires a deep understanding of data collection, statistical modeling, and business context. The data infrastructure underneath it — unified spend, sales, and session data in your own warehouse — is where OWOX can help teams move faster without sacrificing accuracy or data ownership.
Turn your data into decisions.
Governed data marts give you the clean foundation ML needs to actually work.
- No AI hallucinations
- Analyst-governed definitions
- Every number traces to SQL
Frequently Asked Questions
How does market mix modeling work?
Market mix modeling works by collecting historical data on marketing variables and sales, then using statistical techniques to evaluate the relationships between these variables. It identifies patterns, trends, and correlations to determine the individual impact of each marketing element in driving sales. By analyzing these factors, companies can optimize their marketing efforts and allocate resources effectively to maximize return on investment.
What are the benefits of using market mix modeling?
Market mix modeling offers several benefits for businesses. It helps in understanding the effectiveness of different marketing activities and channels, enabling companies to make data-driven decisions. By identifying the best combination of marketing strategies, it allows businesses to optimize their marketing budgets and allocate resources to activities that generate the highest ROI. Market mix modeling also provides insights into customer behavior and preferences, enabling companies to tailor their marketing efforts accordingly.
What is market mix modeling?
Market mix modeling is a statistical and analytical technique used to quantify the impact of marketing activities on sales and identify the most effective marketing strategies. It involves analyzing various marketing variables, such as advertising spend, promotions, pricing, and distribution, to determine their influence on consumer behavior and overall business performance.