
How to Align Marketing, Sales, and Analytics Teams Around The Same Metrics
Discover how to align sales, marketing, and analytics teams around shared metrics. Improve trust, speed, and decision-making with OWOX BI.

Lost time, finger-pointing, and fading trust in dashboards - these are the inevitable effects when Marketing, Sales, and Analytics operate with different definitions of leads, conversions, and pipeline metrics.
These conflicts slow down decisions, create internal friction, and erode trust in your data. And the bigger your team gets, the worse it becomes.

You’re not alone. These misalignments happen when teams use different tools, dashboards, and metric definitions. In this article, you’ll learn why these conflicts keep happening and how a centralized data model can align your teams around a single source of truth, so everyone works with the exact numbers, fast.
The Battle of Metrics Between Analytics, Sales, and Marketing Teams
One of the biggest reasons teams clash is that they focus on different metrics, often without context. Marketing tracks clicks, impressions, and engagement, which help optimize campaigns. However, sales teams prioritize pipeline health, lead quality, and closed revenue. Executives want to see business impact, not vanity metrics.
Without a shared understanding, reports are misread, misunderstood, or ignored. Each team believes its numbers are correct, even when they appear to contradict one another. This lack of alignment creates friction, slows down decisions, and makes it nearly impossible to measure what’s truly working across the funnel.
Why Sales, Marketing, and Analytics Can't Agree on Metrics
The core issue behind misalignment isn't effort, it’s definition. Each team operates on its understanding of key terms. Below are three common reasons why Marketing, Sales, and Analytics teams struggle to agree on metrics and why those differences derail reporting and collaboration.
Conflicting Lead Definitions: MQL vs. Form Fills
Marketing often counts any form fill as a lead, while Sales expects Marketing Qualified Leads (MQLs) that are vetted and sales-ready. This mismatch causes ongoing friction. When one team celebrates lead volume and the other questions lead quality, alignment breaks down, making it hard to measure performance or trust campaign results across marketing and sales.
The Analytics Dilemma: Stuck Between Sales and Marketing Metrics
Analytics teams face the challenge of working with conflicting definitions from both sales and marketing, leading to difficulty in reporting accurate and consistent data. Without a unified definition, reporting becomes unreliable.
For example, marketing might count every form fill as a lead, while sales only consider those who book a demo as leads, creating conflicting numbers in reports. This misalignment makes it hard to trust the data and slows down decision-making across teams.
No Centralized Source of Truth: The Root of the Problem
Without a centralized data model, teams rely on disconnected tools and inconsistent data sources. This leads to multiple “truths,” misaligned reporting, and lost time reconciling numbers.
Integrating data, securing stakeholder buy-in, and managing change are key challenges; however, without addressing them, teams remain stuck debating metrics instead of acting on the shared insights that drive results.
The Problem with Multiple Tools: How Different Metrics Lead to Confusion
Different tools mean different data definitions, calculations, and outputs. Below are three common ways tool fragmentation creates confusion and stalls marketing and sales alignment.
Siloed Data and Inconsistent Metrics Across Platforms
CRMs, GA4, and email tools all track metrics differently, creating fragmented views of performance. These data silos prevent teams from accessing a unified picture, leading to inconsistent reporting and misaligned insights.
For example, GA4 might show 500 new users from a campaign, while the CRM only records 150 new contacts, leaving teams unsure which number to trust. When each platform tells a different story, collaboration suffers, trust declines, and teams spend more time reconciling data than acting on it.
Disagreements in Dashboards
Dashboards often disagree because teams use different tools and definitions for the same metrics. Without a unifying data model, visualizations lack context and consistency. Metrics are grouped without shared meaning, leading to confusion rather than clarity. This misalignment delays decisions, as stakeholders debate which dashboard to trust instead of acting on a single, reliable source of truth.
Wasting Time on Disputes Instead of Driving Results
When teams don’t trust the data, they spend meetings debating numbers instead of making decisions. Conflicting reports drain time and energy, shifting focus away from campaign performance or revenue goals. Without aligned metrics, collaboration stalls and execution suffers. The result is a cycle of constant clarification, when the real goal should be driving business outcomes faster.
What True Alignment Looks Like: Consistent Definitions Across Teams
Alignment doesn’t happen through meetings or better communication alone; it starts with shared definitions. The following elements show what real, data-driven alignment looks like in practice.
Shared Metrics Definitions Across Sales, Marketing, and Analytics
True alignment starts with agreeing on what each metric means - whether it’s a lead, MQL, pipeline value, or CPC. When Sales, Marketing, and Analytics speak the same data language, confusion disappears. Everyone understands what’s being measured, why it matters, and how it ties to business goals.
Analysts Define Metrics Logic, Accessible in a Centralized Layer
Analysts serve as the gatekeepers of metric logic. Instead of each team creating its definitions, analysts define and document standardized logic in a centralized layer. This approach eliminates ambiguity and creates a reliable structure that teams can trust, helping align strategies, reports, and outcomes across departments using consistent, governed data.
Seamless Reports Across All Teams and Platforms
When metrics are defined centrally, every tool, including Google Sheets, dashboards, and CRM systems, displays the exact numbers. Analysts don’t need to adjust definitions per report, and business users don’t have to guess which version is right. Reports become frictionless, teams make faster decisions, and alignment shifts from a goal to a working reality.
How to Create Alignment with a Shared Metrics Model
Aligning teams begins with more than just agreement; it requires a structured approach. Below are three practical steps to build this model and maintain lasting alignment.
Step 1: Analysts Define and Document Key Metrics
Analysts play a crucial role in aligning teams by defining and documenting clear, consistent key performance indicators (KPIs). These definitions reflect business goals, support informed decision-making, and ensure every team speaks the same language. By standardizing terms like MQL, conversion rate, or pipeline stage, analysts create a common ground for measuring performance.
Step 2: Centralize Metrics in a Semantic Layer
Store all metric definitions in a centralized semantic layer that connects to your data warehouse. This allows multiple BI tools and teams to access the same logic, eliminating inconsistencies. Whether through SQL views, reusable metric tables, or YAML-defined models, this step ensures every report pulls from a single, trusted source.
Step 3: Analysts Control Definitions for Ongoing Alignment
As campaigns evolve and business priorities shift, analysts retain control of metric logic. They adjust definitions centrally, so updates instantly reflect across all reports. This ongoing governance prevents teams from drifting into misalignment over time, ensuring that trust in data is preserved at every stage of growth.
How OWOX BI Ensures Analyst-Controlled Metrics Alignment
OWOX BI provides analysts with the tools to define, manage, and distribute metrics from a single, centralized layer, ensuring consistency, eliminating confusion
Define Metrics Quickly with OWOX BI
With the OWOX BI Semantic Layer, analysts can define core business metrics just once using familiar logic, no SQL duplication, and no scattered definitions. These metrics are centrally stored and automatically applied across dashboards, reports, and tools like Google Sheets. This approach ensures consistency, reduces manual rework, and creates a single source of truth for every team.
Seamless Access to Metrics Across Tools
Once metrics are defined in OWOX BI, they become instantly accessible in Google Sheets, dashboards, and chat tools. Teams no longer need to recreate formulas or rely on inconsistent data versions.
This seamless access ensures that every stakeholder, from analysts to executives, works with the exact numbers, improving speed, alignment, and trust across all functions.
Clear Guardrails to Ensure Data Consistency
OWOX BI enforces guardrails that prevent metrics from being used without a clearly defined logic. Only metrics defined by analysts in the centralized model are made available in reporting tools. This ensures consistency, avoids misinterpretation, and builds trust in every report and dashboard.
Real-World Examples: How Alignment Drives Results
When teams align around shared metrics, the impact is immediate. The following examples show how centralized metric definitions drive real business outcomes.
Example 1: Marketing and Sales Align on "Qualified Lead" Definition
A major source of misalignment between Sales and Marketing is how a “qualified lead” is defined. Marketing often labels any form fill as a lead, while Sales expects leads to meet specific criteria, such as intent signals or firmographic fit. Without a unified definition, follow-up becomes inconsistent, and conversion rates suffer as a result.
Take Company X, a mid-sized SaaS firm that ran into nonstop disputes and slow lead progression because each team defined “qualified lead” differently.
- Marketing continued to optimize campaigns for a “lead” threshold that Sales rejected, resulting in a burned budget on low-quality prospects and a significant increase in the cost per acquisition by double digits.
- Sales received bloated pipelines packed with names that never matched their “qualified” criteria, so reps spent nearly a third of their week re-qualifying records instead of closing deals.
- Analytics teams fought constant fires- reconciling numbers across GA4, Ads, and the CRM, leaving little time for insight generation or strategic reporting.
- Finance and Leadership lost faith in forecasts because every department presented different funnel math, triggering conservative spend decisions that slowed product launches and hiring plans.
By implementing OWOX BI’s centralized semantic layer, their analysts created a shared definition of a “qualified lead” based on behavioral signals and scoring logic. Once both sales and marketing aligned on this definition, MQL-to-SQL conversion increased by 30%, and lead rejection by Sales dropped significantly.
Example 2: Analytics Shift from Conflict to Performance Optimization
Analytics teams often find themselves stuck reconciling conflicting reports instead of driving performance. When Sales, Marketing, and Executives each rely on different dashboards and metric logic, analysts become mediators, resolving disputes rather than delivering insights.
Company Y, a mid-sized SaaS firm, faced conflicting KPI figures across Looker, Google Sheets, and internal tools, which caused confusion and slowed down decision-making.
- Marketing froze campaign scaling because the ROI changed with each dashboard.
- Sales rebuilt reports by hand, burning hours and letting leads cool.
- Leadership delayed budget approvals when revenue forecasts never matched.
- Data teams spent their week reconciling numbers instead of generating insights.
By adopting OWOX BI’s centralized semantic layer, analysts unified metric definitions across all platforms. This shift allowed them to stop firefighting and start optimizing. Within one quarter, the analytics team helped double campaign ROI through faster, insight-driven actions.
How OWOX BI Empowers Analysts and Streamlines Business Reporting
OWOX BI shifts analysts from reactive support roles to strategic enablers. By centralizing metric logic and simplifying access, it allows analysts to deliver consistent, trusted insights, empowering teams to move faster with confidence in every report.
Analysts Define Metrics Logic for Strategic Control
With OWOX BI, analysts define and manage the logic behind every key metric, directly from the data warehouse. This centralized approach ensures consistency across all reports and dashboards. By eliminating one-off calculations and manual rework, analysts shift from fixing data issues to enabling strategic decisions with clear, trusted metrics.
Business Users Self-Serve with Confidence Using Google Sheets and Chat
Sales and marketing teams can quickly access trusted metrics through OWOX BI’s integration with Google Sheets and chat interfaces. This eliminates the need for manual data pulls, enabling users to confidently explore key business questions using the same definitions set by analysts.
You can ask a question directly in the OWOX AI Assistant in natural language, like: "What is the typical journey of a visitor that converts into a lead?"
To answer this, the assistant will assume:
- You want to map the journey of visitors who became leads.
- It will identify common paths and key touchpoints, such as landing pages, channels, and events.
- The analysis defaults to covering the last 30 days.
Then it will ask: “Is this what you want? You can select a different time period or focus on specific segments.”
Once confirmed, the assistant will deliver a step-by-step breakdown of the most frequent visitor-to-lead journeys, helping teams optimize touchpoints and streamline conversions.
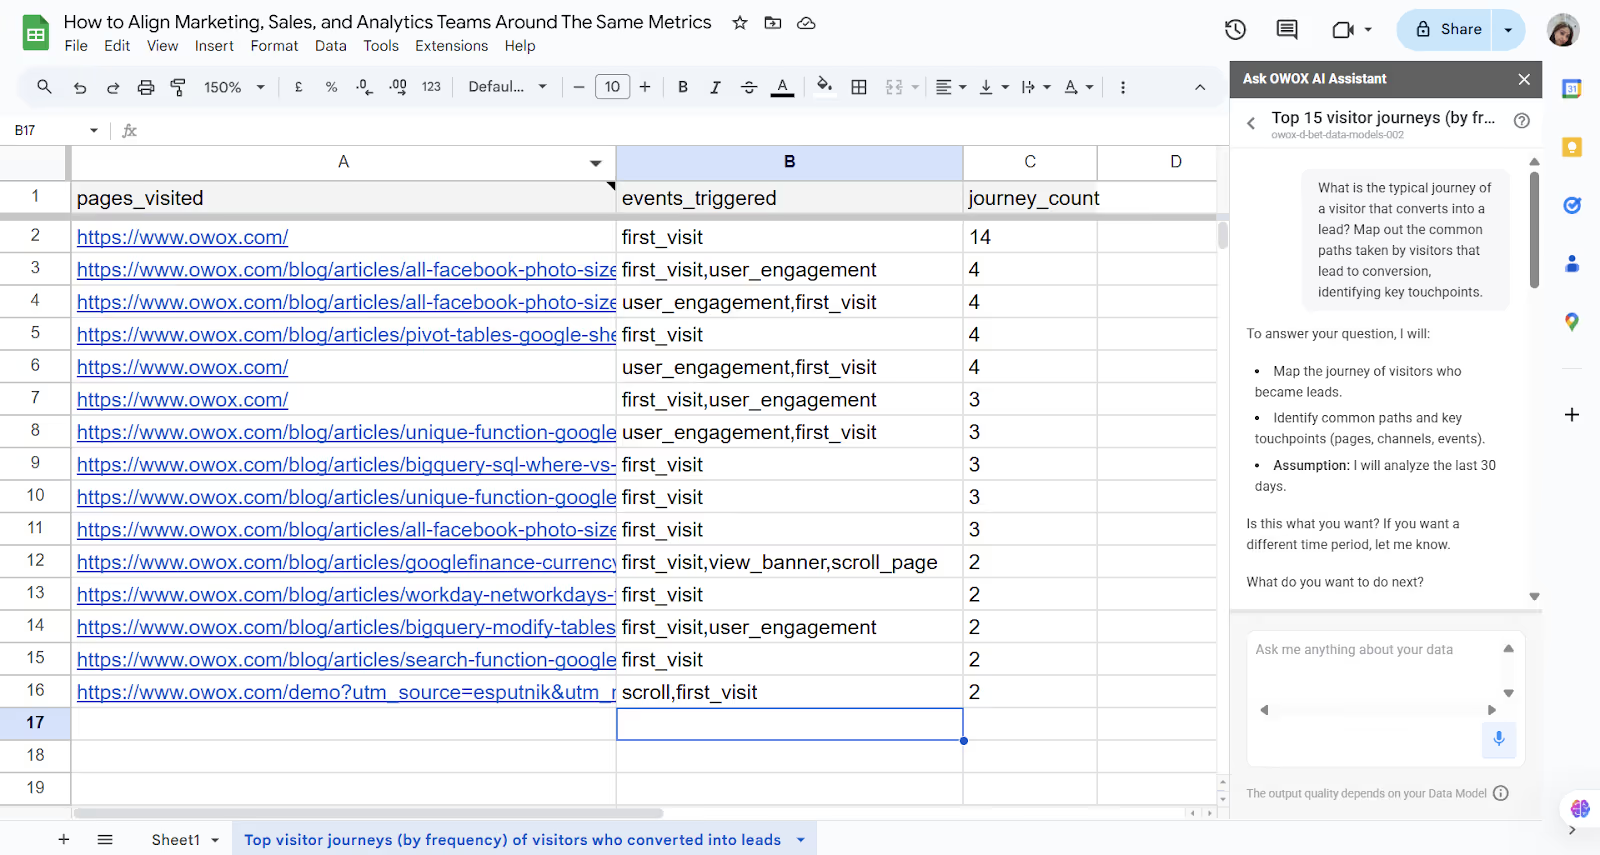
By analyzing the typical visitor-to-lead journey, teams gain clarity on what truly drives conversions. This shared insight helps align campaign strategies across Marketing, Sales, and Analytics.
Demonstrating Alignment: Same Metrics Across Tools and Teams
OWOX BI ensures that Sales, Marketing, and Analytics teams all access and use the same metric definitions, no matter the tool. Whether viewing dashboards in Looker, reports in Google Sheets, or metrics in CRM systems, the numbers stay consistent. This alignment eliminates confusion, speeds up collaboration, and helps teams focus on performance instead of reconciling data.
Achieving Lasting Metric Alignment for Business Success
True sales and marketing alignment isn’t a one-time fix; it’s a system that must scale with your business. With a strong foundation, organizations can ensure consistent, conflict-free reporting that drives long-term success. Here’s what lasting alignment looks like in practice.
Build Strong Foundations for Continuous Alignment
With clear metric definitions and a centralized data model, alignment becomes sustainable and enduring. Teams no longer waste time clarifying numbers or debating reports. Instead, they focus on shared goals with confidence in their data.
Analysts Control the Model, Ensuring Trust Across Teams
Analysts maintain control over metric definitions, ensuring consistency across departments. By managing the centralized data model, they eliminate discrepancies and misinterpretations.

This builds trust in the data and creates a single source of truth for Sales, Marketing, and Analytics, allowing everyone to work from the same metrics without confusion or rework.
Transform Metrics from Battlegrounds to Strategic Assets
When metrics are aligned, they cease to be sources of conflict and begin to drive strategy. Teams use consistent data to make informed decisions, track performance accurately, and respond more effectively. Aligned metrics provide clarity, improve accountability, and help leadership focus on growth instead of mediating reporting disputes.
Take Control of Your Metrics with OWOX BI’s Alignment Tools
OWOX BI empowers analysts to define, manage, and distribute metrics from a single, centralized model. This ensures every report, dashboard, and spreadsheet uses the same trusted definitions. Teams no longer waste time aligning numbers. Instead, they align decisions.
With seamless access to tools like Google Sheets and chat interfaces, business users get clarity without technical barriers. OWOX BI transforms data into a shared language across Marketing, Sales, and Analytics, enabling faster and more confident decision-making.
Frequently asked questions


Finally, a tool that doesn't ask business users to learn a new dashboarding UI. Our marketing team already knows Sheets. OWOX just delivers the right data.
Joinable data marts concept was the thing that sold us. We can now use the semantic layer without building one.
Self-hosted the OSS version on Digital Ocean. Zero vendor lock-in. Contributed a Shopify connector back in week two.