E-commerce data processing: who controls your data and your numbers
In e-commerce data processing, controlling the rows is not enough. Who controls the logic behind revenue and ROAS, and a four-part test you can run today.
E-commerce data processing is everything that happens between an event in your store and a number on a report: collecting orders, sessions and ad spend, cleaning and joining them, and calculating metrics such as revenue, conversion rate and ROAS. Legally, the store is the data controller and the tools it uses are processors. In practice, control has a second half that contracts rarely cover: who controls the logic that turns your data into numbers.
If a tool computes your revenue or your ROAS by rules you cannot read, you control the rows but not the number. This page covers both halves, and gives a four-part test any business owner can run to see which one they actually have.
Note: Originally published in July 2023. Fully updated in October 2026 with an exit test on our demo data and a control checklist.
What e-commerce data processing covers
What e-commerce data processing covers
A typical store processes four kinds of data:
| Data | Comes from | Feeds |
|---|---|---|
| Orders and order lines | Store platform, ERP | Revenue, AOV, margin |
| Customers | Store accounts, CRM | Retention, lifetime value |
| Sessions and events | Web analytics | Conversion rate, funnel |
| Ad spend and clicks | Ad platforms | CPA, ROAS |
Processing turns those into metrics: conversion rate (orders over sessions), average order value, cart abandonment, retention, customer lifetime value, ROAS (revenue over ad spend). Every one of those metrics combines at least two sources, which is why where the combining happens decides who controls the result.
Two kinds of control
| Control of the data | Control of the number | |
|---|---|---|
| The question | Where do the rows live, and who can access them? | Who decides how revenue, conversions and ROAS are calculated? |
| Covered by | Privacy law, data processing agreements | Usually nothing |
| You have it when | Raw data sits in an account you own and can export | The calculation is code you can read, change and run elsewhere |
| You lose it when | Data stays in a vendor’s cloud | A tool computes the metric by its own rules |
Privacy law (GDPR, CCPA) settles the first column: the store is the controller, its analytics, payment and shipping tools are processors, and customers have rights over their personal data. Most writing on “who controls your data” stops there.
The second column is where most stores actually lose control. An ad platform reports conversions by its own attribution rules. An all-in-one analytics tool computes revenue with its own status and refund logic. A connector service lands data in its own cloud and shows you dashboards. You can export the rows from all of them and still not be able to rebuild the number you made decisions on.
OWOX Data Marts
See your first report built in real time. 15 minutes.
- Connect your data warehouse
- Pick your metrics
- Get a live Google Sheets report
In the time it takes to write a ticket. Then imagine never writing that ticket again.
Book a DemoWe'll use your actual use case
A four-part control test
Ask these four questions about any number your business runs on, such as last quarter’s revenue or ROAS:
- Where are the rows? In a database or warehouse in your own account, or in a vendor’s?
- Where is the logic? Can you read the exact calculation as code, or only see its result?
- Where are the definitions? Is it written down which orders count as revenue and which conversions count, in a place your team controls?
- Can you rebuild it? If the tool disappeared tomorrow, could someone reproduce last quarter’s number from what is left?
Four yeses mean you control the number. A “no” to question 2 or 4 means you control only the data.
Our exit test
We ran question 4 on our own [Demo] E-commerce project in OWOX Data Marts, a demo store with orders, sessions and ad spend from seven ad platforms.
Where the rows are. The ad platform data lands in tables in the store’s own BigQuery project (owox-demo.ads_owox): one table per platform, seven in all.
Where the logic is. The Unified Ad Spend Data Mart, which combines the seven platforms into one spend table, is plain SQL. It is readable in OWOX Data Marts, and the same SQL also runs inside a BigQuery view, ecommerce.ad_performance, in the warehouse itself.
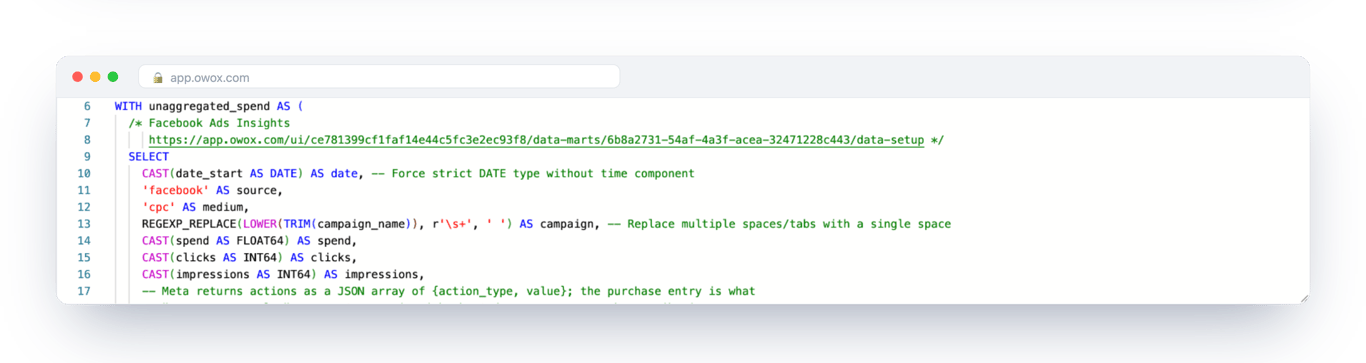
The test. We read July to September 2026 ad spend two ways on 14 October:
| Route | Q3 2026 ad spend |
|---|---|
| Through OWOX Data Marts (the Data Mart, queried over MCP) | $49,062.54 |
| Straight from the warehouse with plain SQL, no OWOX involved | $49,062.54 |
SELECT ROUND(SUM(spend), 2) AS spend
FROM `owox-demo.ecommerce.ad_performance`
WHERE date BETWEEN '2026-07-01' AND '2026-09-30'
Same number to the cent, with the tool removed from the second route. That match is by construction: both routes run the same SQL. What it proves is not that two calculations agree, but that the logic can leave with you, because it is code in your warehouse rather than a setting in a tool.
Spend is the easy case: a sum with no rules. So we ran the same test on two harder numbers:
| Q3 2026 number | Through the tool | Rebuilt from your own rows | Passes? |
|---|---|---|---|
| Ad spend | $49,062.54 | $49,062.54 | Yes |
| Net revenue, completed orders only | $849,177.41 | $849,177.41 | Yes, and the rule is visible: gross revenue is $998,140.86 |
| Conversions from paid ads | 932.67, as the ad platforms report them | 573 orders from paid sessions, 489 completed | No |
The first two pass because the definition (sum of spend; revenue from completed orders only) is written in SQL you can read and change. The third fails, and it fails for every store that relies on platform-reported conversions. The 932.67 is in your warehouse as a column the connectors loaded, and the fraction alone shows it was modelled rather than counted, but the logic that produced it, each platform’s attribution window and its counting of people who saw an ad without clicking, lives at the platform. You own the rows and not the number. The store’s own count, 573 orders from paid sessions, is the one you can rebuild, explain and keep.
We tried to rebuild it anyway, from the raw connector tables in the same warehouse:
| Platform, Q3 2026 | What the platform gave us | What a rebuild would need |
|---|---|---|
| 45 purchases: 34 after a click, 11 after a view | The 11 viewers, who never reached the store | |
| 17.23 conversions: 11.23 after a click, 6 after a view | Fractional credit rules, and the viewers | |
| Google Ads | 111.51 “conversions” and 128.43 “all conversions” for the same period | Which of Google’s two definitions you mean, and its attribution model |
None of the rows carries an order ID, so no conversion can be matched to an order. View-through conversions describe people who never clicked, so the store has no session for them. Fractional counts come from attribution models that share one purchase between several ads. The data that would let you rebuild the number does not exist in your warehouse; only the result does.
Run the same test on your own stack. Pick one number from last quarter that you made a decision on, and try to reproduce it without the tool that showed it to you. Where it fails tells you which of the four questions to fix.
What to keep where
- Raw data in your own warehouse. Order lines, sessions, ad spend at full detail, with history. See what is raw data for why aggregates are not a substitute.
- Metric logic as SQL you own. Revenue, conversions and ROAS as readable queries, not as settings inside a tool.
- Definitions next to the logic, with an owner who answers for them. See who is responsible for data quality.
- Tools on top, not underneath. Dashboards, spreadsheets and AI assistants read the numbers; they should not be the only place the numbers exist.
The cost side of getting this wrong (renewals, egress fees, history lost on exit) is covered in will your data still be yours when you switch tools.
How OWOX Data Marts keeps both kinds of control with you
How OWOX Data Marts keeps both kinds of control with you
OWOX Data Marts runs on top of your warehouse: Google BigQuery, Snowflake, AWS Redshift, AWS Athena or Databricks. land source data in your own storage, and every Data Mart is SQL, a table or a view that runs there. The relationships between Data Marts form the model, so the joins behind ROAS or conversion rate are written once, in code your team can read.
Business users get reports in Google Sheets, Microsoft Excel or Data Studio, and AI assistants connected through MCP query the same Data Marts. If OWOX were removed, the data, the history and the SQL would still be in your warehouse, and the exit test above shows spend and net revenue would still come out the same. Platform-reported conversions would not, with or without OWOX, because their logic never lived in your warehouse.
You can try OWOX Data Marts on your own warehouse.
Turn your data into decisions.
Governed data marts give you the clean foundation ML needs to actually work.
- No AI hallucinations
- Analyst-governed definitions
- Every number traces to SQL
Frequently Asked Questions
How do I keep control of my e-commerce data?
Keep raw data in a warehouse in your own account, write metric logic as SQL you can read, write definitions next to that logic with an owner, and let tools read from it rather than hold the only copy. Test it by rebuilding last quarter's key number without the tool that showed it to you.
How is data used in e-commerce?
To measure sales and margin, see which channels bring buyers, find where shoppers drop off, plan stock and budgets, and track retention and lifetime value. Each of these metrics combines at least two sources, such as orders and ad spend.
What is data processing in e-commerce?
Everything between an event in your store and a number on a report: collecting orders, sessions and ad spend, cleaning and joining them, and calculating metrics such as revenue, conversion rate and ROAS.
How can a store protect customer data in analytics?
Keep personal data in the raw layer with restricted access, publish only what reports need, set retention periods, and give AI assistants and dashboards access to defined datasets rather than raw tables.
What rights do customers have over their data?
Under laws such as GDPR and CCPA, customers can access, correct and delete their personal data and object to some uses of it. The store, as controller, is responsible for honouring those requests across the tools it uses.
Who controls the data when a store uses analytics tools?
Legally, the store is the data controller and its analytics, payment and shipping tools are processors. In practice, control of the numbers depends on where the calculation runs: if a tool computes revenue or conversions by its own rules, the store owns the rows but not the number.