
The Analyst’s Survival Guide to Ad-hoc Requests from Business Teams
Reduce manual reporting and delays by using repeatable frameworks for one-off requests in marketing, finance, and product teams


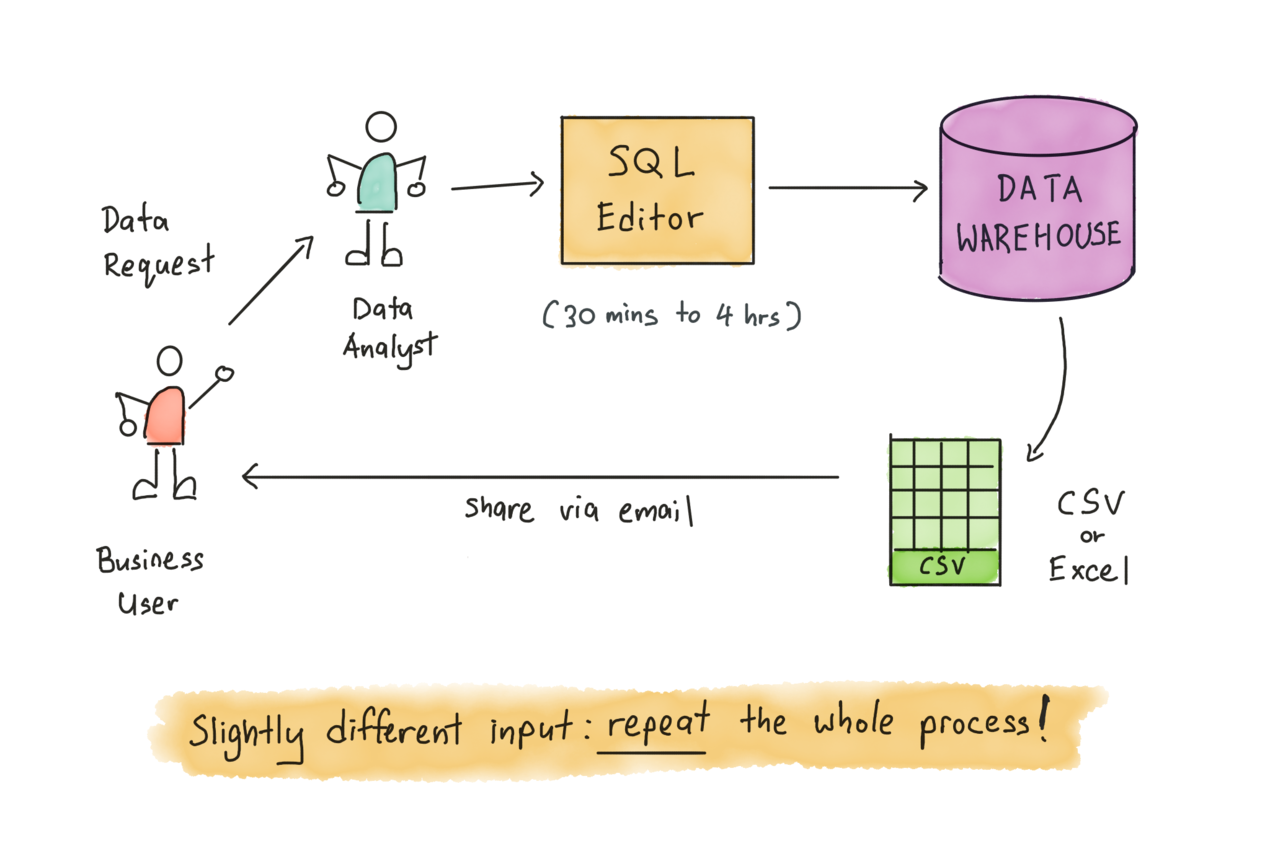
Ever found yourself or your team buried under a flood of “quick” data requests, like “Can you pull campaign spend for yesterday?” or “What’s churn by region this week?” What starts as a simple favor soon becomes a daily drain on focus and time.
.png)
The truth is, ad hoc requests will never stop, but they can be managed. The answer lies in data governance, turning one-off requests into standardized, reusable reporting assets that keep your logic consistent and free analysts to focus on real analysis, not repetitive SQL firefighting.
Why One-Off Requests Drain Analyst Productivity
One-off or ad hoc requests may seem harmless, but over time, they chip away at an analyst’s productivity. Each “quick pull” distracts from strategic work, leading to duplicated logic, inconsistent metrics, and constant firefighting instead of meaningful, high-impact analysis.
Endless Ad Hoc Queries Disrupt Deep Work
Business teams often send what seem like simple data requests, “Can you pull yesterday’s spend?” or “What was churn last week?” Each one looks quick, but together they create a constant stream of interruptions.
Analysts lose hours context-switching between tools and queries, making it difficult to focus on meaningful analysis or model improvements. Over time, these small, repetitive tasks become a silent productivity killer, keeping analysts stuck in reactive mode rather than doing strategic, forward-looking work.
Manual SQL Work Becomes a Hidden Time Sink
Without a structured framework, each ad hoc request triggers another round of manual SQL writing, filter adjustments, or spreadsheet patching. These small, repetitive tasks quietly multiply across teams, campaigns, and time zones. Before long, analysts are spending more time rewriting queries than interpreting results.
This constant rework not only slows down delivery but also increases the risk of errors and inconsistencies, turning what should be quick insights into a costly, ongoing cycle of inefficiency and wasted effort.
Inconsistent Logic Across Teams
When every team builds reports manually, even simple metrics like “revenue” or “active users” can end up defined differently across dashboards and spreadsheets. A small variation in filters or joins can completely change the numbers. Soon, marketing, finance, and product teams are comparing conflicting reports, each confident that their report is correct.
This inconsistency erodes trust, sparks unnecessary debates, and forces analysts to spend hours reconciling differences instead of advancing analysis.
The Real Cost - Wasted Time and Lost Focus

One-off data requests may seem minor, but they disrupt an analyst’s flow and divert attention from larger priorities. Each interruption forces a shift in focus, slowing progress on deeper analysis, forecasting, or modeling projects. As these requests accumulate, analysts fall into a reactive cycle, always responding, never planning.
This approach doesn’t scale. It delays strategic work, reduces overall impact, and turns highly skilled analysts into short-order data pullers. The real cost isn’t just time; it’s lost momentum and missed insights.
Why Manual Reporting Fails to Scale
Manual reporting may seem manageable at first, but it quickly becomes unsustainable. Below are the key reasons why manual processes break under the pressure of scale.
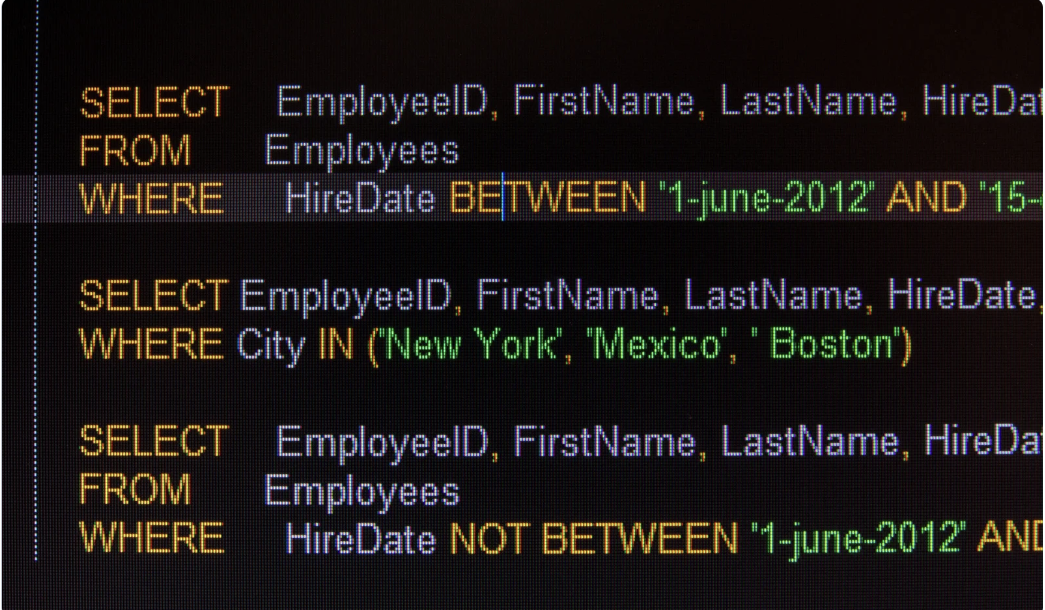
Ad Hoc SQL Isn’t Built for Reuse
Every time an analyst writes a custom SQL query for a new request, that logic lives in isolation, often buried in notebooks or sheets. There's no central place to reuse or standardize it. As more requests come in, similar queries get rewritten with slight variations, leading to duplicated effort and inconsistent results. Over time, maintaining dozens of one-off queries becomes chaotic.
Spreadsheets Can’t Sustain Growth
Spreadsheets often start as a quick fix, copy-paste a formula, tweak a filter, and move on. But as data grows in size and complexity, these workarounds fall apart. Broken links, outdated formulas, and version confusion become the norm.
Analysts spend more time debugging errors and maintaining sheets than actually analyzing trends. What once felt flexible becomes fragile. Without structure and automation, spreadsheets can’t scale, turning into bottlenecks that slow down insights.
The Need for a Standardized Framework
As data demands grow, so does the need for structure. Analysts can’t afford to rewrite queries for every new request or fix scattered spreadsheets. To scale effectively, they need a standardized framework, one where SQL logic is defined once, centrally governed, and reused across multiple reports.
With automation in place, outputs can flow into familiar tools like Google Sheets or Looker Studio. This approach ensures consistency, reduces duplication, and gives both analysts and business teams the confidence to rely on the data.
Frameworks to Handle Ad Hoc Requests Efficiently
To stop the cycle of repetitive requests, analysts need more than quick fixes; they need scalable frameworks. Below are proven ways to turn one-off questions into reusable, automated assets that serve business teams without draining analyst time.
Define Logic Once with Governed Data Marts
Instead of starting from scratch for every new question, analysts can define the SQL logic once and publish it as a governed data mart using OWOX. This way, every team, from marketing to finance, works with consistent, verified metrics. It removes duplicated logic, reduces errors, and builds long-term trust in reporting outputs.
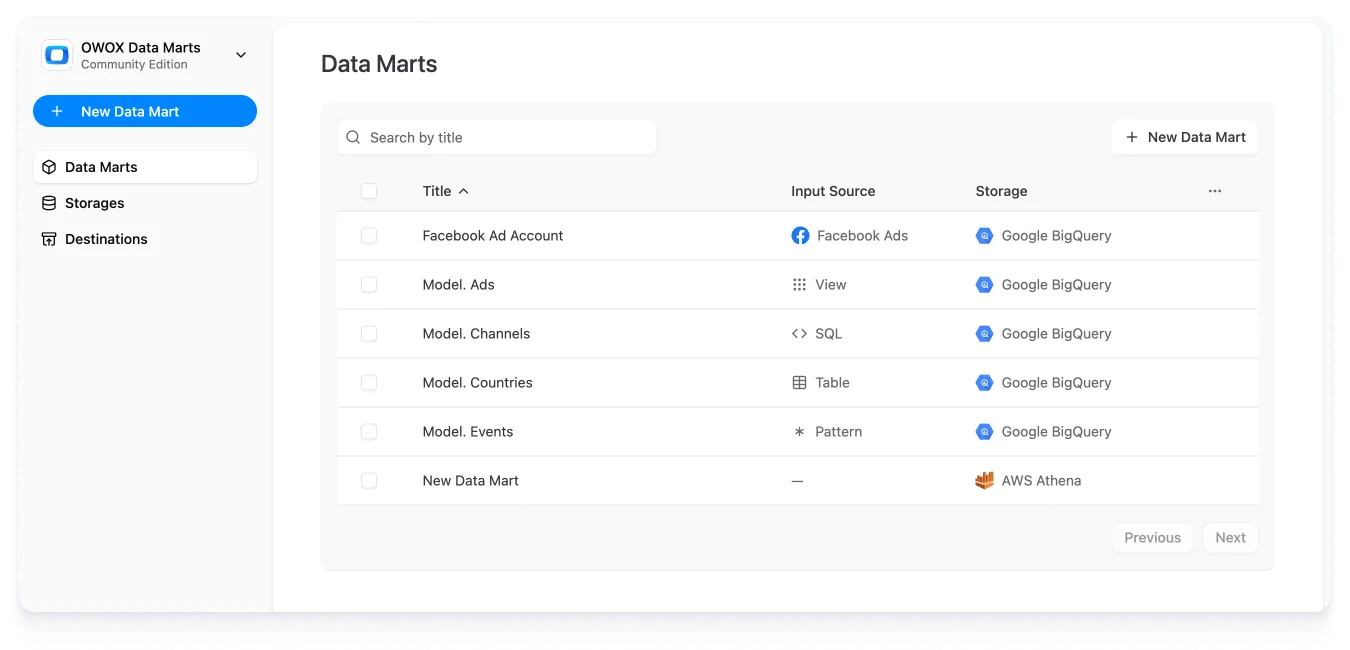
With OWOX Data Marts, these queries become reusable assets that power multiple reports, not one-off scripts buried in emails or notebooks. It’s a smarter, scalable way to handle ad hoc reporting.
Deliver Data Directly to Sheets or Looker Studio
By delivering data directly into Google Sheets or Looker Studio, analysts eliminate the constant back-and-forth with business teams. Outputs update automatically, giving users instant access to the metrics they need, without waiting for a fresh data pull.
This self-service model empowers teams to explore, filter, and build their own reports using trusted, governed data. It speeds up decision-making while ensuring everyone works from the same definitions - no SQL needed, no analyst interruptions, and no risk of logic drift.
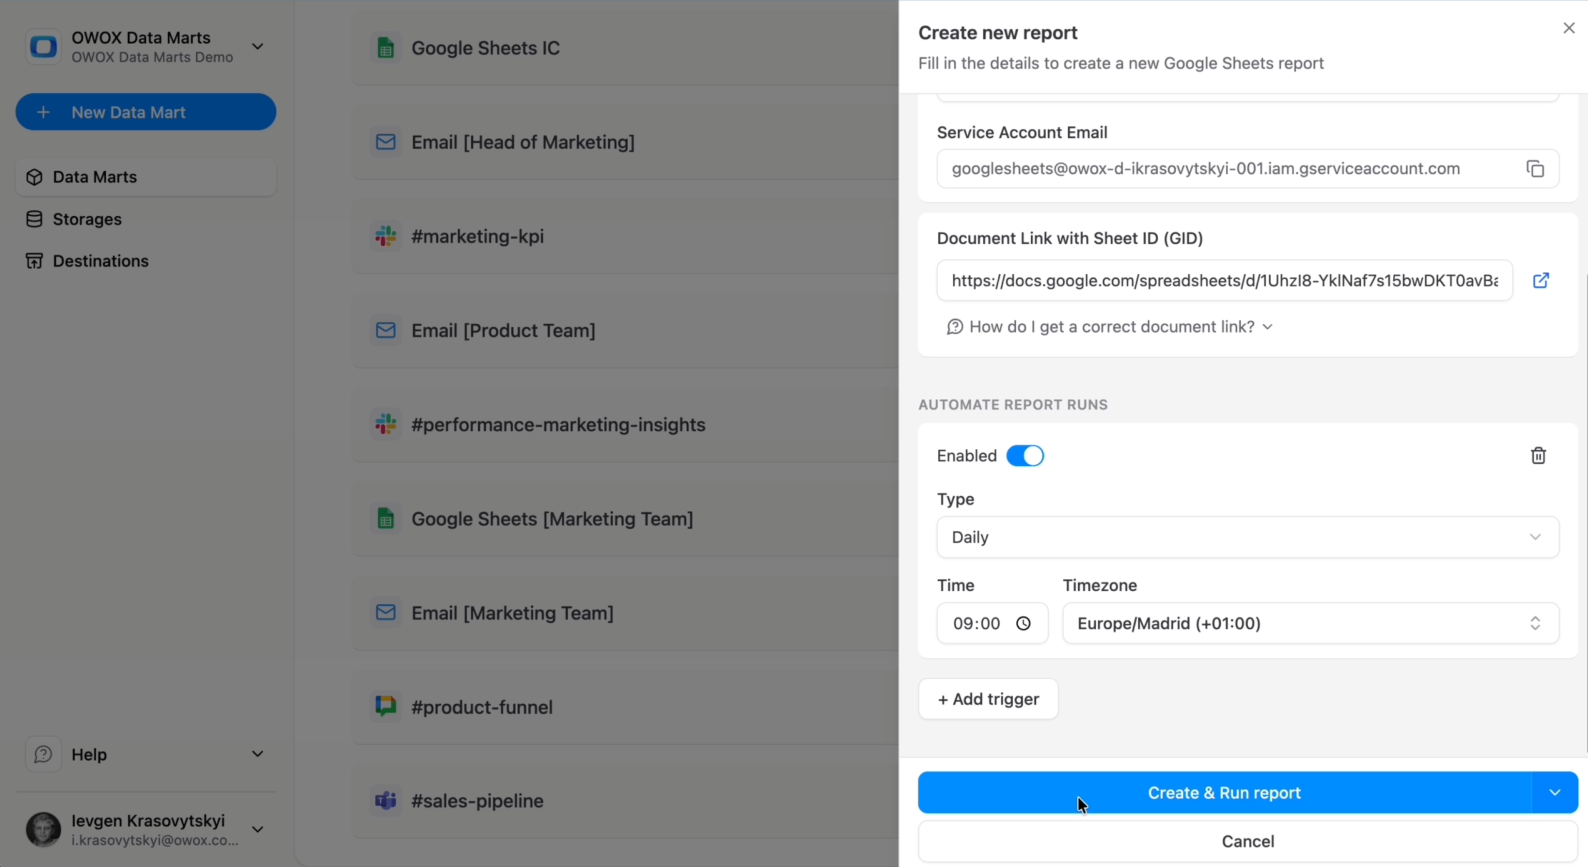
Automate Data Refreshes with Triggers
Manually refreshing reports is a recipe for delays and data inconsistencies. With OWOX, analysts can schedule triggers to automatically refresh Data Marts at set intervals, daily, weekly, or even every 30 minutes.
These automated updates keep dashboards and spreadsheets up to date without manual effort. As a result, “Can you refresh this?” requests no longer appear, and business users always have access to the latest data. It’s a simple but powerful way to ensure reliability, reduce support load, and boost confidence in the numbers.
How OWOX Data Marts Turn One-Off Requests into Reusable Assets
OWOX Data Marts give analysts the tools to transform repetitive, one-off requests into structured, scalable reporting assets. From reusable SQL logic to automated delivery and refresh, here’s how OWOX helps shift from reactive reporting to efficient, governed analytics.
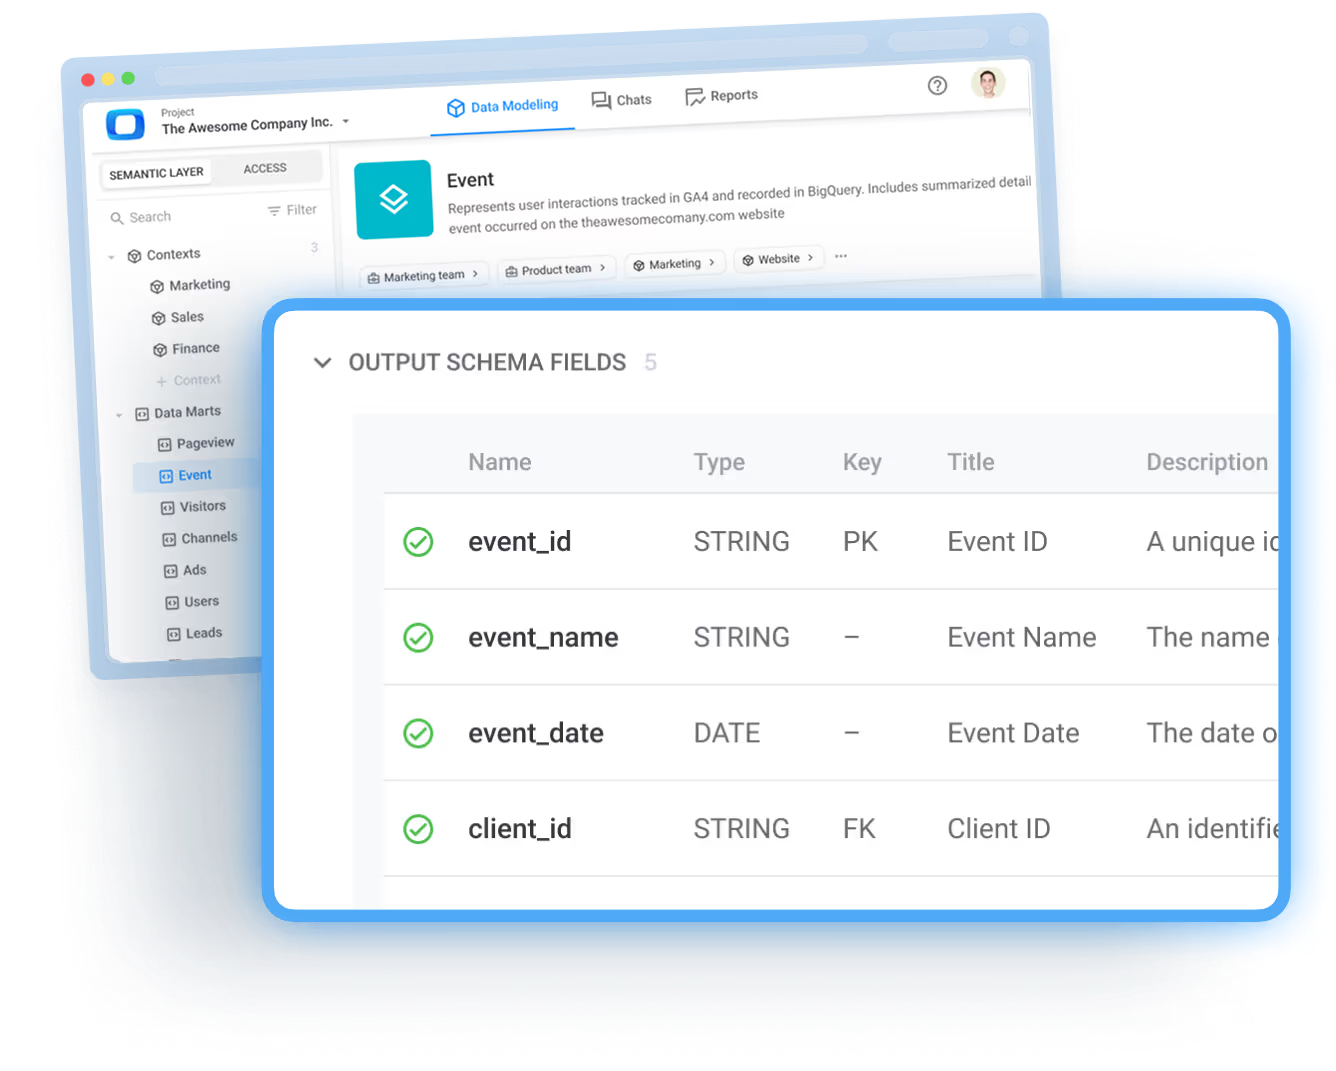
SQL-First Definition for Reusable Logic
With OWOX Data Marts, analysts can turn any ad hoc query into a governed, reusable asset by defining logic directly in SQL. Instead of rewriting similar queries over and over, you define them once, with clear metric definitions, filters, and joins, and save them as a Data Mart.

This approach eliminates duplicated work and ensures that every report referencing that logic reflects the same, consistent definitions. It creates a single source of truth for metrics like spend, CAC, and retention, no more guesswork, no more inconsistencies.
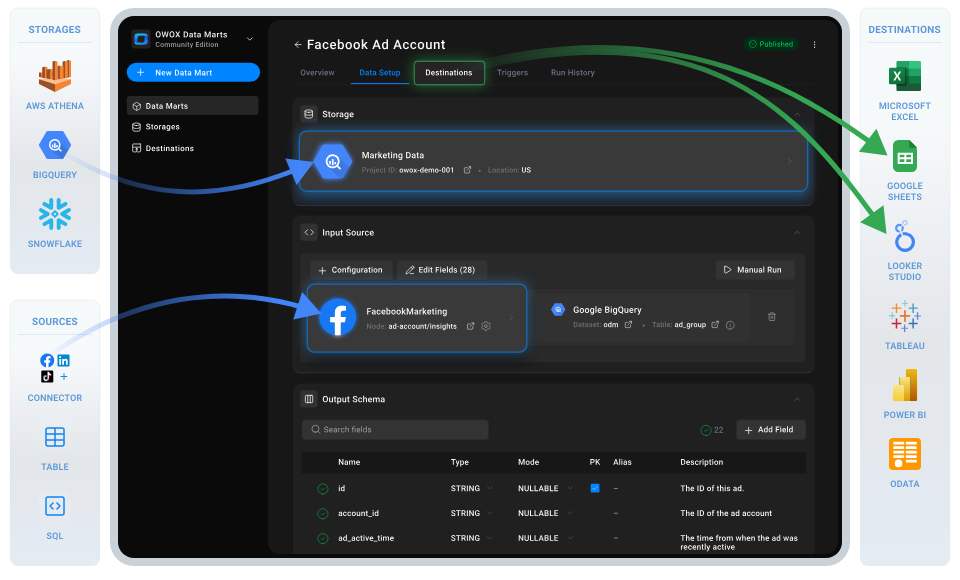
Seamless Delivery to Business Destinations
OWOX Data Marts make it easy to send governed data directly to tools your teams already use, like Google Sheets or Looker Studio. Once a Data Mart is set up, outputs can be automatically delivered to selected destinations without manual exports or SQL reruns.
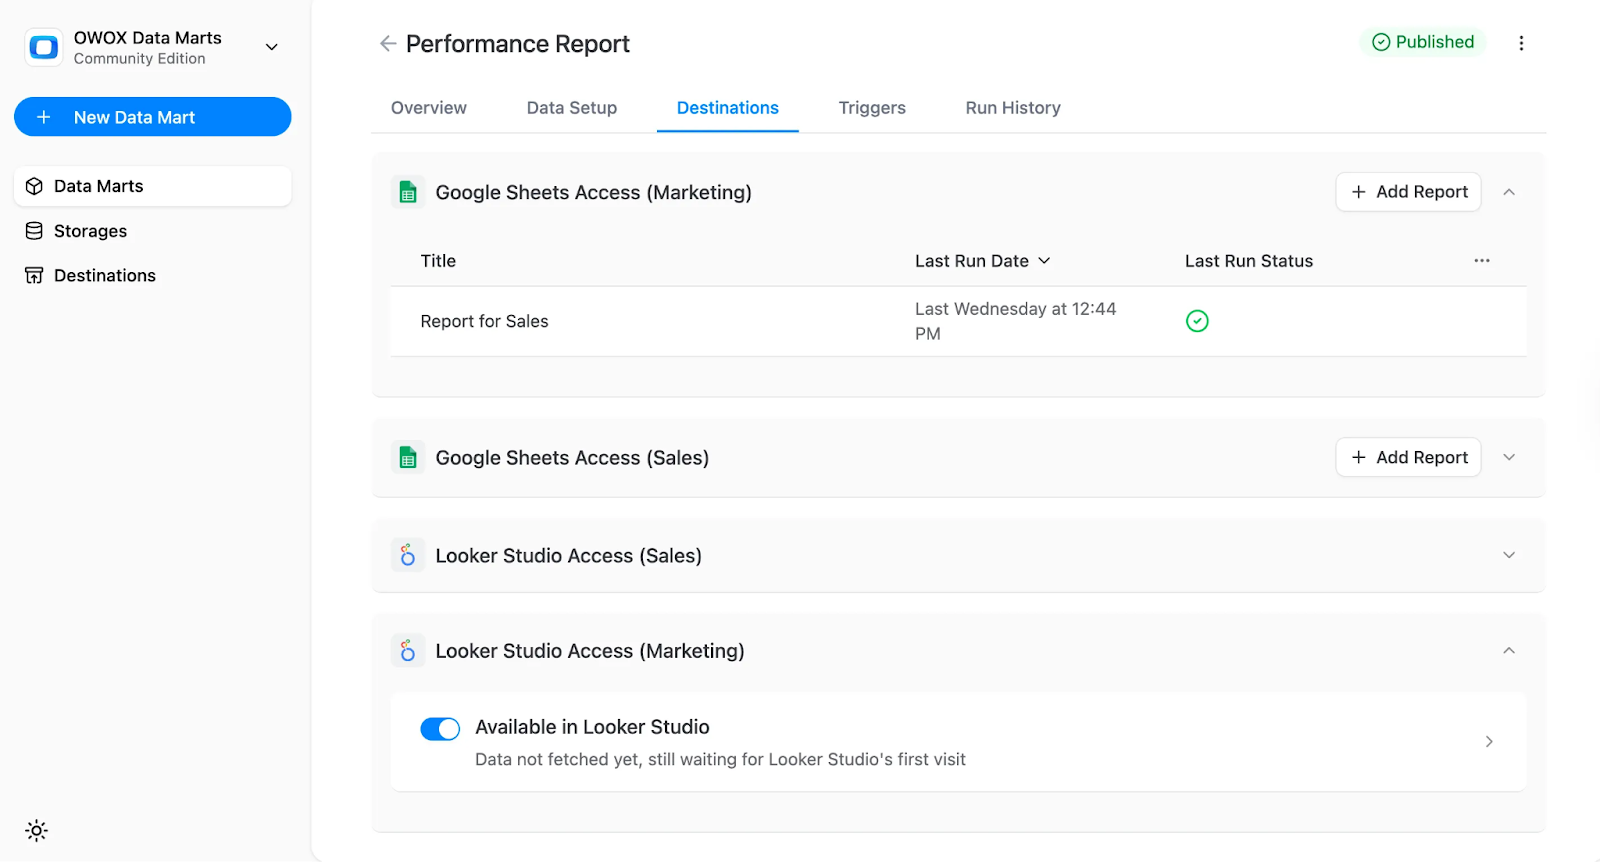
Business users get live, trusted data where they need it, without relying on analysts for every update. This self-service access speeds up decision-making and ensures that everyone, from marketing to finance, works from a consistent source.
Automated Refreshes with Triggers
OWOX lets you automate Data Mart refreshes with two trigger types, keeping reports up to date without manual effort. Here's how each one works:
Connector Triggers: These triggers refresh the source data from your connected platforms (like Facebook Ads or TikTok). You can schedule them to run hourly, daily, or on custom intervals.

Report Triggers: Once the source data is refreshed, report triggers update the Data Marts and destinations. This ensures the latest data flows into Google Sheets or Looker Studio without needing analyst intervention.
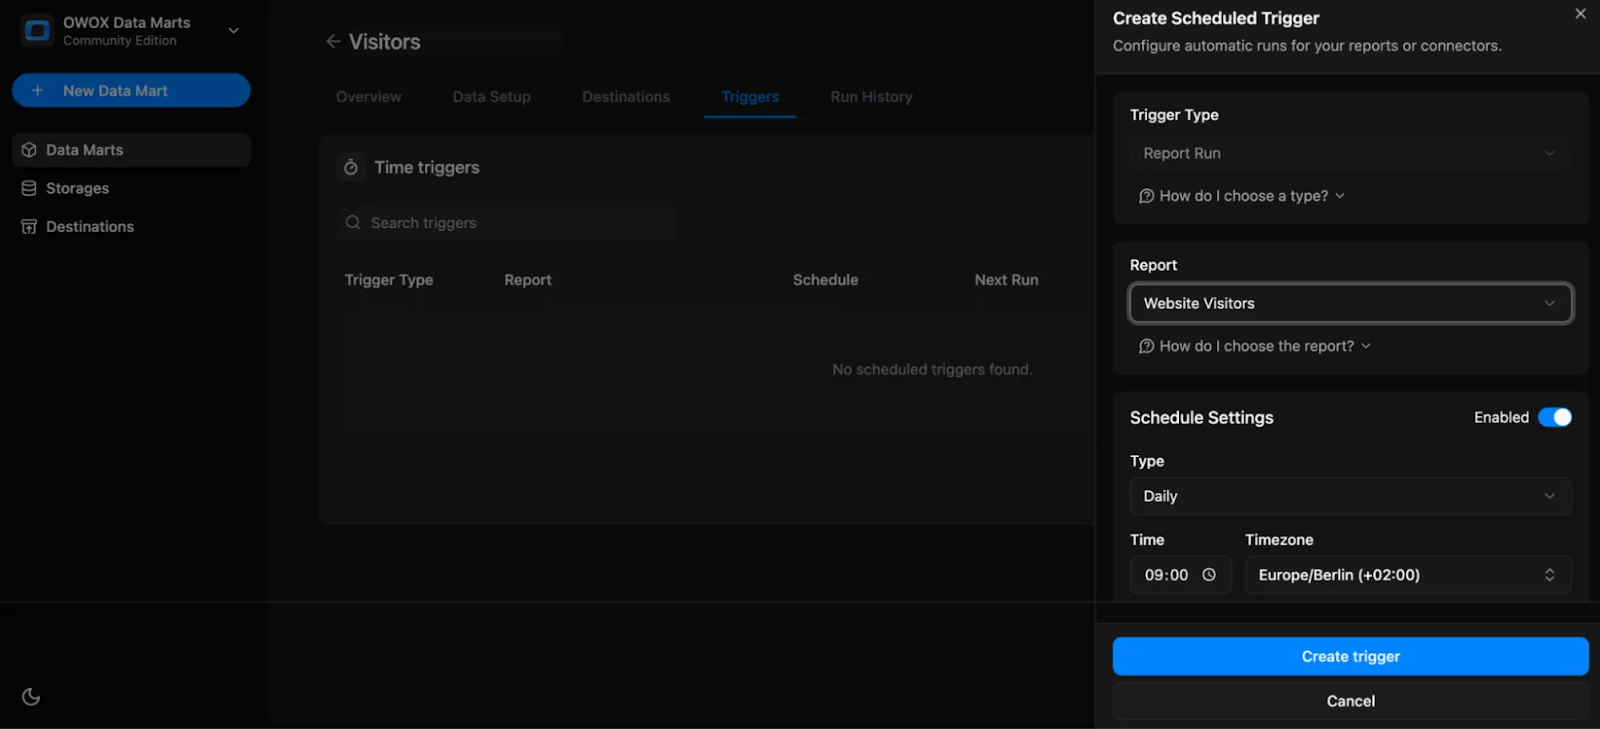
With both triggers in place, your reporting logic remains stable while only the data updates, keeping outputs fresh, reliable, and historically consistent. No more multiple “Can you update this?” Slack messages.
Built-In Governance and Consistency
OWOX Data Marts are designed with governance at the core. When you define SQL logic once and reuse it across dashboards, you eliminate the risk of teams building separate, conflicting definitions for the same metric.
Whether it’s “ad spend,” “active users,” or “churn rate,” every team pulls from the same, governed logic, no silos, no debates. This consistency improves trust in data, prevents duplication, and ensures alignment across marketing, finance, product, and leadership. Analysts stay in control of the logic, while business users get reliable, accurate insights every time.
Empower Analysts to Focus on Strategy
When ad hoc requests are turned into reusable, automated assets, analysts are no longer stuck firefighting. Instead of spending hours on manual SQL, spreadsheet fixes, or last-minute report updates, they can focus on strategic initiatives, building predictive models, identifying growth opportunities, or improving attribution logic.
By removing the noise, OWOX Data Marts free up mental space and time. Analysts can engage in proactive analysis that drives real business value, rather than getting bogged down in repetitive, low-leverage tasks. It’s a shift from short-term fixes to long-term impact.
From Reactive to Proactive Analytics
OWOX enables a fundamental mindset shift for data teams, from constantly reacting to requests to proactively building systems that scale. Instead of scrambling to answer “What was yesterday’s spend?” every morning, analysts define that logic once and let OWOX refresh it automatically.
This shift allows teams to invest in long-term assets like Data Marts, governance, and semantic layers rather than patchwork fixes. Analysts move from being report runners to strategic partners, building frameworks that serve the business again and again.
The Impact of OWOX Data Marts on Analysts and Business Teams
When analysts adopt a structured, governed approach with OWOX Data Marts, the benefits are immediate and felt across the entire organization.
Business teams get faster access to insights, while analysts regain control of their time and focus. Here’s what changes:
- Save Time and Eliminate Rework: No more rewriting the same SQL for repeated questions; logic is defined once and reused.
- Ensure Consistent, Trusted Metrics: Centralized definitions mean every team uses the same logic, reducing confusion and debate.
- Empower Self-Service Analytics: Business users access live data in Google Sheets or Looker Studio without needing analyst support.
- Accelerate Decision-Making: Teams move faster with access to current, governed data, no more waiting on report updates.
- Automate Data Updates: Scheduled triggers keep reports up to date and drastically reduce “Can you update this?” requests.
Teams quickly see a drop in Slack pings, duplicate tickets, and confusion, replaced by clarity, trust, and speed.
Best Practices for Managing Ad Hoc Reporting at Scale
To scale self-service analytics without chaos, analysts need more than just automation.
Below are best practices to help ensure consistency, transparency, and long-term success across teams:
- Standardize Metric Definitions: Align KPIs and dimensions across all Data Marts to avoid confusion and ensure every team uses the same logic.
- Document Everything: Include SQL logic, schema references, field aliases, and usage notes to simplify onboarding and maintenance.
- Organize by Business Domain: Structure Data Marts by department (e.g., marketing, finance) or analytical purpose for easier discovery and use.
- Implement Version Control: Track changes to query logic over time to maintain transparency and reduce the risk of unintentional errors.
- Monitor Performance and Governance: Regularly audit Data Mart health, trigger schedules, and data accuracy to keep the system reliable and trusted.
Self-service analytics works best when backed by disciplined frameworks, not just quick fixes.
Eliminate Reporting Chaos with OWOX Data Marts
If your team is overwhelmed by constant ad hoc requests and manual reporting chaos, it’s time to switch to a smarter system. OWOX Data Marts let you define SQL logic once, automate data refreshes, and deliver consistent, self-serve reports directly into Google Sheets or Looker Studio.
No more repeated SQL pulls or spreadsheet patchwork, just trusted metrics delivered where your teams already work. Free your analysts to focus on strategy while giving business users the answers they need, instantly.
Frequently asked questions
.png)


Finally, a tool that doesn't ask business users to learn a new dashboarding UI. Our marketing team already knows Sheets. OWOX just delivers the right data.
Joinable data marts concept was the thing that sold us. We can now use the semantic layer without building one.
Self-hosted the OSS version on Digital Ocean. Zero vendor lock-in. Contributed a Shopify connector back in week two.