
How to Blend GA4 Conversions with Advertising Spend
Discover methods to link GA4 conversions with ad spend, enabling precise ROI measurement and smarter advertising budget decisions.

You open GA4 to check conversions and compare them with what you spent on ads, but the numbers don’t line up. It’s frustrating, especially when you need to explain performance or plan budgets. The problem isn’t your data; it’s that GA4 and ad platforms don’t speak the same language out of the box.
.png)
In this article, we’ll show you how to blend GA4 conversion data with advertising spend using BigQuery and OWOX Data Marts. You’ll learn how to bring in cost data from different platforms, normalize currencies, create sessions from raw GA4 events, and calculate ROAS and CPA accurately.
By the end, you’ll see how OWOX Data Marts eliminates back-and-forth reporting tickets by blending conversions and ad spend into one reusable, trusted report.
Why Your GA4 and Ad Spend Reports Don't Match by Default
GA4 and ad platforms collect data differently, and most tools don’t connect them out of the box. This creates gaps, mismatched numbers, and confusion across teams. Let’s look at why these reports often fail to align.
GA4 Raw Data Hides Channel Performance
GA4 collects user interactions as individual events, not as sessions or pageviews like before. Whether it’s a scroll, a click, or a video view, each action is recorded separately, making the raw data more granular but also harder to analyze.
When this event data reaches BigQuery, it doesn't come with ready-made reports. There’s no automatic “conversions by campaign” breakdown. Analysts typically need to group events, rebuild sessions, and flag conversions with SQL before meaningful channel-level reporting is possible.
Ad Spend Data Is Scattered Across Platforms

Ad platforms like Google, Facebook, and LinkedIn each store advertising data in their own formats and systems. These platforms don’t talk to each other, and most of them don’t connect directly with GA4.
As a result, analysts often end up pulling data from each platform separately, cleaning it, and attempting to align formats across systems.
This fragmentation makes it difficult to get a complete and reliable view of campaign performance.
Without a centralized source, marketers often end up comparing numbers that don’t align or completely miss important insights. A lot of valuable time gets wasted on collecting and fixing data instead of analyzing it.
Reports Are Split Across Tools and Teams
Your ad spend may live inside platform dashboards, GA4 data in BigQuery, and performance reports in tools like Looker Studio or Google Sheets. Since everything’s stored separately, teams often work with different numbers for the same metric.
This disconnect creates confusion and inconsistent reporting. Without a blended model or centralized backend, teams work with conflicting numbers instead of a single version of the truth.
How to Build a Blended GA4 + Ad Spend Report in BigQuery
To get a complete view of marketing performance, you need to bring GA4 conversions and ad spend into one place. Here’s a step-by-step guide to building a blended report using BigQuery and OWOX Data Marts.
Step 1: Collecting Ad Cost Data into BigQuery
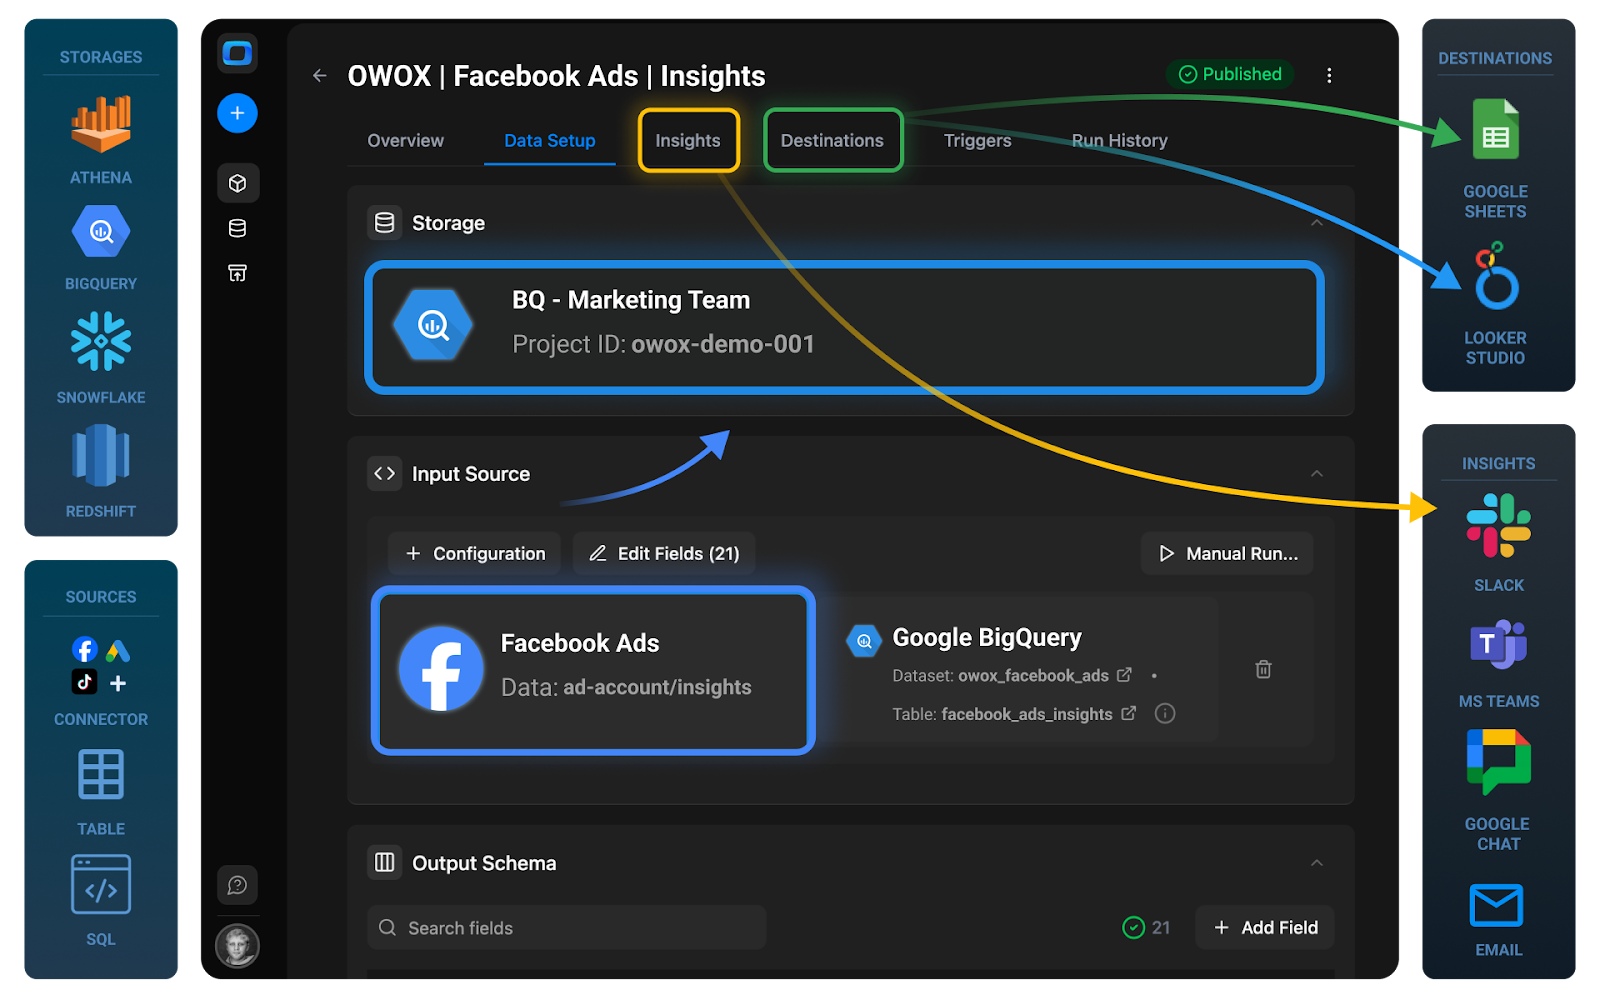
With OWOX Data Marts (Cloud, available at app.owox.com), you can connect advertising platforms such as Facebook Ads, LinkedIn Ads, and TikTok Ads. Analysts configure accounts, fields, and date ranges through the UI – no coding required.
Once connected, OWOX automatically loads fresh ad spend data into BigQuery on your schedule. This removes the constant CSV exports, manual uploads, or one-off ticket requests for updated spend data.”
Step 2: Normalizing Currency with OpenExchangeRates
If your accounts run in multiple currencies, you need a consistent base currency (usually USD) for clear reporting.
With OWOX, you can fetch exchange rates daily (e.g., from OpenExchangeRates) into a BigQuery table. Then, use a simple SQL join to convert all ad costs into USD.
This ensures your ROAS, CPA, and spend totals remain consistent across platforms and regions, and prevents endless requests for currency-adjusted reports.
Step 3: Building the Blended Ad Spend Data Mart
Ad costs across platforms, such as Facebook, LinkedIn, and TikTok, can be combined into a single standardized table in BigQuery.
Once these cost tables are loaded (via OWOX connectors or other methods), analysts can use UNION ALL to merge them into a single schema, making spend consistent and comparable across channels.
Define this SQL logic once as a Data Mart in OWOX. It updates automatically, so analysts don’t need to rebuild the same “total spend by channel” report whenever a new campaign launches.
This is where OWOX directly reduces ticket overload: one reusable Data Mart replaces dozens of repeat requests.
1SELECT
2  'facebook' AS source,
3  fa.campaign_name AS campaign,
4  fa.adset_name    AS ad_group,
5  DATE(fa.date)    AS date,
6  fa.spend         AS cost,
7  fa.currency      AS currency,
8  fa.spend / er.rate_to_usd AS cost_usd
9FROM `project.dataset.facebook_ads` fa
10JOIN `project.dataset.exchange_rates` er
11  ON er.currency_code = fa.currency
12 AND er.date = DATE(fa.date)
13
14UNION ALL
15
16SELECT
17  'linkedin' AS source,
18  li.campaign_name AS campaign,
19  li.adgroup_name  AS ad_group,
20  DATE(li.date)    AS date,
21  li.spend         AS cost,
22  li.currency      AS currency,
23  li.spend / er.rate_to_usd AS cost_usd
24FROM `project.dataset.linkedin_ads` li
25JOIN `project.dataset.exchange_rates` er
26  ON er.currency_code = li.currency
27 AND er.date = DATE(li.date)
28
29UNION ALL
30
31SELECT
32  'tiktok' AS source,
33  tt.campaign_name AS campaign,
34  tt.adgroup_name  AS ad_group,
35  DATE(tt.date)    AS date,
36  tt.spend         AS cost,
37  tt.currency      AS currency,
38  tt.spend / er.rate_to_usd AS cost_usd
39FROM `project.dataset.tiktok_ads` tt
40JOIN `project.dataset.exchange_rates` er
41  ON er.currency_code = tt.currency
42 AND er.date = DATE(tt.date);
Step 4: Building the Sessions Data Mart
GA4 exports raw event data into BigQuery; every scroll, click, and view is a separate row. To turn that into meaningful sessions and conversions, analysts need to group events with SQL.
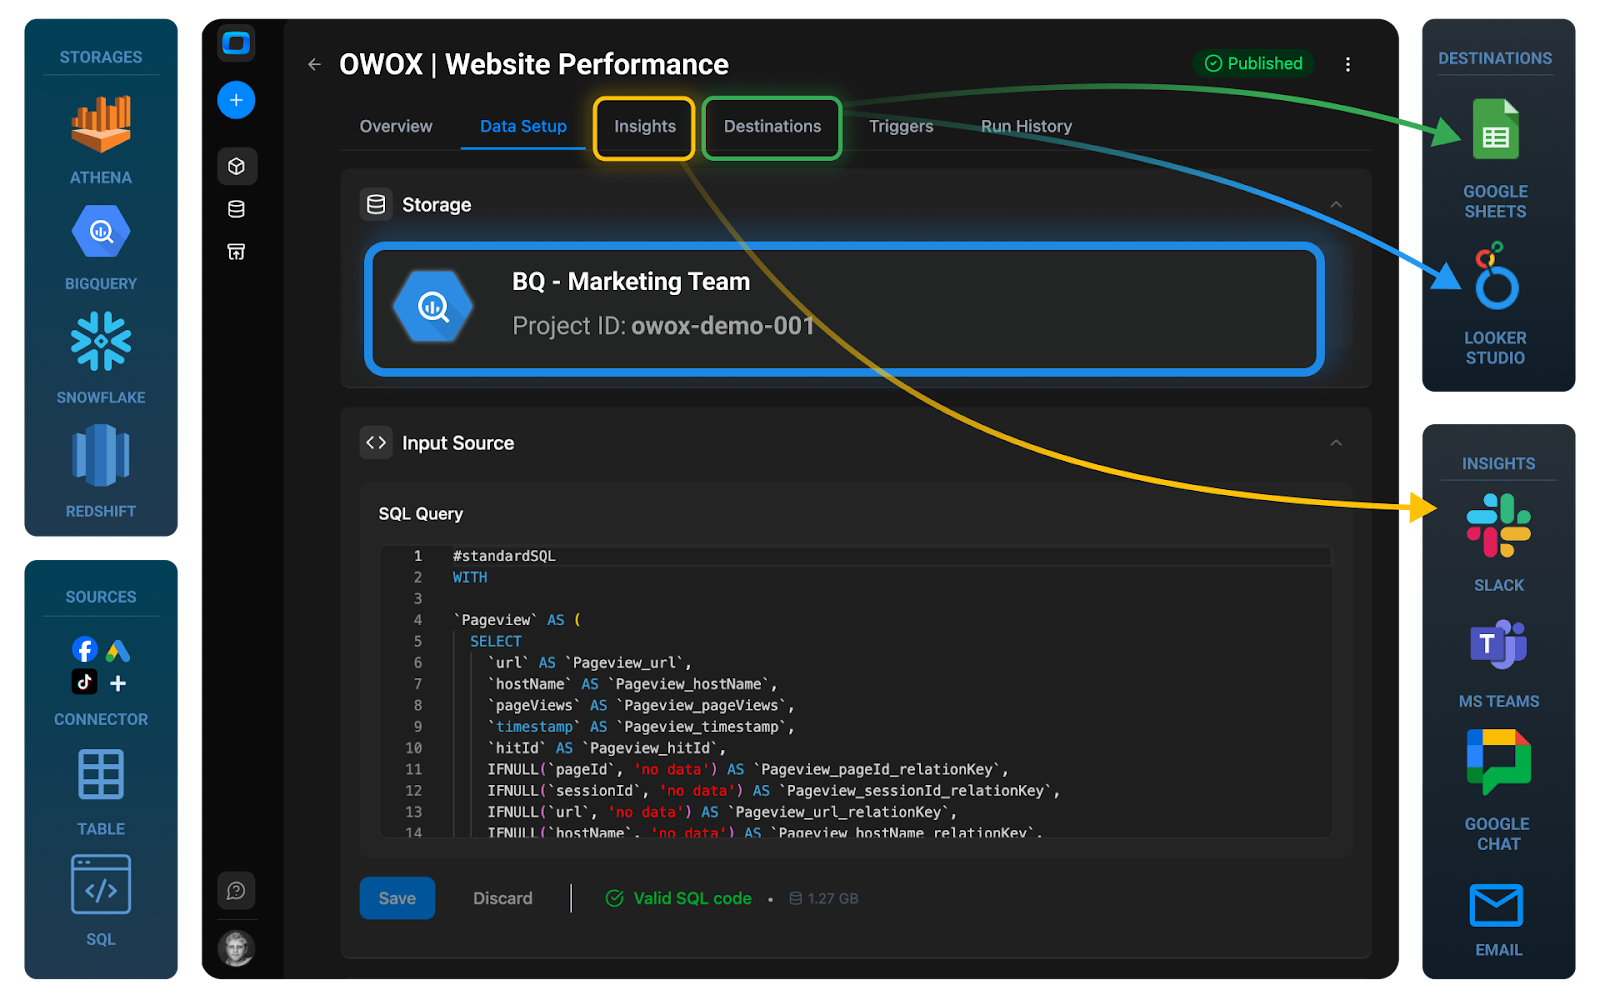
OWOX provides ready-to-use templates for GA4 sessions, so you don’t have to rebuild logic from scratch. Once defined as a Data Mart, the session table becomes a reusable, governed dataset.
Instead of analysts repeatedly being asked to recalculate sessions by campaign, the session Data Mart provides those answers directly.
Step 5: Blending Spend + Conversion Data
Now combine the two:
- Ad Spend Data Mart → standardized, currency-normalized costs.
- Sessions Data Mart → conversion-ready sessions.
In OWOX Data Marts, analysts can create a SQL-based Data Mart that joins ad cost and session data using shared primary keys such as UTM parameters.
This unified spend-to-session mapping becomes a reusable Attribution Data Mart that powers ROAS, CAC, and payback period analysis across reports.
This eliminates duplication and ensures every team uses the same numbers for ROAS, CPA, and CAC – no more “same KPI, different number” across departments.
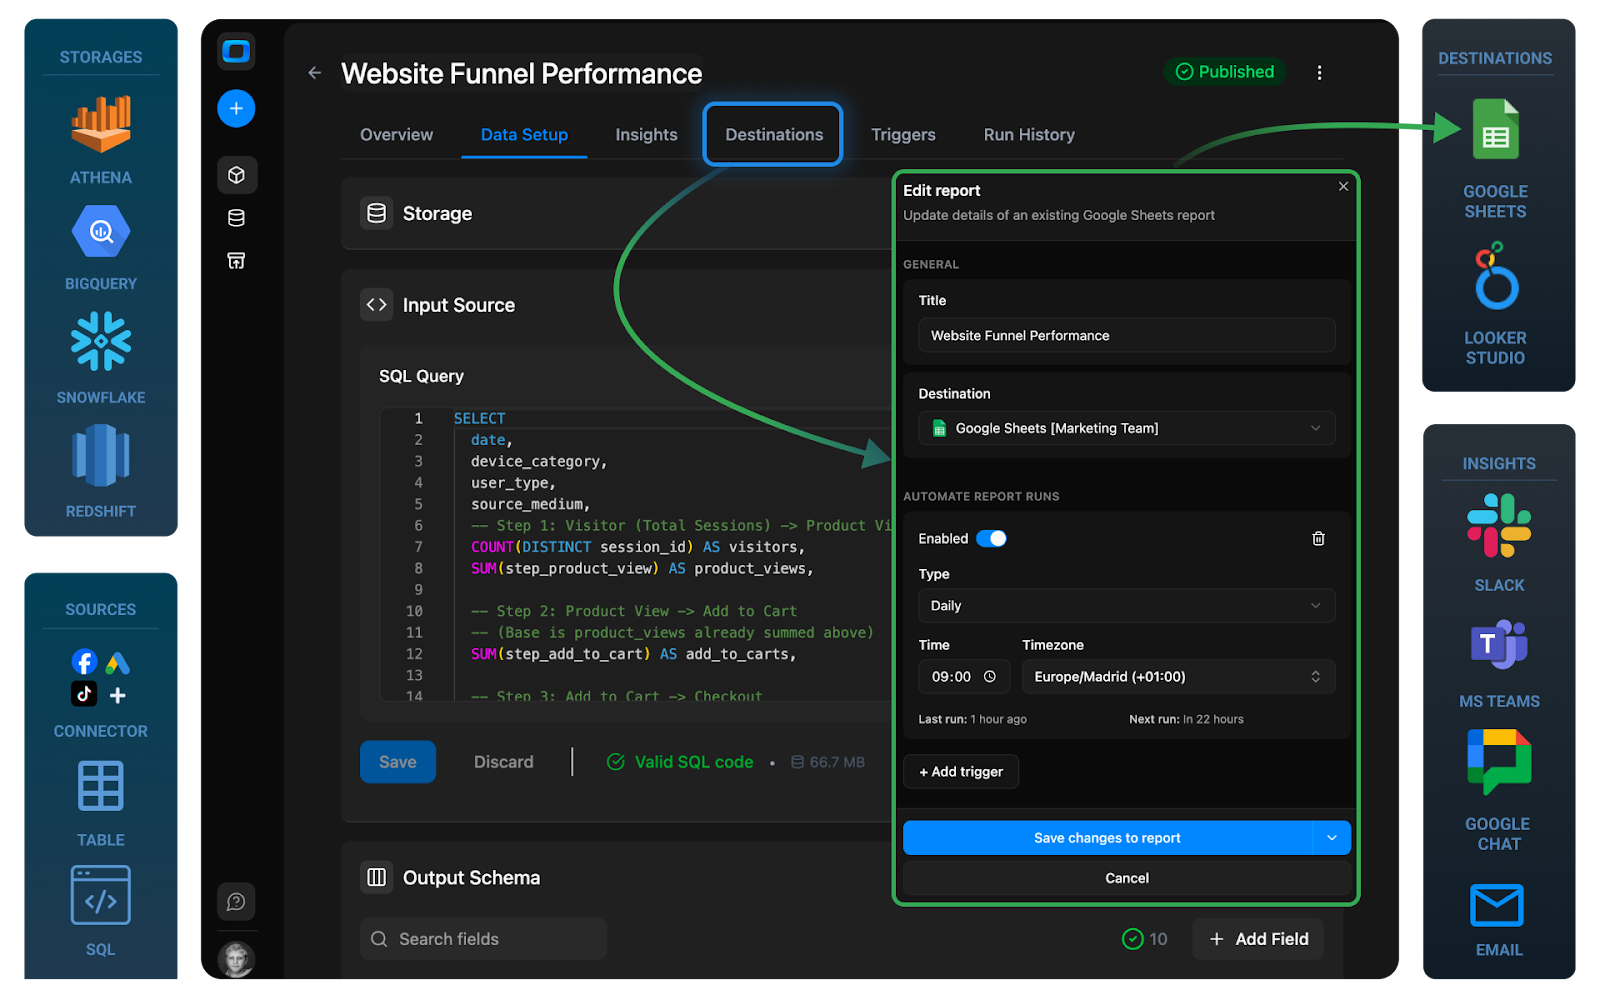
Step 6: Delivering the Report to Business Users
Finally, make the unified Data Mart accessible. With OWOX, you can deliver data to Google Sheets and Looker Studio as Destinations.
- Analysts maintain control of the logic and governance.
- Business users self-serve reports in familiar tools.
- Report Triggers refresh data on your schedule (daily, weekly, hourly).
This means no more repeated requests for fresh ROAS numbers. Business teams always see up-to-date insights while analysts focus on higher-value work.
What You’ve Built with Your Blended Reporting Setup
After blending GA4 and ad spend data in BigQuery, you now have a reliable reporting system. This setup brings clarity, consistency, and trust to your marketing performance metrics, making it easier for teams to measure what truly matters.
Reusable and Documented Marketing Data
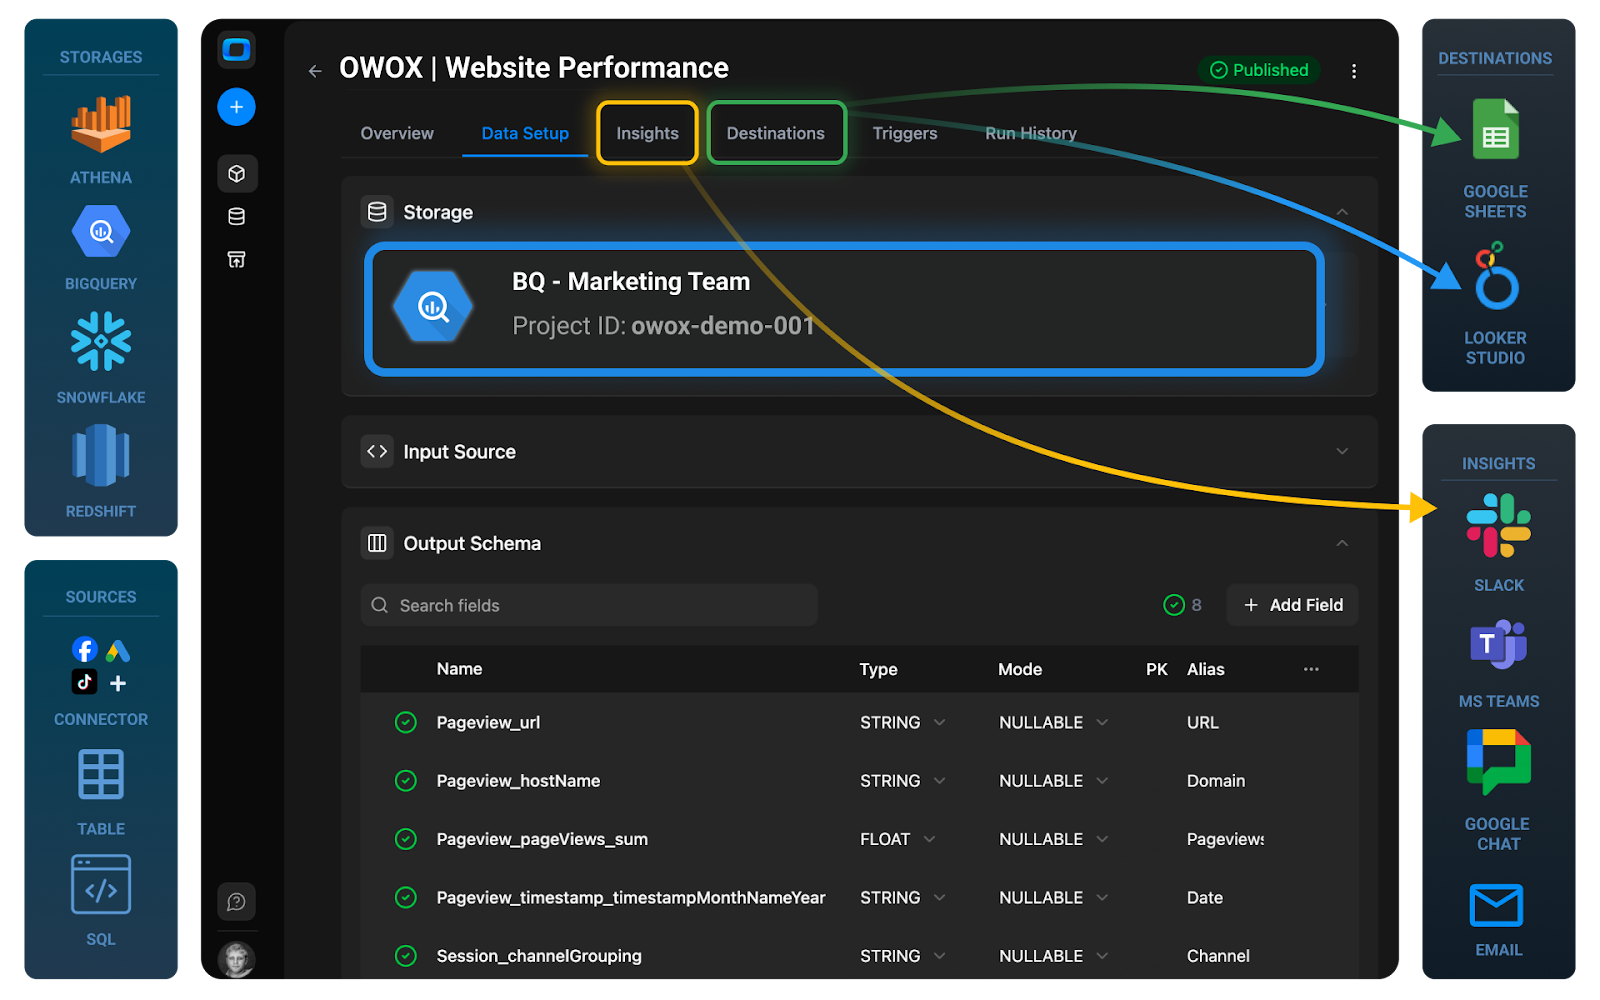
Instead of rebuilding reports for every new campaign, you now have a structured and reusable system in place. All the SQL logic for sessions, ad spend, ROAS, and other key metrics is stored and governed inside OWOX Data Marts. Each Data Mart comes with schema details, field aliases, and clear documentation, making it easy to understand, audit, and maintain.
This setup can be reused for future campaigns or expanded with new KPIs without starting from scratch. It saves analysts time, reduces errors, and ensures consistent measurement across the business – so everyone works from the same trusted framework.
One Trusted Source for Spend, ROAS, and CAC
Your blended Data Mart brings together ad spend from all platforms and conversions from GA4 into one reliable dataset. This means every team – from marketing to finance – now uses the same numbers for ROAS, CPA, and customer acquisition cost.
No more version mismatches or conflicting reports. Whether you’re building a dashboard, preparing a performance review, or making budget decisions, everyone has access to the same trusted Data Mart in BigQuery as the single source of truth.
Analysts Stay in Control While Teams Self-Serve
With this setup, analysts define and manage the core logic of your marketing data model in OWOX Data Marts. They control how the data is cleaned, joined, and calculated, ensuring accuracy and consistency throughout.
At the same time, business users can access live reports through defined Destinations like Google Sheets and Looker Studio.
With scheduled Report Delivery, reports update automatically, so marketers, growth teams, and leadership can explore performance metrics on their own – without compromising data quality.
Start Building Trusted ROAS Reports with OWOX Data Marts
Sign up today to get started in the Cloud. The Cloud edition makes it easy to connect ad platforms, build reusable Data Marts, and deliver live reports to Sheets or Looker Studio, without extra engineering work.
For teams who prefer to self-host, OWOX Data Marts offers the same connectors and UI-driven setup in your own environment. It’s analyst-friendly, requires minimal coding, and ensures you maintain full control over your data, logic, and credentials.
Frequently asked questions
.png)


Finally, a tool that doesn't ask business users to learn a new dashboarding UI. Our marketing team already knows Sheets. OWOX just delivers the right data.
Joinable data marts concept was the thing that sold us. We can now use the semantic layer without building one.
Self-hosted the OSS version on Digital Ocean. Zero vendor lock-in. Contributed a Shopify connector back in week two.