
How to Choose a Data Warehouse: A Practical Guide for Data Analysts
Explore when your team needs a data warehouse, compare leading platforms, and plan a governed data mart layer for reliable analytics.


Modern analytics teams rarely suffer from a lack of data. The real problem is scattered data: product events in one tool, ad spend in another, subscriptions in a third, revenue in a fourth. Everyone is exporting CSVs, rebuilding the same logic in dashboards, and arguing over “which number is right.”
.png)
At some point, the pain becomes impossible to ignore. Dashboards break when someone changes a field in the source tool. Monthly reporting takes days instead of hours. Your “single source of truth” is actually six different Google Sheets.
This is usually when teams start asking: Do we need a data warehouse? A⁸nd if yes, which one?

This guide is for data analysts, BI leads, and early analytics hires at SaaS, e‑commerce, and other digital-first companies who are:
- Hitting the limits of spreadsheets-only or in‑tool reporting
- Struggling with fragmented tracking across marketing, product, and finance
- Considering adopting their first cloud data warehouse or migrating from an existing one
We’ll walk through a practical, vendor‑neutral way to decide if you actually need a warehouse, how to evaluate leading platforms, and what to do after you’ve picked one – specifically, how to build a governed data mart layer your stakeholders can trust.
Why this guide and how to use it
Most content about data warehouses either stays at the buzzword level (“lakehouse”, “serverless”, “AI‑powered”) or dives straight into implementation details (partitions, columnar storage, query optimizers) without helping you answer the fundamental questions:
- Is a data warehouse the right next step for my team right now?
- If yes, which warehouse makes sense given our stack, budget, and skills?
- What should we plan after choosing a warehouse so we don’t end up with a centralized but still messy dataset?
This article is structured to support the actual decision-making process that data teams go through:
- Clarify whether you truly need a warehouse now – the signs you can’t postpone it any longer.
- Understand the core evaluation dimensions – cost model, performance, ecosystem, governance, scalability, and team fit.
- Compare the leading cloud data warehouses neutrally – without pushing a single “winner.”
- Plan your data mart layer – so analysts can work with clean, reusable artifacts instead of raw tables.
You can read it end to end, or jump to the part that matches where your team is today.
What you will (and won’t) find here
You will not find:
- A one-size-fits-all verdict like “Warehouse X is the best for everyone.”
- An exhaustive technical deep dive into every engine's internals
- A marketing pitch disguised as a comparison
You will find:
- A pragmatic checklist of questions to ask before choosing a warehouse
- Concrete trade‑offs between major platforms, framed in business and team terms
- Examples tailored to SaaS, subscription, and e‑commerce analytics use cases
- Guidance on how to avoid the common trap: centralizing data but not making it useful
Throughout the guide, we’ll focus on how your choice affects everyday work for analysts and stakeholders: query speed, reliability of metrics, time to build new reports, and the total cost of running your stack over time.
When Do You Need A Data Warehouse
Most analytics teams don’t start with a data warehouse.
They start with whatever is fastest to set up: pulling exports from ad platforms, copy‑pasting product metrics into Google Sheets, and building a few dashboards directly on top of tools like GA4, Stripe, or the CRM. This works – until it really doesn’t.
As data volume grows and the business becomes more complex, these ad‑hoc setups start to crack. Numbers don’t match across reports, core dashboards become fragile, and every new question from leadership turns into an unplanned mini‑project.
This is usually the point where the “Do we need a warehouse?” conversation begins. Before you invest, it’s important to understand both the symptoms that you’re ready and the limits of what a warehouse can solve by itself.
Typical Early-Stage Setup and Its Limitations
Early‑stage SaaS and e‑commerce companies tend to follow a similar analytics path:
- Spreadsheets as the glue: Weekly CSV exports from Meta Ads, Google Ads, Shopify, Stripe, and product analytics tools, combined into a “master” Google Sheet or Excel file.
- Direct BI connections: Dashboards in Looker Studio, Power BI, or Tableau built directly on top of SaaS tools’ connectors or APIs.
- Isolated in‑tool reporting: Each team (marketing, product, finance) relies on its own tool’s built‑in reports, with manual adjustments.
This setup breaks down as soon as:
- You need cross‑tool views, e.g., “LTV by acquisition channel” or “ROAS by cohort,” which require joining revenue and cost from multiple systems.
- The business introduces new pricing, new markets, or new products, multiplying the number of metrics and segments you track.
- You have more than one person building reports, and each has their own formulas, definitions, and naming conventions.
The result is a fragile reporting stack where every schema change, new campaign, or product feature can silently break your dashboards, and you often only notice at month‑end.
Symptoms Indicating You’re Ready for a Data Warehouse
You don’t need a warehouse just because it’s fashionable. You need it when the friction of your current approach exceeds the cost and complexity of centralizing your data, for example:
- Conflicting metrics in meetings: CAC, MRR, or conversion rates differ between dashboards and spreadsheets, and nobody can quickly explain why.
- Chronic “CSV ops.”: Analysts spend hours each week downloading, cleaning, and merging exports instead of analyzing data.
- Data silos between teams: Marketing can’t see downstream revenue or retention; the product can’t easily connect feature usage to acquisition channel.
- Slow, brittle reporting: A single schema change in Shopify, Stripe, or the CRM breaks multiple dashboards; fixes require manual patching each time.
- Growing complexity of questions: Leadership asks for cohort‑level profitability, multi‑touch attribution, or payback periods by channel and geography – things that are painful or impossible with spreadsheets alone.
- Security and access issues: Sensitive data is copied into multiple sheets or BI extracts with ad‑hoc permissions, making governance and audits difficult.
If several of these resonate, it’s a strong sign that centralizing your data in a warehouse is no longer a “nice to have” but a prerequisite for reliable analytics.
What Teams Hope a Warehouse Will Fix vs What It Actually Fixes
When teams first consider a warehouse, expectations are often unrealistic. It’s worth separating hopes from reality to avoid disappointment and poor design choices.
What teams often hope a warehouse will magically fix:
- “Once we have a warehouse, all our numbers will match everywhere.”
- “The warehouse will clean our data and fix tracking issues.”
- “Stakeholders will be able to self‑serve any report without help from analysts.”
- “Centralizing data will automatically give us better attribution and LTV models.”
What a warehouse actually fixes well:
- Provides a central, scalable store for raw and processed data from all your tools.
- Enables you to join data sources that couldn’t be combined reliably in spreadsheets or directly in BI.
- Creates a single execution layer for business logic, so you can define metrics consistently – if you invest in modeling.
- Makes it possible to implement version‑controlled transformations and repeatable data pipelines.
Crucially, a warehouse does not define your metrics or data contracts for you. That’s where the data mart layer comes in: curated, business‑friendly tables that encode agreed‑upon definitions and transformations.
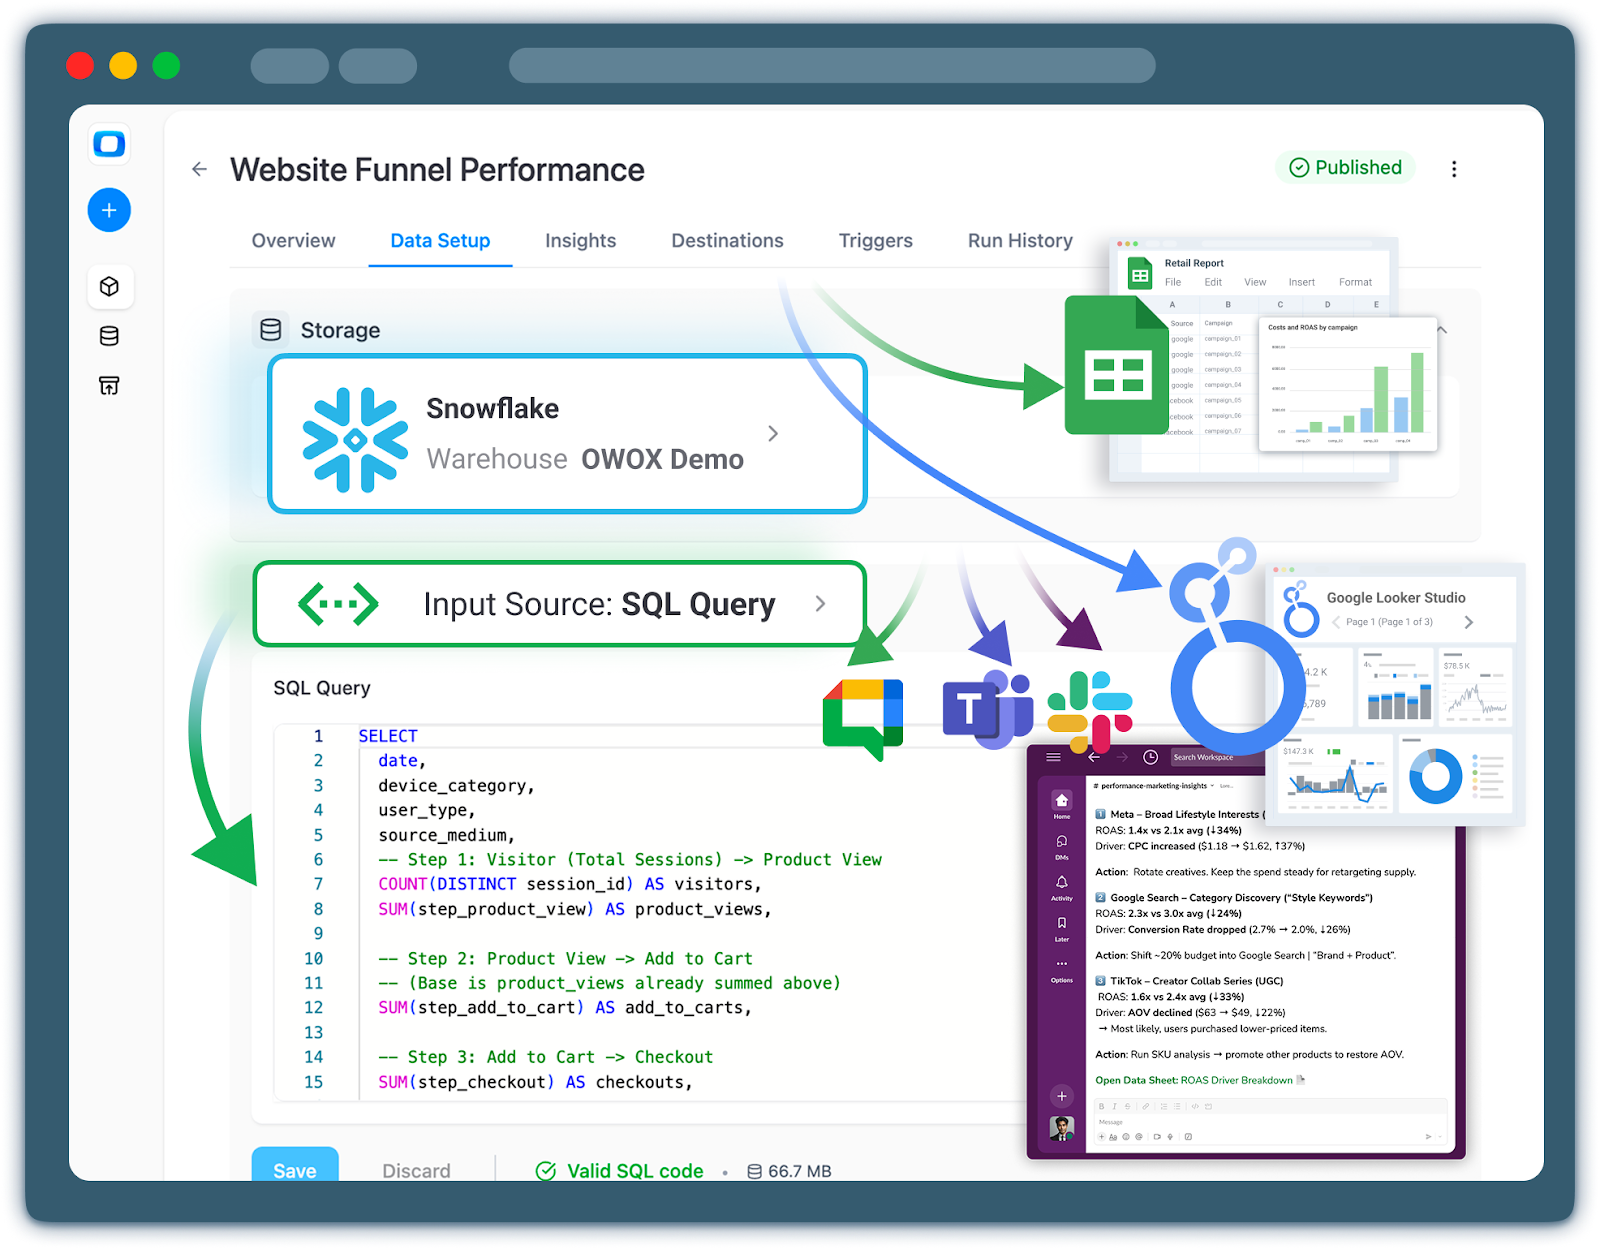
You can build these data marts yourself using SQL and transformation tools, or accelerate the process with governed, ready‑made models such as those in OWOX Data Marts, which sit on top of your warehouse and standardize common marketing and product analytics schemas.
Understanding this distinction upfront helps you evaluate warehouse options with clear eyes and plan the modeling work required to turn centralized data into trustworthy analytics.
Where Data Warehouse Fits in Your Analytics Infrastructure
Before you compare vendors or pricing models, it helps to be specific about what a data warehouse actually is – and just as importantly, what it isn’t.
A warehouse is the technical backbone of your analytics stack, but it’s only one part of a broader architecture that also includes ingestion, modeling, governance, and reporting. Confusing these layers is a common source of disappointment (“We bought a warehouse, but our reports are still a mess”).
At a high level, think of your analytics architecture in four layers:
- Data sources & ingestion – tools that generate data and move it into the warehouse.
- Data warehouse (infrastructure) – where data is stored, processed, and queried.
- Modeling & data marts (semantic layer) – where raw data is transformed into business-ready tables and metrics.
- BI, AI, and activation – where users explore data, build dashboards, and feed models or downstream systems.
The warehouse sits in the middle of this flow, powering everything above it.
Core Responsibilities of a Data Warehouse: Storage, Compute, and Querying
A modern cloud data warehouse has three primary jobs: store data, process data, and serve queries.
Storage: central, scalable data persistence
The warehouse is where structured data from your sources lives long-term. This includes:
- Event streams from product analytics or tracking (pageviews, clicks, custom events)
- Transactional data from billing, subscriptions, and orders
- Marketing and advertising data from ad platforms, CRMs, and email tools
It handles growth in both volume (billions of rows) and variety (different schemas, new fields, new tables) without you needing to provision servers manually.
Compute: transforming and aggregating data
The warehouse provides the compute engine that runs your SQL transformations and aggregations:
- Joining tables across sources (e.g., ad spend with subscription revenue)
- Calculating derived fields (e.g., trial-to-paid conversion, net revenue)
- Building intermediate layers like sessions, orders, or user profiles
Different platforms expose this via concepts like “virtual warehouses”, “compute clusters”, or “query engines”, but the core idea is the same: you pay for processing data, usually in a usage-based model.
Querying: interactive analytics at scale
Finally, the warehouse serves as the query endpoint for BI tools, notebooks, and programmatic access:
- BI tools connect via SQL/JDBC/ODBC drivers.
- Analysts and data scientists query it directly.
- Applications or AI agents can run parameterized queries.
The key value here is performance and concurrency: many users can run complex queries over large datasets, with manageable latency and predictable costs (if you design it well).
In short, the data warehouse is the engine and parking lot for your data – not the car’s dashboard, not the map, and not the driving rules.
What a Warehouse Does Not Do: Metrics Governance and Reporting
Because warehouses are central, teams often expect them to magically solve higher‑level problems that actually live in other layers. It’s important to draw a clear line between infrastructure and semantic/business logic.
A data warehouse, by itself, does not:
- Define business metrics: It doesn’t decide what “active user”, “churned customer”, or “qualified lead” means. Those are semantic definitions implemented as SQL logic on top of the warehouse.
- Enforce consistent calculations: The warehouse happily runs any valid query you send it – even if two dashboards define MRR or CAC in conflicting ways. Without an explicit semantic or data mart layer, inconsistency is normal.
- Provide user-friendly views for business stakeholders: Raw tables imported from tools (e.g., ga4_events_2025_02_25, shopify_orders_raw, fb_ads_insights) are rarely suitable for non‑technical users. They need curated tables and clear naming.
- Offer reporting and visualization: While some platforms have basic built‑in dashboards, serious reporting and exploration usually happen in dedicated BI tools or notebooks connected to the warehouse.
- Automatically clean or fix data quality issues: Missing fields, inconsistent IDs, broken tracking parameters, or incorrect event mapping are all upstream or modeling problems. The warehouse simply stores what it receives and executes the SQL you write.
Understanding this boundary avoids a common trap: investing in a powerful warehouse, then being surprised when you still need to build (or buy) a data modeling and governance layer on top.
Separating Infrastructure, Modeling, and Reporting Layers
For sustainable analytics, it helps to design your stack in separate but connected layers:
- Infrastructure (warehouse + ingestion) - Handles data movement, storage, and computation. Concerned with reliability, scalability, cost, and performance.
- Modeling & semantics (transformations + data marts) - Encodes business logic: joins, aggregations, metric definitions, and dimensional modeling. Concerned with correctness, reuse, and understandability.
- Reporting, AI, and activation (BI, notebooks, reverse ETL) - Delivers insights and actions: dashboards, ad‑hoc analysis, machine learning features, and data pushed back into tools.
Keeping these layers distinct has practical benefits:
- Consistency – Business definitions live in one place (models/data marts), not spread across dozens of dashboards and ad‑hoc queries.
- Change management – You can evolve underlying schemas and logic without breaking every report, because BI tools sit on top of stable data marts.
- Scalability – As your team grows, new analysts can build on existing models instead of re‑inventing joins and calculations.
- Vendor flexibility – You can change BI tools or add AI/ML workloads without rewriting your entire data pipeline.
When evaluating warehouses, you’re choosing the infrastructure layer. But to make that choice wisely, you need a clear picture of how it will support your modeling and reporting strategies.
How a Data Mart Layer Sits Between Warehouse and Business Users
The missing piece between raw warehouse tables and dashboards is the governed data mart layer.
A data mart is a curated set of tables or views focused on a specific domain, such as marketing, product, sales, or finance, with standardized, business‑friendly schemas. For example:
- marketing_performance (by channel, campaign, and cohort)
- subscription_revenue (MRR, churn, expansion per customer and month)
- customers_360 (unified profile with acquisition, behavior, and monetization)
This layer lives inside the warehouse but plays a different role:
- Centralizes logic
Joins, filters, and metric definitions are implemented once and reused across dashboards and tools. - Enables safe self‑service analytics
BI tools and even AI assistants can connect to these data marts without exposing raw, messy, or sensitive tables. Business users see understandable columns like first_purchase_date instead of low‑level event schemas. - Improves performance and cost control
Queries run against optimized, denormalized tables rather than complex multi‑join queries over raw data every time. - Supports AI and automation
Feature stores, predictive models, and AI copilots work best when they consume clean, governed data – not raw logs.
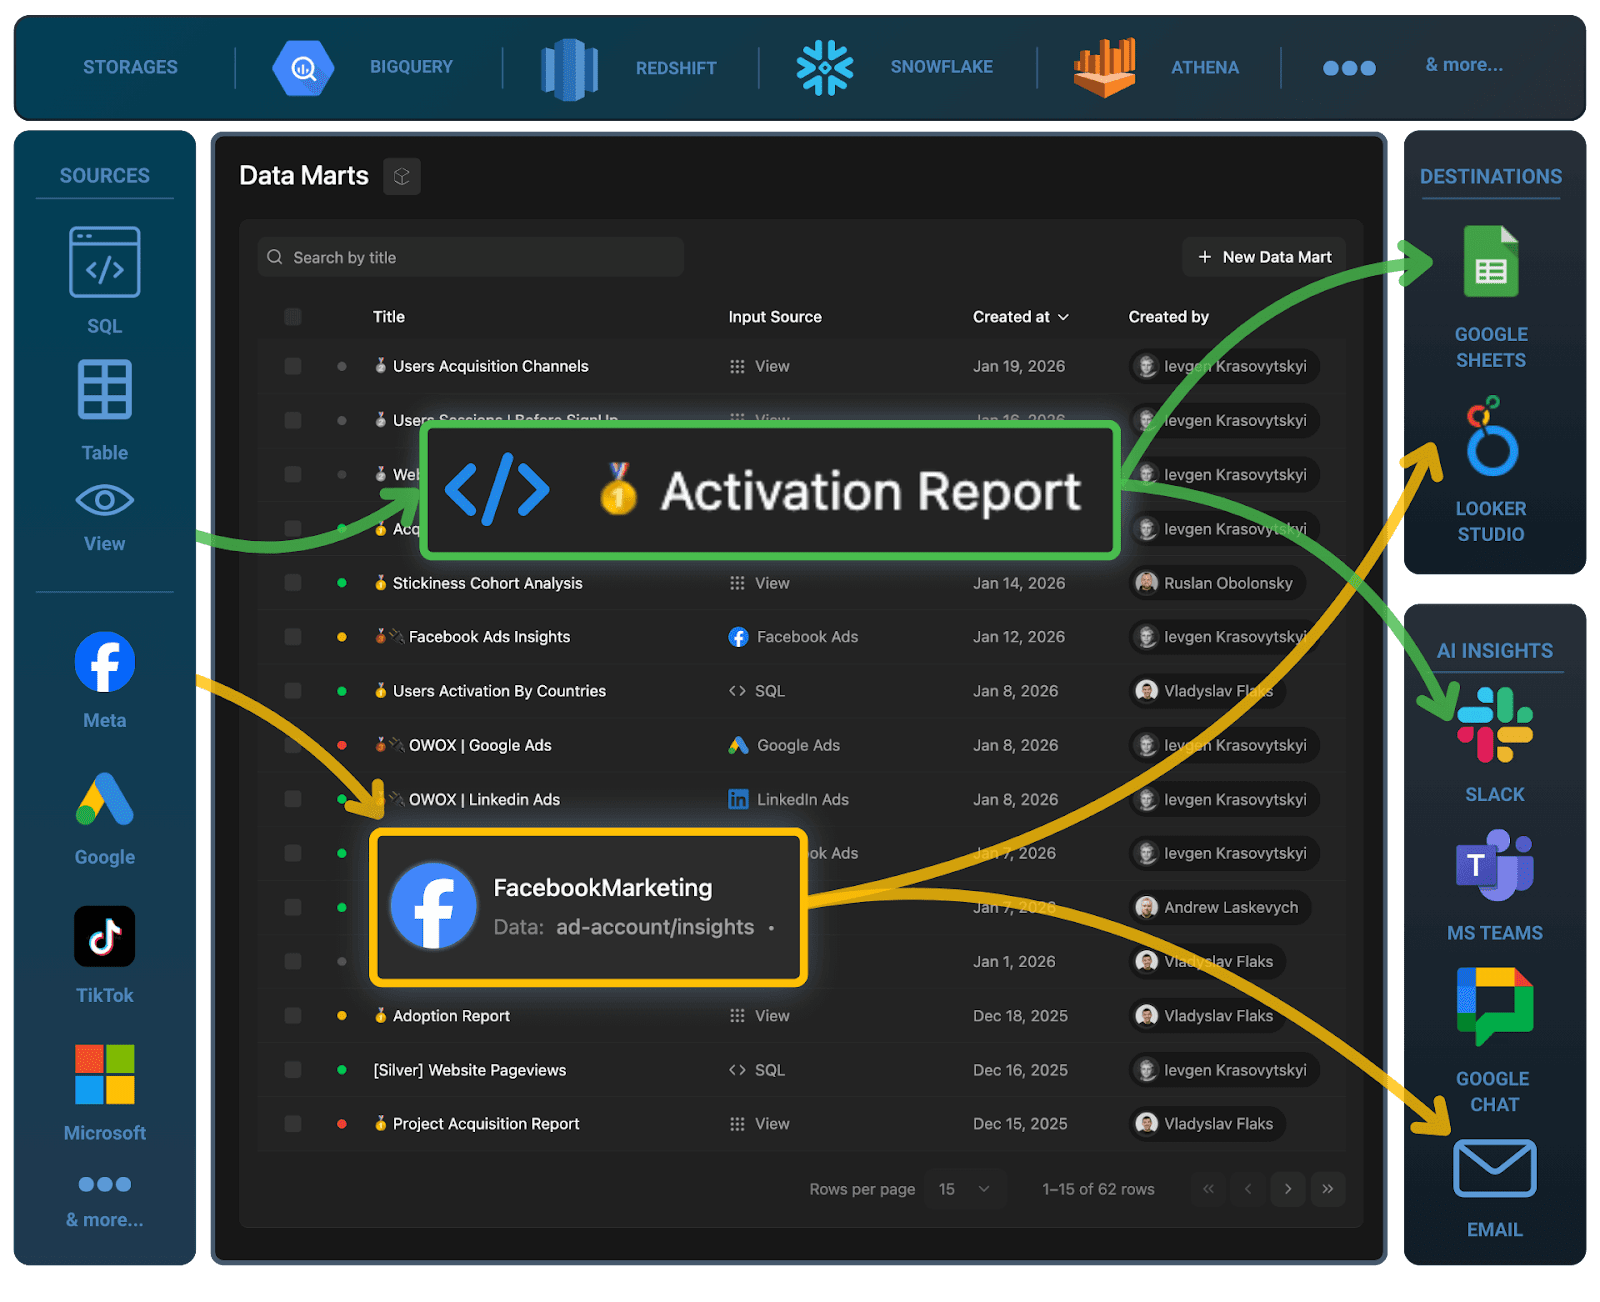
You can build and maintain this data mart layer manually with SQL and transformation tools, or use pre‑built, governed data marts to accelerate setup. For example, OWOX Data Marts provides ready‑to‑use marketing and product analytics data marts on top of your warehouse, so analysts can focus on insights rather than repetitive modeling work.
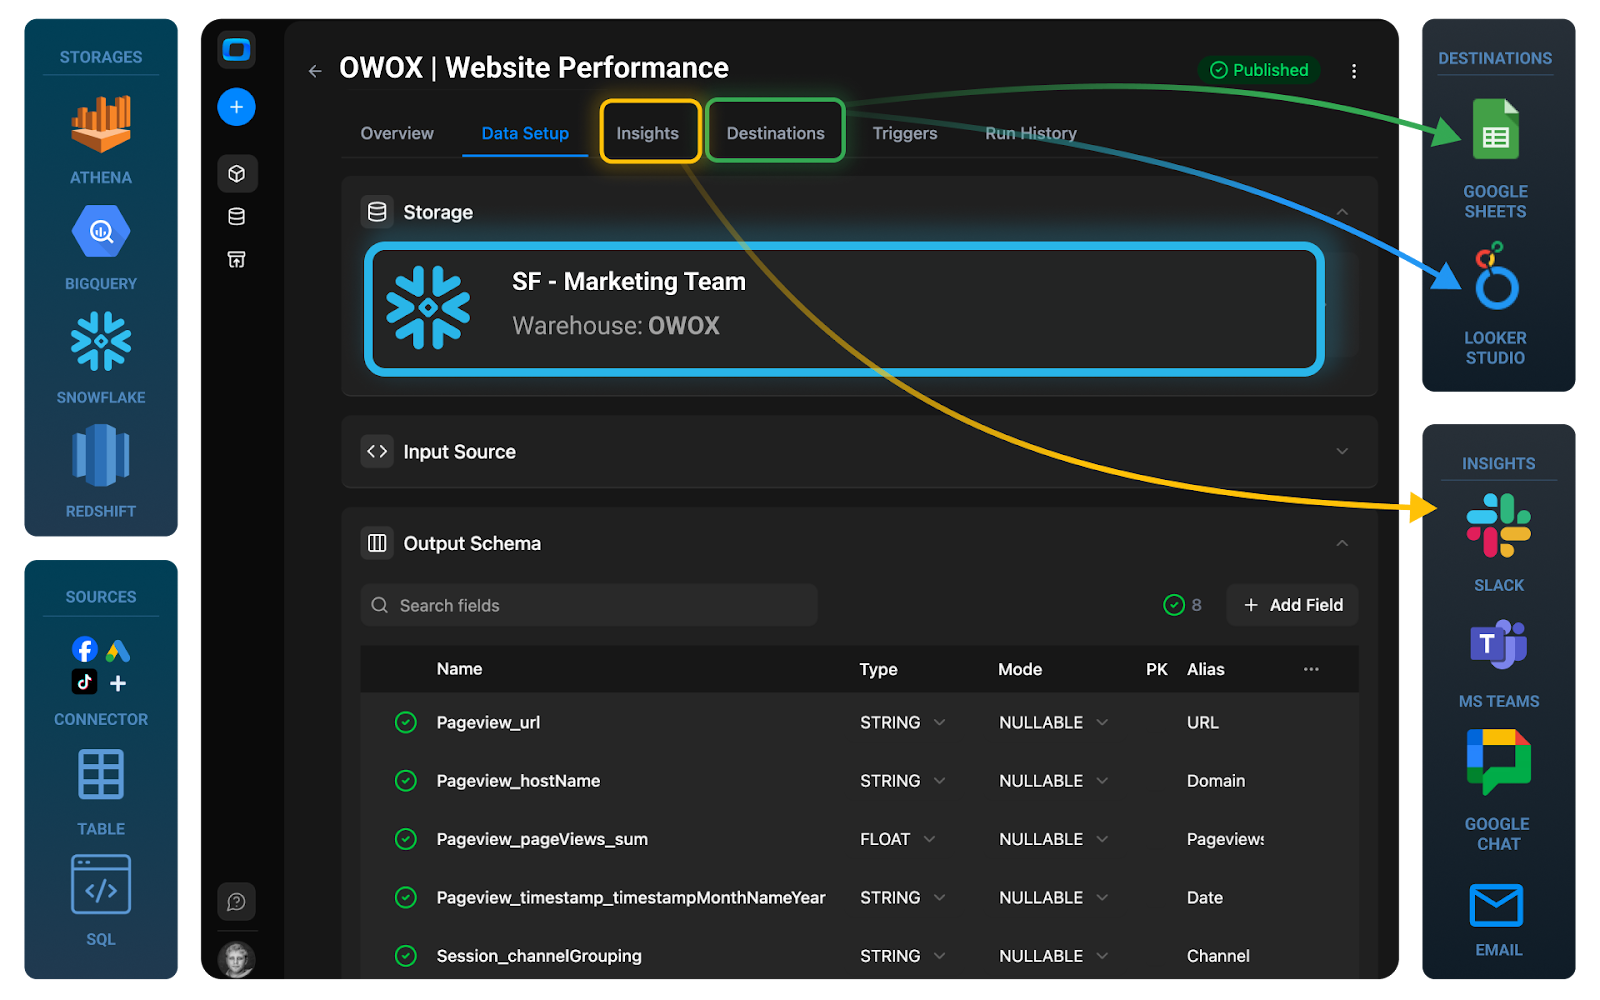
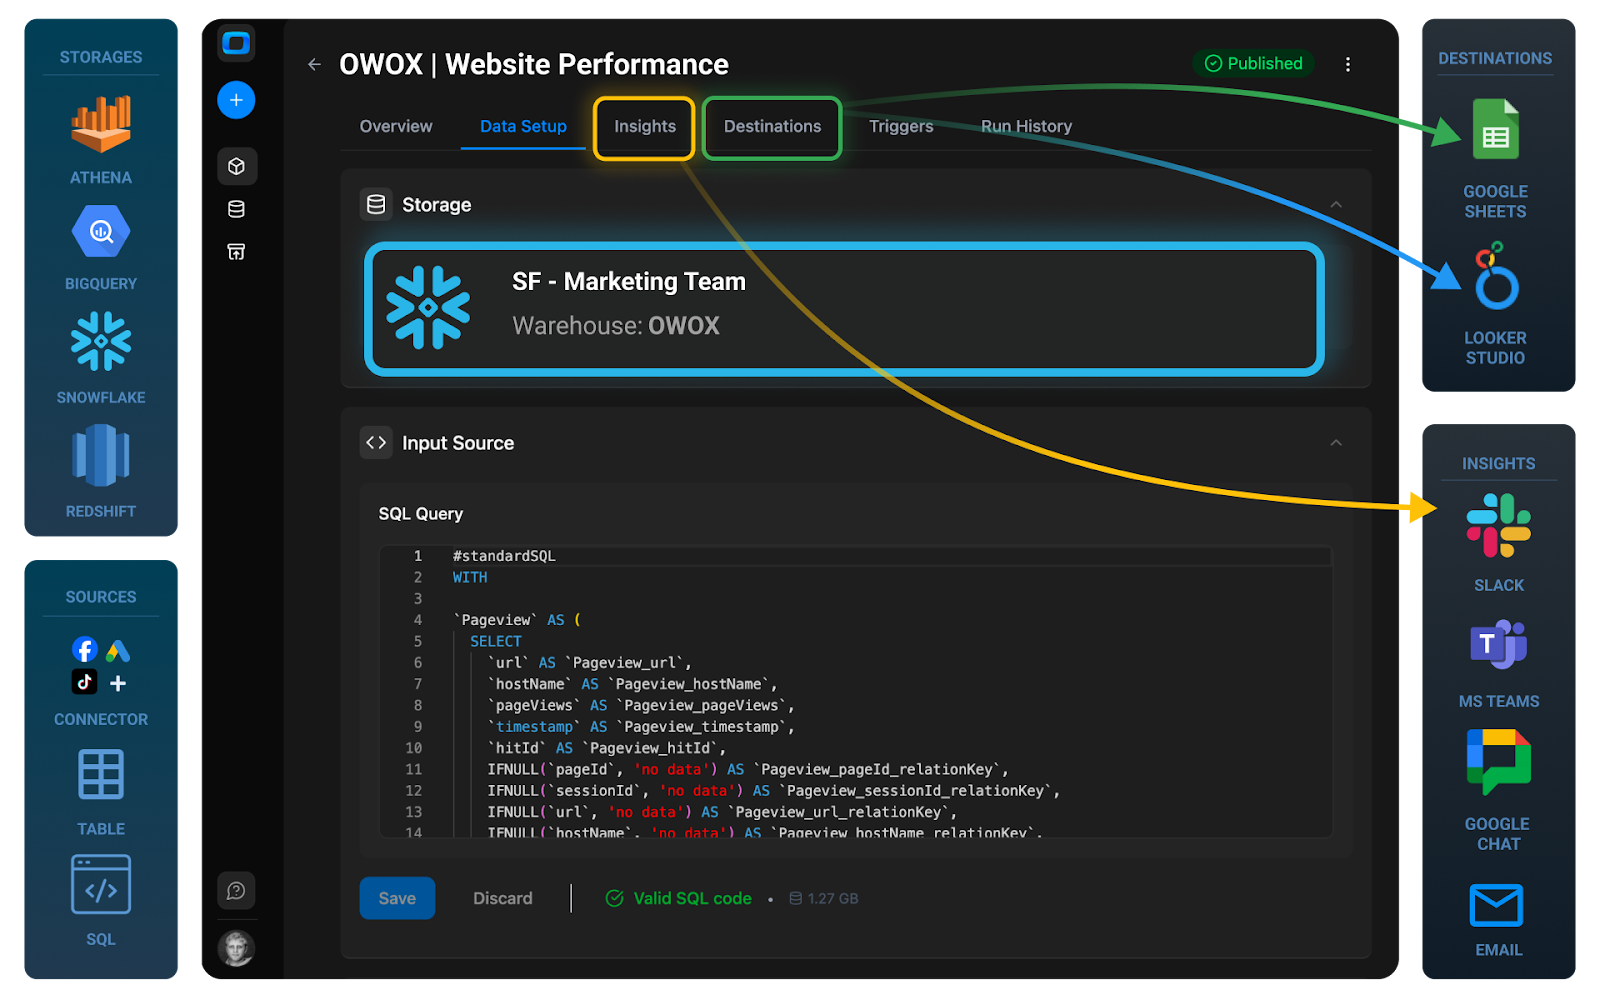
We follow this architecture: the warehouse as the infrastructure core, and the data mart layer as the interface between that core and your BI, AI, and business stakeholders.
This perspective helps you evaluate warehouse options based on how well they support the architecture you actually need, not just how impressive their feature lists look.
Comparing BigQuery, Snowflake, Databricks, & Others: Features, Pricing, and Ecosystem Fit
Once you know you need a warehouse, the next question is which one – and that’s where most teams get overwhelmed. BigQuery, Snowflake, Databricks, Amazon Athena (AWS), and Amazon Redshift (AWS) all promise scale, performance, and “analytics everywhere,” but they differ meaningfully in how they store data, charge for usage, and integrate with your existing stack.
Rather than declare a winner, we focus on practical trade‑offs for data and analytics teams:
- How the platforms work under the hood.
- How you’ll actually pay for them, and what drives cost.
- Where each shines or struggles for typical SaaS and e‑commerce workloads.
- How tightly each ties you to a specific cloud ecosystem.
Architectural Models: Columnar, MPP, Serverless, Lakehouse
All five platforms are built around columnar storage and massively parallel processing (MPP), but they differ in how they handle storage vs compute, and how tightly they couple with data lakes.
Key patterns to understand:
BigQuery (GCP)
- Serverless MPP warehouse: Storage and compute are abstracted away; you don’t manage clusters.
- Data is stored in Colossus (Google’s distributed storage) with columnar format under the hood.
- Strong support for external tables on GCS; can act as a query engine over lake‑style storage.
Snowflake (cloud-agnostic)
- Decoupled storage and compute: Central storage layer, multiple independent “virtual warehouses” for compute.
- Clustered, columnar storage with automatic micro‑partitioning.
- Increasingly lakehouse‑like via support for external tables and Iceberg.
Databricks (AWS/Azure/GCP)
- Lakehouse architecture built on the Delta Lake.
- Treats the data lake as the primary storage layer; SQL warehouse and notebooks run on top.
- Strong unification of BI, data engineering, and ML on a single platform.
Amazon Athena (AWS)
- Serverless query engine over S3 using open formats (Parquet, ORC, etc.).
- No persistent warehouse storage; relies on data lake files.
- Good for ad‑hoc querying and light BI, less for heavy transformations at scale.
Amazon Redshift (AWS)
- Cluster-based MPP warehouse: historically tightly coupled storage and compute, with newer RA3 nodes decoupling storage.
- Columnar, compressed storage managed within the cluster.
- Deep integration with S3 (AWS Redshift Spectrum) for querying lake data.
From an analyst’s point of view
- Serverless (BigQuery, AWS Athena) simplifies operations but requires more attention to query optimization for cost.
- Warehouse‑centric (Snowflake, Amazon AWS Redshift) models are more predictable for BI workloads.
- Lakehouse (Databricks) is compelling if you have strong data engineering/ML needs and are comfortable with a slightly more complex platform.
Pricing Models: Storage, Compute, Serverless, Reserved Instances
Pricing is often the deciding factor over multiple years. All platforms charge separately for storage and compute, but the details differ in ways that matter day to day.
BigQuery
- Storage: $/TB/month for data stored in BigQuery; cheaper for long‑term storage.
- Compute: Primarily on‑demand per TB scanned; optional flat‑rate or reservations for predictable workloads.
- Implication: Great for bursty workloads and early stages; requires query discipline (partitioning, clustering, avoiding SELECT *) as data grows.
Snowflake
- Storage: $/TB/month on cloud object storage (per cloud provider).
- Compute: Charged in credits, consumed by virtual warehouses sized by “t‑shirt” sizes (XS, S, M, …).
- You pay per active compute time, not per TB scanned.
- Implication: Easy isolation of teams/workloads; you can pause warehouses to save cost, but idle, misconfigured warehouses can burn money.
Databricks
- Storage: $/TB/month on your cloud storage (S3, ADLS, GCS).
- Compute: DBUs (Databricks Units) per cluster type, multiplied by cloud instance cost.
- Different SKUs for SQL warehouses vs all‑purpose clusters vs jobs.
- Implication: Very flexible and powerful, but more complex to estimate for non‑engineers; planning often involves both data and infra teams.
Amazon Athena (AWS)
- Storage: S3 object storage pricing for your data lake.
- Compute: Per TB scanned, similar conceptually to BigQuery on‑demand.
- Implication: Extremely low operational overhead and attractive for sporadic querying, but costs can spike with poorly partitioned data or frequent full‑table scans.
Amazon Redshift (AWS)
- Storage/Compute: Historically bundled in cluster/node pricing; with RA3, storage is partly decoupled.
- Options for on‑demand nodes or Reserved Instances (commitments for lower unit cost).
- Implication: You pay for 24/7 cluster uptime regardless of actual utilization; can be very cost‑effective for steady, predictable BI workloads at scale.
From a budgeting perspective
- On‑demand serverless (BigQuery, AWS Athena) fits early‑stage or spiky usage but demands query governance as data grows.
- Cluster/warehouse‑based (Snowflake, AWS Redshift, Databricks) fits teams ready to manage compute resources more actively for better cost/performance trade‑offs.
Strengths and Weaknesses from an Analyst’s Perspective
For analysts and BI teams, the question is: How does this feel to use day to day for our workloads? Below is a high‑level, workload‑focused view.
BigQuery
Strengths
- Very low operational overhead; serverless and easy to get started.
- Strong integration with Looker Studio and other GCP tools (Vertex AI, Dataform, etc.).
- Excellent for event‑heavy SaaS/product analytics and marketing data at scale.
Weaknesses
- Cost can surprise you with large scans or inefficient queries.
- Some enterprise features (fine‑grained RBAC, data governance tooling) may require additional GCP services.
Snowflake
Strengths
- Clean, SQL‑first UX that feels purpose‑built for analytics.
- Easy workload isolation via multiple virtual warehouses (e.g., separate BI vs. ELT compute).
- Cross‑cloud availability and growing ecosystem (Snowpark, Snowpipe).
Weaknesses
- Requires some operational discipline (sizing, pausing, and monitoring warehouses).
- Native integration with cloud vendor AI/ML tools is less tight than first‑party warehouses.
Databricks
Strengths
- Excellent for mixed workloads: BI, data engineering, and ML/Data Science in one environment.
- Delta Lake provides strong guarantees for lakehouse‑style architecture (ACID, time travel).
- Notebook‑centric workflows that many data scientists love.
Weaknesses
- More complex to operate and optimize than pure serverless warehouses.
- Can be overkill for teams primarily focused on classic BI and reporting without heavy ML needs.
Amazon Athena (AWS)
Strengths
- Extremely easy to set up; no infrastructure to manage.
- Great for ad‑hoc exploration and low‑frequency reporting on data already in S3.
- Leverages open formats and Glue Data Catalog, fitting well into open data lake architectures.
Weaknesses
- Not ideal for heavy transformation workloads or high‑concurrency BI.
- Performance tuning relies heavily on data layout in S3 (partitioning, file sizes, formats).
Amazon Redshift (AWS)
Strengths
- Mature, battle‑tested warehouse deeply integrated into AWS (Glue, S3, QuickSight, Step Functions).
- Good for stable, predictable BI workloads where a 24/7 cluster makes sense.
- Spectrum integration lets you query S3 data when needed.
Weaknesses
- More operational overhead: cluster sizing, vacuuming/maintenance.
- Historically less flexible than newer serverless or lakehouse approaches, though this is improving.
From a SaaS / e‑commerce analytics standpoint
- If your primary workloads are marketing, product, and revenue analytics with heavy SQL and BI, BigQuery, Snowflake, and AWS Redshift are usually the leading candidates.
- If you have a strong ML and data science roadmap or a significant existing data lake, Databricks can be compelling.
- If you’re already all‑in on S3 and mostly need affordable querying over existing logs and exports, Amazon AWS Athena is a low‑friction starting point.
Regardless of platform, analysts will see the most benefit once there’s a robust data mart layer on top and curated tables tailored to your core use cases. That’s where tools like OWOX Data Marts can help you standardize marketing and product analytics models across any supported warehouse.
Ecosystem Alignment: GCP, AWS, Multi-Cloud Considerations
Finally, your warehouse choice is rarely made in isolation. It’s constrained (or enabled) by your broader cloud strategy.
GCP-first organizations
- BigQuery is the natural fit: tight integration with GCS, Pub/Sub, Dataflow, Vertex AI, and Looker/Looker Studio.
- Snowflake and Databricks are still options if you need multi‑cloud flexibility or prefer their feature sets.
AWS-first organizations
- AWS Redshift is the traditional default; Amazon Athena (AWS) is attractive for lake‑oriented or cost‑sensitive use cases.
- Databricks on AWS works well when you already operate a significant S3 data lake.
- Snowflake on AWS is common among teams that want a warehouse‑centric UX but want to stay on AWS infrastructure.
Multi-cloud or cloud-agnostic strategies
- Snowflake and Databricks offer true multi‑cloud deployments, helpful if you operate in multiple regions/providers or want to avoid single‑vendor lock‑in.
- BigQuery is GCP‑only; AWS Redshift and AWS Athena are AWS‑only. Choosing these implicitly tightens your commitment to the respective cloud.
From an analytics team’s perspective, the main questions are:
- Where do our most critical data sources live (and which cloud are we already paying for)?
- Which downstream tools do we rely on (BI, ML, activation), and how do they integrate with each warehouse option?
- How important is multi‑cloud portability versus deep integration with one provider’s stack?
In practice, most teams gain more by aligning their warehouse with their primary cloud provider and investing in a solid modeling and data mart layer than by chasing perfect multi‑cloud optionality. The next sections will focus on how to evaluate vendors more systematically and how to design your data marts so analysts can get consistent, trustworthy insights regardless of which warehouse you choose.
How to Choose a Data Warehouse Based on Team Type and Use Cases?
Two companies can choose the same warehouse and have completely different experiences – one sees a clear boost in speed and confidence, the other fights cost overruns and half‑finished migrations.
The difference is rarely the technology alone. It’s how well the choice matches:
- The composition of the data team (analyst‑led vs engineering‑led vs ML‑heavy).
- The dominant use cases (marketing and product analytics vs ETL/ELT pipelines vs AI).
- The governance and cost controls that the organization is ready to enforce.
Instead of starting from “Which warehouse is best?”, start from “What kind of team are we, and what are we actually going to do with this warehouse in the next 12-24 months?”
Below, we’ll look at four archetypes and how they should think about warehouse selection.
Marketing Heavy Analytics Teams: Cross-Channel Performance and Attribution
For growth and marketing teams, the core questions are about channels, costs, and outcomes. You care less about advanced data engineering features and more about:
- How quickly can you answer “What’s working?”
- How expensive queries become as data and campaigns scale.
- How easily can you plug in new ad or CRM tools?
Priorities
- Effortless integrations with ad platforms, web/app analytics, CRM, and billing systems – ideally using managed connectors.
- Predictable cost per query for dashboards that stakeholders check daily.
- Good support for partitioning and clustering on dates and common dimensions (campaign, channel, region).
- Compatibility with your BI tool and marketing stack (reverse ETL, audience sync, etc.).
Implications for warehouse choice
- Serverless options like BigQuery (GCP) or query‑over‑lake engines like Amazon Athena (AWS) work well if your workloads are spiky and mainly dashboard‑driven.
- Warehouse‑centric options like Snowflake or Amazon AWS Redshift are strong if you have stable, high‑volume reporting and want tighter control over compute.
Recommendations
- Optimize for fast time‑to‑value and easy ingestion, not exotic features.
- Use a governed marketing data mart layer so that CAC, ROAS, LTV, and attribution logic live in one place, not in every dashboard. Ready‑made data marts, such as OWOX Data Marts, can significantly shorten this path for performance and attribution use cases.
- Put guardrails around query patterns (e.g., avoid SELECT * in BI, enforce filters by date and brand).
Data Engineering Driven Teams: Pipelines, Complex Transformations, SLAs
If your organization already has data engineers or is planning to build that capability, the warehouse must support rigorous pipelines and SLAs, not just BI dashboards.
Here, the focus shifts to orchestration, observability, and control over how compute is scheduled and scaled.
Priorities
- Strong ELT/ETL support with robust APIs, JDBC/ODBC drivers, and integration with tools like Airflow, Dagster, dbt, or cloud‑native orchestrators.
- Fine‑grained control over compute resources for different workloads (batch, near‑real‑time, heavy transformations).
- Features like query history, resource monitors, and workload management for debugging and cost control.
- Support for structured and semi‑structured data, plus schema evolution.
Implications for warehouse choice
- Snowflake and AWS Redshift appeal to engineering‑heavy teams because virtual warehouses or clusters can be tuned per job type.
- Databricks fits teams that view the lake (S3, ADLS, GCS) as the core asset and want to unify engineering and analytics on top of it.
- BigQuery can also fit well if you lean on its serverless nature and complement it with strong pipeline tooling.
Recommendations
- Choose a platform that integrates cleanly with your orchestration and CI/CD stack; this matters more long-term than small price differences.
- Establish clear SLAs for key pipelines (daily fact tables, near‑real‑time event streams) and check that your warehouse’s autoscaling and concurrency controls support them.
- Plan your data mart strategy early so engineers don’t become permanent gatekeepers for every new report.
AI Focused Organizations: Feature Stores, Notebooks, Lakehouse Patterns
If your roadmap is heavily oriented toward ML models, experimentation, and AI assistants, you’ll value a warehouse (or lakehouse) that plays nicely with data science workflows.
Here, flexibility for unstructured data, versioned datasets, and integration with AI platforms becomes critical.
Priorities
- Tight alignment with your chosen AI/ML stack (Vertex AI, SageMaker, Azure ML, or Databricks’ native ML tooling).
- Support for notebooks (Jupyter, Databricks, Colab) and languages beyond SQL (Python, R, Scala).
- Ability to maintain feature stores and training sets with reproducibility (time travel, versioning).
- Efficient access to large historical datasets, logs, events, and semi‑structured data.
Implications for warehouse choice
- Databricks is often the default for ML‑heavy teams: unified notebooks, Delta Lake, and lakehouse orientation.
- BigQuery integrates strongly with Vertex AI and supports SQL+Python workflows, making it attractive on GCP.
- Snowflake is evolving rapidly on this front (Snowpark, native ML integrations) and works well when you want a unified analytics + ML foundation with strong governance.
Recommendations
- Consider a lakehouse pattern (Databricks, BigQuery with external tables, Snowflake with Iceberg) if you expect large-scale unstructured or semi‑structured data.
- Design your data marts and feature stores together: Data marts serve BI and governance; feature stores feed models.
- Invest early in data versioning and lineage so you can answer “Which data created this model?” – a key governance requirement for production AI.
SQL-First Analytics Teams: Usability, Cost Predictability, and Governance
Many organizations are primarily SQL‑first: a few analysts, a BI tool, and a mandate to standardize metrics and democratize data. They don’t need heavy ML or complex lakes right away; they need a simple, affordable, and governed analytics environment.
Priorities
- A clean SQL experience with a strong query editor, documentation, and easy integration with BI tools.
- Cost predictability so stakeholders can use dashboards freely without fear of surprise bills.
- Straightforward RBAC (roles and permissions) and support for row/column‑level security.
- A clear path to implement and maintain data marts and a semantic layer.
Implications for warehouse choice
- Snowflake and BigQuery are strong fits: SQL‑centric, mature ecosystems, and powerful but approachable for small teams.
- AWS Redshift continues to work well for AWS‑centric teams with stable BI use and in‑house SQL experience.
- AWS Athena can be an entry point if you’re already S3‑heavy and want to start simple – though you may later move to Amazon AWS Redshift or Snowflake for heavier workloads.
Recommendations
- Optimize for usability and governance over theoretical maximum performance. A platform your analysts enjoy using will deliver more value than a faster system they fear touching.
- Standardize on a single semantic layer (dbt models + data marts, or governed views) and connect all BI tools to that layer – never to raw tables.
- Consider accelerating your data mart layer with solutions like OWOX Data Marts, especially if you’re focused on marketing and product analytics and want reliable metrics without building every model from scratch.
In short, let your team type and primary use cases drive the warehouse decision. The best platform is the one that your current and near‑term workflows can fully exploit – supported by a clear data mart strategy and governance model.
From Warehouse to Governed Data Marts: Preparing Your Next Analytics Layer
Choosing and implementing a data warehouse is a major milestone, but it’s not the finish line. It’s the foundation.
Without a deliberate data mart layer on top of your warehouse, you risk ending up with a centralized but still chaotic environment: dozens of raw tables, competing SQL snippets, and dashboards that disagree on core metrics.
The real value emerges when you design governed data marts that translate raw, heterogeneous data into business‑ready, reusable models for marketing, product, and finance teams.
Why Picking a Warehouse Does Not Solve the Reporting Problem Alone
A warehouse consolidates your data and provides powerful computing, and yet reporting chaos can easily persist, just in a more sophisticated environment.
- Multiple definitions of the same metric: Each analyst writes their own query for LTV, CAC, churn, or active users. Dashboards look similar but don’t match.
- Ad‑hoc joins everywhere: Every report joins raw tables slightly differently, with different filters and assumptions. Bugs and silent inconsistencies creep in.
- No stable interface for BI tools: Dashboards are built directly on raw tables or complex views. When schemas change, reports break or, worse, degrade silently.
- Slow onboarding and fragile knowledge: Understanding which tables are “safe” to use requires tribal knowledge.
Key logic lives in people’s heads or is buried in queries.
In other words, the warehouse solves where the data lives and how it’s processed, but not what it means. That semantic layer has to be designed explicitly, and that’s where data marts come in.
What a Centralized Data Mart Layer Provides: Trusted Metrics and Dimensions
A data mart layer is a curated collection of SQLs, tables, or views that encode your agreed‑upon business logic.
Instead of pointing BI tools at raw ingestion tables, you connect them to data marts such as marketing_performance, subscription_revenue, or customer_360.
The benefits are both technical and organizational:
Single source of truth for metrics
- Metrics like MRR, churn, LTV, and ROAS are defined once in data marts and reused everywhere.
- Changes to a definition are made centrally and automatically propagate to all dependent dashboards.
Business-friendly schemas
- Columns are named and structured around business concepts (customer, order, session, campaign), not raw events or API payloads.
- Analysts and power users can work effectively without constantly consulting the source tool documentation.
Reusability
- Data marts serve as building blocks: a customer_360 data mart can feed both marketing segmentation and product analytics, avoiding duplicate logic.
- Complex joins and filters are encapsulated, reducing the chance of subtle mistakes.
Governance and observability
- It becomes feasible to add documentation and lineage at the data mart level.
- You can audit who changed what, when, and how that affected downstream reports.
In practice, data marts are the contract between data and the business: analysts maintain the contract, and stakeholders consume it via BI, AI tools, and operational systems.
How Governed Data Marts Enable Self-Service Analytics and AI Insights
Once you have well‑designed data marts, the experience for business users and advanced analytics teams changes dramatically.
For business users and BI consumers
Safer self‑service analytics
Stakeholders can explore data in BI tools using a small set of trusted tables instead of navigating a jungle of raw schemas. They’re less likely to create “shadow metrics” by pulling from the wrong sources.
Faster iteration
New dashboards and views can be built by combining existing data marts rather than inventing new SQL from scratch each time. Metric drift across reports is reduced, improving trust.
Clear ownership
Each data mart has an accountable owner (or team). When something looks wrong, there is a clear path for raising and resolving issues.
Easier AI assistance
- AI agents or copilots that generate SQL perform far better when pointed at a small, well‑documented set of data marts with relationships than at hundreds of raw tables.
- Natural‑language querying becomes more realistic because the underlying schema reflects how the business thinks.
This is where governed solutions like OWOX Data Marts are particularly helpful: they provide ready‑made, opinionated data marts for marketing and product analytics, so you start from a solid, AI‑friendly structure instead of modeling everything from scratch.
With this approach, your warehouse investment becomes more than centralized storage – it becomes the engine behind a consistent, self‑service, and AI‑ready analytics environment that can grow with your company.
Frequently asked questions
.png)
.png)


Finally, a tool that doesn't ask business users to learn a new dashboarding UI. Our marketing team already knows Sheets. OWOX just delivers the right data.
Joinable data marts concept was the thing that sold us. We can now use the semantic layer without building one.
Self-hosted the OSS version on Digital Ocean. Zero vendor lock-in. Contributed a Shopify connector back in week two.