The FP&A data model: the tables and keys behind actuals, budget and forecast
Finance asked for actuals against budget and forecast, by department, every month. This guide gives the analyst the model behind it: the tables and their keys, why actuals, budget and every forecast belong in one fact table, how to map the chart of accounts once, how periods, versions and currency go wrong, the checks that prove the numbers tie to the ledger, and a note to forward to the finance lead with the decisions that are theirs.
Finance has asked you for a report: actuals against budget and the latest forecast, by department, every month, ideally in the spreadsheet they already use. The model behind it is smaller than it sounds. One fact table at the grain finance plans at, holding actuals, the budget and every forecast as rows told apart by a version column. Around it, a few reference tables: accounts and their mapping to report lines, cost centres, entities, fiscal periods, versions and exchange rates. Then a handful of rules, written down once.
The tables are the easy part. The rules are where the numbers diverge, and most of them are not yours to decide. The ledger follows accounting standards. How the ledger is compared with the plan follows none: which accounts make up “marketing”, what “budget to date” means on the 12th of the month, which forecast is the current one, which exchange rate turns euros into dollars. If nobody writes those choices down, you become their author, and every challenge to the number is a challenge to you.
If you are the finance lead who asked, the last section is written for you: the decisions only you can make, in one list. The rest is for the analyst who has to build it.
What finance means by actuals, budget and forecast
What finance means by actuals, budget and forecast
Finance uses these words precisely, and the model has to as well.
- Actuals are amounts posted to the general ledger. Each journal entry has two or more lines whose debits equal their credits. A month’s actuals are final only once finance has closed it.
- Budget is the plan approved before the year, usually by month. It does not change; a re-plan is a new version.
- Forecast is a later estimate of the same year: actuals for the closed months plus a new estimate for the rest, “6+6” after June, “9+3” after September. There are several a year, and one is current.
- Variance is actual minus budget or forecast. Revenue above budget is favourable, costs above budget unfavourable; finance will want that sign stated, not guessed.
The revenue here is revenue as posted in the ledger: recognised revenue, not bookings, order value or pipeline. ARR and deferred revenue are outside this model.
The model on one page
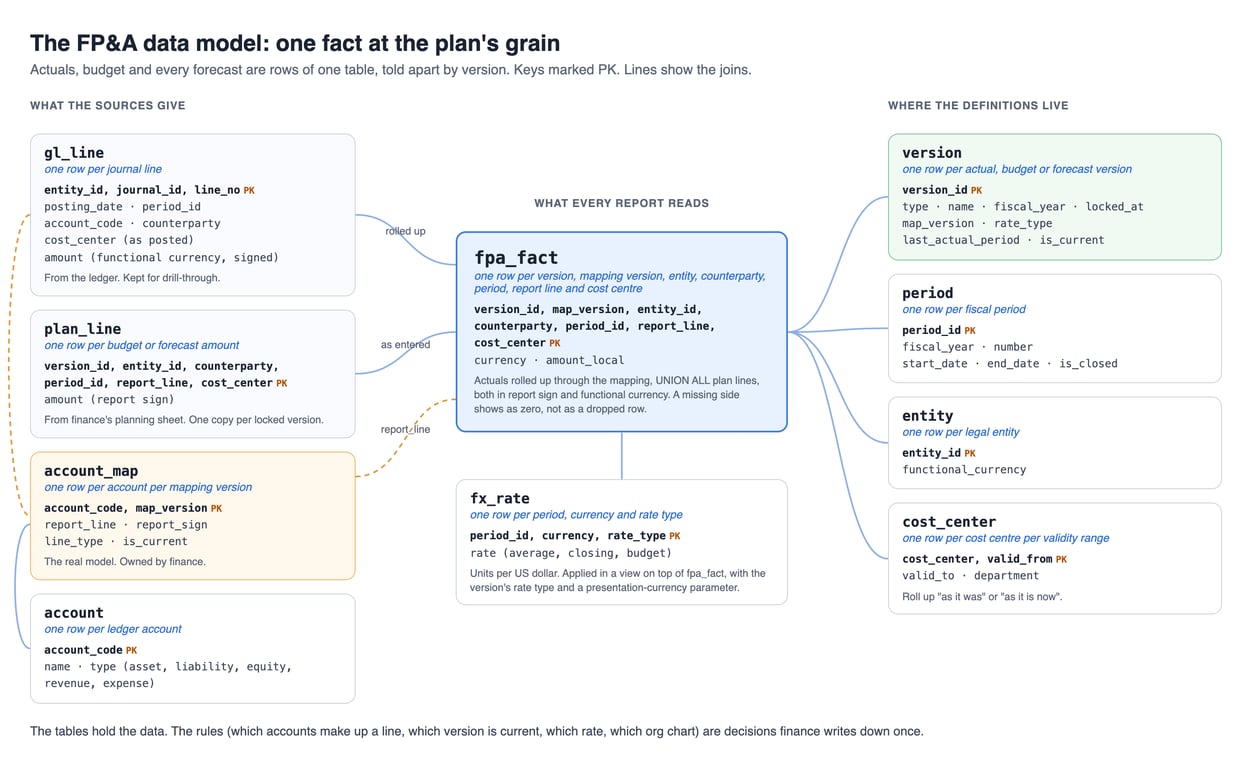
Ten tables, each with one grain. Start every table’s description with its grain, “one row per journal line”, and make the grain its primary key:
| Table | One row per | Primary key |
|---|---|---|
gl_line |
journal line, as the ledger posted it | entity, journal, line number |
plan_line |
budget or forecast amount, as finance entered it | version, entity, counterparty, period, report line, cost centre |
fpa_fact |
functional-currency amount at the plan’s grain | version, mapping version, entity, counterparty, period, report line, cost centre |
account |
ledger account | account code |
account_map |
account, per mapping version | account code, mapping version |
cost_center |
cost centre, per validity range | cost centre code, valid from |
entity |
legal entity | entity |
period |
fiscal period | period |
version |
actual, budget or forecast version | version |
fx_rate |
currency, period and rate type | period, currency, rate type |
gl_line and plan_line are what the sources give you, fpa_fact is what every report reads, and the reference tables hold the definitions.
OWOX Data Marts
See your first report built in real time. 15 minutes.
- Connect your data warehouse
- Pick your metrics
- Get a live Google Sheets report
In the time it takes to write a ticket. Then imagine never writing that ticket again.
Book a DemoWe'll use your actual use case
Pick the grain finance plans at, not the grain of the ledger
Pick the grain finance plans at, not the grain of the ledger
The ledger records every journal line on a day, against an account. Finance does not plan that way. A budget is typically entered by month, by cost centre, and by a report line such as “Software” or “Travel”, a level above the hundreds of accounts in the ledger.
So the shared grain is the plan’s: version × entity × period × report line × cost centre. Actuals are rolled up to that grain to sit next to the plan. gl_line stays at its own grain, so any figure can be traced to its journal lines through a second report on gl_line, filtered to the same entity, period, report line and cost centre. That detail report is the drill-through a spreadsheet cannot do on its own, and it is what makes finance trust a number they did not compute.
Two consequences:
- If the plan has more than one grain, build more than one fact. Revenue is often planned by product, costs by cost centre; one table would invent a cost centre for revenue or a product for rent.
- Put actuals and plan in one table, not side by side in a join. A join of actuals to budget drops rows: a cost centre with a budget and no spend, or spend nobody budgeted. Stacked in one table with a version column, both survive, and a pivot shows the missing side as zero. That is a fact table with a version dimension, and it is the single most useful decision in the model.
The query that builds fpa_fact is two halves. Both come out in report sign, the way finance reads a P&L (revenue and costs both positive): actuals get it from the mapping, and plan lines must arrive in it. g.amount is the ledger’s amount in the entity’s functional currency, not the invoice’s currency; revaluation gains and losses are already in the ledger on their own accounts. Actuals are built once per mapping version, so each budget can be compared on its own mapping:
-- actuals, once per mapping version
SELECT 'ACT' AS version_id,
  m.map_version,
  g.entity_id, g.counterparty,
  g.period_id, m.report_line,
  g.cost_center,
  e.functional_currency AS currency,
  SUM(g.amount * m.report_sign)
    AS amount_local
FROM gl_line g
JOIN entity e USING (entity_id)
JOIN account_map m
  ON m.account_code = g.account_code
GROUP BY 1, 2, 3, 4, 5, 6, 7, 8

UNION ALL

-- budget and forecast lines,
-- on their version's mapping
SELECT p.version_id, v.map_version,
  p.entity_id, p.counterparty,
  p.period_id, p.report_line,
  p.cost_center,
  e.functional_currency AS currency,
  p.amount AS amount_local
FROM plan_line p
JOIN version v USING (version_id)
JOIN entity e USING (entity_id)
counterparty is empty except on intercompany lines. Translation happens one step later, in a view, so the build never sums two currencies.
Map the chart of accounts once, in a table
Map the chart of accounts once, in a table
Between the ledger’s accounts and finance’s report lines sits a mapping: which accounts make up “Software”, which make up “Cost of revenue”. In most companies it lives in one person’s spreadsheet, or in a CASE WHEN inside one query. That mapping is the real model. Everything else is plumbing.
Keep it as a table, account_map, with one row per account per mapping version, and give it an owner in finance. Three rules make it hold:
- Every account maps to exactly one report line in a mapping version. An account in two lines is counted twice; an account in none disappears. The primary key on account code plus mapping version enforces the first. For the second, check that every account in
gl_linehas a row in the mapping. - The sign is decided once, in the mapping. In a signed ledger, debits are usually positive and credits negative, so revenue, which carries a credit balance, comes out negative. A
report_signcolumn on the mapping turns it the way finance reads it. With revenue and costs both positive, a sum is not a profit, so each report line also carries aline_type: subtotals and profit are revenue lines minus cost lines. - A change to the mapping is a new mapping version. When finance moves an account from one report line to another, last year’s report should not change silently. Keep the old version, flag one
is_current, and say on each report which it uses. The budget was entered by report line, so a remap moves actuals and not the budget, and the difference looks like a variance. Compare a budget on the mapping it was made on (map_versionon its version row), and restate both only when finance re-maps the budget too.
Then prove it ties, account by account: for each entity, closed period and account, gl_line equals the ERP’s trial balance, and revenue lines minus cost lines equal the ERP’s profit or loss. A net-profit match alone can hide two errors that cancel out. Show the check on the report itself, not in a notebook nobody opens.
Periods: fiscal calendars, closes and the 12th of the month
Periods: fiscal calendars, closes and the 12th of the month
A period table, not calendar months: fiscal years often start outside January, and 4-4-5 calendars split a quarter into four-, four- and five-week periods. One row per period, with fiscal year, number, start and end dates and a closed flag.
Key actuals on the accounting period the ledger assigns, not on the posting date. An accrual dated 2 April can belong to March, and many ledgers allow adjustment periods after year end. Deriving the period from a date gets those wrong, and finance will find them at the first tie-out.
In a date-based ledger with no separate period, such as Xero, where a lock date can be moved at any time (Xero Central), derive the period from the date, treat the lock date as the close, and give lines with no department tag a visible “unassigned” cost centre.
Then the open month: on the 12th, spend at 30% of the monthly budget means nothing on its own. Three honest ways to show it, and the choice is finance’s:
- Closed months only. The simplest, and blind until the month closes.
- Month to date against a phased budget, spread over the days by a stated curve, straight-line or weighted by last year.
- Month to date with the open month labelled as such, and no variance until close.
Whichever is chosen goes into the model once, not into each analyst’s own sheet.
Versions: budget, forecasts and which one is current
Versions: budget, forecasts and which one is current
The version table does most of the governing. One row per version: an id, the type (actual, budget, forecast), a name finance recognises (“FY27 budget”, “FY27 forecast 6+6”), its fiscal year, mapping version and rate type, the date it was locked, and for a forecast the last actual period, the month up to which it uses actuals.
Three rules:
-
A locked version never changes. A re-forecast is a new row, not an update. The budget the board approved has to give the same total next year as on the day it was approved.
-
A forecast’s closed months are actuals, copied when it is locked. Finance enters months 7 to 12 of a 6+6 forecast; on lock day, months 1 to 6 of the same fiscal year are copied from actuals into
plan_lineunder the forecast’s id, so the locked version cannot move later:-- once, when FC27_6 is locked INSERT INTO plan_line SELECT v.version_id, f.entity_id, f.counterparty, f.period_id, f.report_line, f.cost_center, f.amount_local FROM fpa_fact f JOIN version v ON v.version_id = 'FC27_6' AND f.map_version = v.map_version JOIN period p USING (period_id) WHERE f.version_id = 'ACT' AND p.fiscal_year = v.fiscal_year AND f.period_id <= v.last_actual_periodIf a closed month is reopened later, actuals change and the forecast does not; the variance between them is the restatement.
-
“Current forecast” is a flag set by finance, on one row of the version table. Reports read the flag, not a hard-coded name, so switching to the new forecast is one change in one place.
Load each locked budget from a copy nobody edits, one tab or file per version, or the next edit to the planning sheet changes a budget you have already reported against. A budget kept in Excel can be saved as a Google Sheet for the source below, or as a CSV for your warehouse’s own import.
Currency: store local amounts, translate with a named rate
Currency: store local amounts, translate with a named rate
Each entity keeps its books in its own (functional) currency, and so does fpa_fact. A view on top translates into the presentation currency @rep, a parameter, with the rate type taken from the version: actuals at the monthly average, the budget at the fixed budget rate.
SELECT f.*, v.rate_type,
  f.amount_local * rr.rate / r.rate
    AS amount_rep
FROM fpa_fact f
JOIN version v USING (version_id)
LEFT JOIN fx_rate r
  ON r.currency = f.currency
 AND r.period_id = f.period_id
 AND r.rate_type = v.rate_type
LEFT JOIN fx_rate rr
  ON rr.currency = @rep
 AND rr.period_id = f.period_id
 AND rr.rate_type = v.rate_type
Rates are stored as units of currency per US dollar, with a row of 1 for the dollar, so the cross rate to any presentation currency is its rate divided by the local one: €1,000,000 at September’s average is $1,150,883, or £858,235 with @rep = 'GBP'. Run the view with rate_type = 'budget' for every version to get the constant-currency column. The joins are left joins on purpose: a missing rate shows as an empty amount, and a check counts them.
One real case, from the demo project’s daily Open Exchange Rates table, owox-demo.open_exchange_rates_owox.open_exchange_rates_historical (base USD; the average is AVG(rate) over 1 to 30 September). €1,000,000 of costs a euro entity booked in September 2026, translated three ways:
| Rate used | EUR per USD | €1,000,000 in USD |
|---|---|---|
| September 2026 average (30 daily rates) | 0.8688977 | $1,150,883 |
| 30 September 2026 closing rate | 0.882854 | $1,132,690 |
| 1 February 2026, standing in for a budget rate | 0.844154 | $1,184,618 |
If the budget was translated at the February rate and the actuals at September’s average, the same euro spend shows $33,735 under budget in dollars without one euro of difference in spending. A report that does not separate that currency effect will praise a department for money it did not save. Translating the budget at the actual averages hides the effect altogether. The closing rate is in the table for contrast only: it is a balance-sheet rate, not one for a P&L.
Three choices for finance:
- Which rate translates actuals. For published statements, IAS 21 translates income and expenses at the rates on the transaction dates and assets and liabilities at the closing rate (IAS Plus summary of IAS 21); a monthly average is the common stand-in for the first. A management P&L is not bound by it, so finance chooses and states the choice.
- Which rate translates the budget. Usually a rate fixed when the budget was set.
- What “constant currency” means. Against the budget, usually actuals re-translated at the budget rate, so the variance shows spending alone; year on year, this year’s actuals at last year’s rates. Keep both views: the variance at actual rates and the variance at the budget rate, side by side, and the difference between them is the currency effect.
Keep fx_rate append-only, or store the rate next to each translated figure, so last year’s numbers survive a reload of the rates.
More than one entity: intercompany first
More than one entity: intercompany first
If the group has more than one legal entity, entities bill each other: recharges, management fees, intercompany loans. Summed as they are, the group’s revenue and costs both include those amounts. A consolidated budget vs actual needs them eliminated first, on both sides, actuals and plan. Keep the counterparty on each intercompany line (it is in the fact’s grain) and post eliminations to their own entity, ELIM, so each entity’s own P&L still shows them and the group total does not. Eliminate after translation, in the presentation currency: the two sides were translated from different currencies, so a small difference remains, and it belongs on its own named line rather than hidden. Where the ERP already runs a consolidation with eliminations, use its output for the group view rather than rebuilding it.
Cost centres after a reorg
The design team moves from Marketing to Product in April; in May someone runs the Q1 marketing variance. Q1 design spend under Marketing, where it was booked and budgeted, or under Product, where it sits now? Both are defensible, and they give different numbers. The model keeps both possible:
-
Keep the cost centre on
gl_lineas it was posted. It is a fact about the transaction, not about today’s org chart. -
Give
cost_centervalidity dates, one row per cost centre per range, with its parent department in each range. A report can then roll up “as it was” at each period’s end, or “as it is now”:SELECT f.*, was.department AS dept_as_was, COALESCE(cur.department, 'Retired') AS dept_as_is FROM fpa_fact f JOIN period p USING (period_id) LEFT JOIN cost_center was ON was.cost_center = f.cost_center AND p.end_date >= was.valid_from AND p.end_date < was.valid_to LEFT JOIN cost_center cur ON cur.cost_center = f.cost_center AND cur.valid_to = DATE '9999-12-31'Today’s row is the open one, ending 31 December 9999; a retired cost centre shows as “Retired” instead of vanishing. Check that no two ranges of one cost centre overlap. A cost centre that splits or merges needs an old-to-new mapping table on top; validity dates alone cannot share one cost centre’s spend between two.
-
Compare a budget on the structure it was made on, unless finance restates the budget too. A budget set on January’s org chart and actuals on April’s will show a variance that is only the reorg.
The report says which view it uses, at the top.
One definition per number, and the checks that prove it
One definition per number, and the checks that prove it
These numbers look standard and are not. Write each answer down once, next to the column that carries it, with the name of its owner in finance:
| Number | The choice inside it |
|---|---|
| Variance | Actual minus budget or budget minus actual, and the favourable sign per line type |
| Actuals to date | Closed periods only, or the open month too |
| Current forecast | Which version the flag points at, and who moves it |
| Gross margin | Which report lines sit in cost of revenue, and whether allocated overhead does |
| Constant currency | Which rate re-translates the actuals |
None has a universally right answer. What matters is that one answer is in the model: one variance column, not three spreadsheets with three formulas. Then the checks, run on every load and shown with the report:
- Tie-out to the ledger, account by account, as in the mapping section. Finance will ask about this one first.
- Mapping completeness. Every account in
gl_lineexists in the currentaccount_map. - Unique keys on every table, so no line is counted twice.
- Every plan line has a version that exists, and every locked version still has its locked total.
- Every row has a rate and a cost-centre department: no empty translated amount.
If a check fails, the report says so.
Where OWOX Data Marts fits, and what it does not do
Where OWOX Data Marts fits, and what it does not do
Everything above is warehouse SQL: any BI tool, Power BI included, can read the views. Here is where OWOX Data Marts takes part of the work.
- Getting the data in: the built-in , read on 10 October 2026, include Google Sheets (for the plan; it “performs a full refresh so the materialized table reflects the current sheet contents”, hence one tab per locked version) and Open Exchange Rates, but no ERP: the ledger comes from your own export or a custom connector.
- Owning the definitions: each table becomes a Data Mart with a description, an output schema, a Data Owner and a Business Owner (core concepts), and the relationships between them make up the model. Data Quality Checks cover two of the checks above: primary key uniqueness, and relationship integrity (an account with no mapping, a plan line with no version). The tie-out to the ERP is your SQL.
- Delivery: a report to Sheets runs on a schedule; the Excel add-in refreshes from the ribbon, with no scheduled refresh; Data Studio reads the same Data Mart.
What it does not do:
- There is no FP&A model to import. OWOX publishes ready-made data models for several kinds of business, and the one named Finance models a consumer-lending business: loans, repayments, collections. It is not an FP&A model. The diagram above is the starting point, built against your own chart of accounts.
- It does not write the mapping or transform the ledger. The SQL that rolls
gl_lineup to the plan’s grain is yours. - It is not a planning tool. Finance still enters the budget where it enters it today. It does not close the books or post journals.
For the finance lead who asked
For the finance lead who asked
A note from the analyst to the finance lead, ready to forward:
- I can build the actuals vs budget vs forecast report by department, monthly, in our spreadsheet, from one model in our warehouse. For any figure I can show the journal lines behind it, in a detail tab filtered to that line.
- The ledger follows accounting rules. The comparison with the plan follows ours, and I need you to set them; until then, two people can build the same report, get different numbers and both defend theirs.
- Your decisions, each with one named owner:
- Definitions (FP&A): the report lines and which accounts sit in each, with dated changes; the variance sign per line; how the budget is phased into months; what we show for the open month (closed months only, month to date against a phased budget, or labelled as open with no variance); whether overheads are allocated, and on what basis; after a reorg, old structure or new.
- Versions (FP&A): which version is “the budget” and when it is locked; which forecast is current, and who switches it.
- Presentation (CFO): the presentation currency; the rates for actuals and budget; what “constant currency” means against budget and year on year.
- Group and control (financial controller): which accounts are intercompany, and who confirms both sides match; who sets a month to closed, and on which working day; whether a reopened month restates reports already sent; who signs off the tie-out each month.
- What you get from me: the report, the definitions next to the numbers, and a check on every page that actuals tie to the ledger for each entity and closed month. If a check fails, the report will say so.
- Until you decide, I will show closed months only, actuals at the monthly average rate and the budget at its fixed budget rate (translating the budget at actual rates would hide the currency effect), on the cost-centre structure the budget was built on, with intercompany shown per entity and no group total, and say so at the top of the report.
Turn your data into decisions.
Governed data marts give you the clean foundation ML needs to actually work.
- No AI hallucinations
- Analyst-governed definitions
- Every number traces to SQL
Frequently Asked Questions
Should the model live in the warehouse or in a planning tool?
Finance enters the budget wherever it plans today, often a spreadsheet or a planning tool. The model that compares the plan with actuals sits better in the warehouse, next to the ledger data, so every report and spreadsheet reads the same mapping, versions and rates. The planning tool then becomes one source of the model rather than the only place its logic exists.
What outputs should an FP&A data model produce?
A monthly P&L by report line and cost centre for actuals, the budget and the current forecast; the variance against each, with a stated favourable or unfavourable sign; the same variance at constant currency, so spending and exchange-rate effects are shown apart; and drill-through from any line to the journal lines behind it. With them, the checks: actuals tie to the ledger for each entity and closed period, and every account is mapped once.
How do slowly changing dimensions work in FP&A planning models?
Cost centres move between departments after a reorganisation. Keep the cost centre on each journal line as it was posted, and give the cost-centre table validity dates, one row per cost centre per date range with its parent department. A report can then roll up last quarter as the structure stood then, or restated on today's structure, and say which. Overwriting the parent department instead changes past figures with no record that anything changed.
How do you handle budget versus actual when budgets are monthly and actuals are daily?
Pick one rule and put it in the model: compare closed months only; compare month to date against a budget phased over the days by a stated curve, straight-line or weighted by last year; or show the open month without a variance until it closes. The choice belongs to finance. What goes wrong is each analyst prorating in their own spreadsheet, which is how two departments on the same budget disagree about whether they are on plan.
What is the difference between an FP&A data model and a financial model in Excel?
An Excel financial model is usually built for one purpose, such as a three-statement or valuation model, and its logic lives in its formulas. An FP&A data model is a set of tables that many reports read: actuals, budget and forecasts at one grain, with the account mapping, periods, versions and exchange rates kept as data. The spreadsheet can still be where finance reads the result; the definitions just stop living in one person's file.
What is an FP&A data model?
The tables and keys behind budget vs actual reporting. At its centre is one fact table at the grain finance plans at (version, entity, period, report line and cost centre) that holds actuals, the budget and every forecast as rows told apart by a version column. Around it sit reference tables for the mapping of ledger accounts to report lines, cost centres, legal entities, fiscal periods, versions and exchange rates. The journal lines stay in the model too, so any figure can be traced back to the ledger.