Best Free ERD Tools in 2026

An entity-relationship diagram (ERD) is still the fastest way to make a database or warehouse schema legible – tables, columns, and the join paths between them, in one picture. The good news in 2026: you don’t need a paid seat to draw one. The better news: the best free tools now do more than draw. They export a portable, machine-readable model you can keep in git and hand to an AI assistant.
This is an honest roundup. Each tool below is genuinely good at something; the right pick depends on whether you think in code or in pictures, whether you’re solo or on a team, and – increasingly – whether you want your diagram to double as context an LLM can read. New to the fundamentals? Start with our guide to data modeling.
The free ERD tools, at a glance
The free ERD tools, at a glance
| Tool | Approach | Free tier | Export / portability | AI features |
|---|---|---|---|---|
| dbdiagram.io | Code (DBML) | Generous free | SQL, PNG/PDF, DBML | – |
| DrawSQL | Visual, collaborative | Free (limited diagrams) | SQL, image | – |
| QuickDBD | Code-ish (quick text) | Free (limited) | SQL, image | – |
| Lucidchart | General diagramming | Free (3 docs) | Image, some SQL import | AI diagram assist |
| Mermaid | Code (Markdown) | Free, open-source | Renders in git/Markdown | – |
| draw.io (diagrams.net) | Visual, generic | Free, open-source | XML, image | – |
| OWOX Model Canvas | Visual + AI, data-native | Free, no sign-up | OKF (portable markdown), image | AI drafting; AI-readable output |
dbdiagram.io – best if you think in code
dbdiagram.io – best if you think in code
dbdiagram.io turns DBML, a compact text syntax, into a clean diagram. If you like defining tables as code and getting a picture for free, it’s excellent – fast, keyboard-driven, and it round-trips to SQL.
The trade-off is that it’s diagram-first: the output is a picture or DDL, not a portable semantic model.
See how it stacks up in our OWOX Model Canvas vs dbdiagram.io comparison.
OWOX Data Marts
See your first report built in real time. 15 minutes.
- Connect your data warehouse
- Pick your metrics
- Get a live Google Sheets report
In the time it takes to write a ticket. Then imagine never writing that ticket again.
Book a DemoWe'll use your actual use case
DrawSQL – best for good-looking, shareable diagrams
DrawSQL – best for good-looking, shareable diagrams
DrawSQL is the tool people reach for when the ERD needs to look nice – polished visuals, drag-and-drop, easy sharing. The free tier is limited on number of diagrams, and like most ERD tools its job ends at the diagram.
Great for a schema you’ll screenshot into a doc.
QuickDBD – best for a diagram in 60 seconds
QuickDBD – best for a diagram in 60 seconds
QuickDBD leans into speed: type terse lines, get a diagram. It’s the fastest way to sketch a schema you’re reasoning about on a call.
The free tier caps tables and diagrams, and the output is a picture plus SQL.
Lucidchart – best if you already live in it
Lucidchart – best if you already live in it
Lucidchart is a general diagramming suite with ERD shapes, plus AI diagram assistance. If your team already uses it for flowcharts and org charts, adding an ERD is convenient.
But it’s a generic canvas, not a data-native one – it doesn’t understand grain, keys, or joins as first-class concepts. More in OWOX Model Canvas vs Lucidchart for ERDs.
Mermaid – best for diagrams that live in git
Mermaid – best for diagrams that live in git
Mermaid’s erDiagram renders straight from Markdown, so your ERD lives next to your code and updates in pull requests. It’s free and open-source and perfect for READMEs.
It’s code-only (no visual editing) and stops at the picture – but for version-controlled docs it’s hard to beat.
draw.io / diagrams.net – best free generic canvas
draw.io / diagrams.net – best free generic canvas
draw.io is the dependable free, open-source diagramming workhorse. It’ll draw an ERD alongside anything else. Same caveat as Lucidchart: it’s a general canvas, so the “data model” is just boxes and lines with no underlying schema semantics.
OWOX Model Canvas – best if your model needs to be portable and AI-ready
OWOX Model Canvas – best if your model needs to be portable and AI-ready
OWOX Model Canvas is a free, open-source (Apache-2.0) visual canvas that’s data-native: tables, keys, and joins are first-class, and you can draw a model, import one, or describe it and let AI draft it.
What sets it apart from the tools above is the output. Instead of only a picture, it exports OKF – Google’s Open Knowledge Format – a plain-markdown description of your model you can keep in git, review in a pull request, and hand to an LLM as context.
It opens Google’s official GA4, Stack Overflow, and Bitcoin sample bundles, works fully anonymously with no sign-up, and can push a finished model into governed OWOX Data Marts when you’re ready.
Prefer a starting point? Browse the data model template gallery.
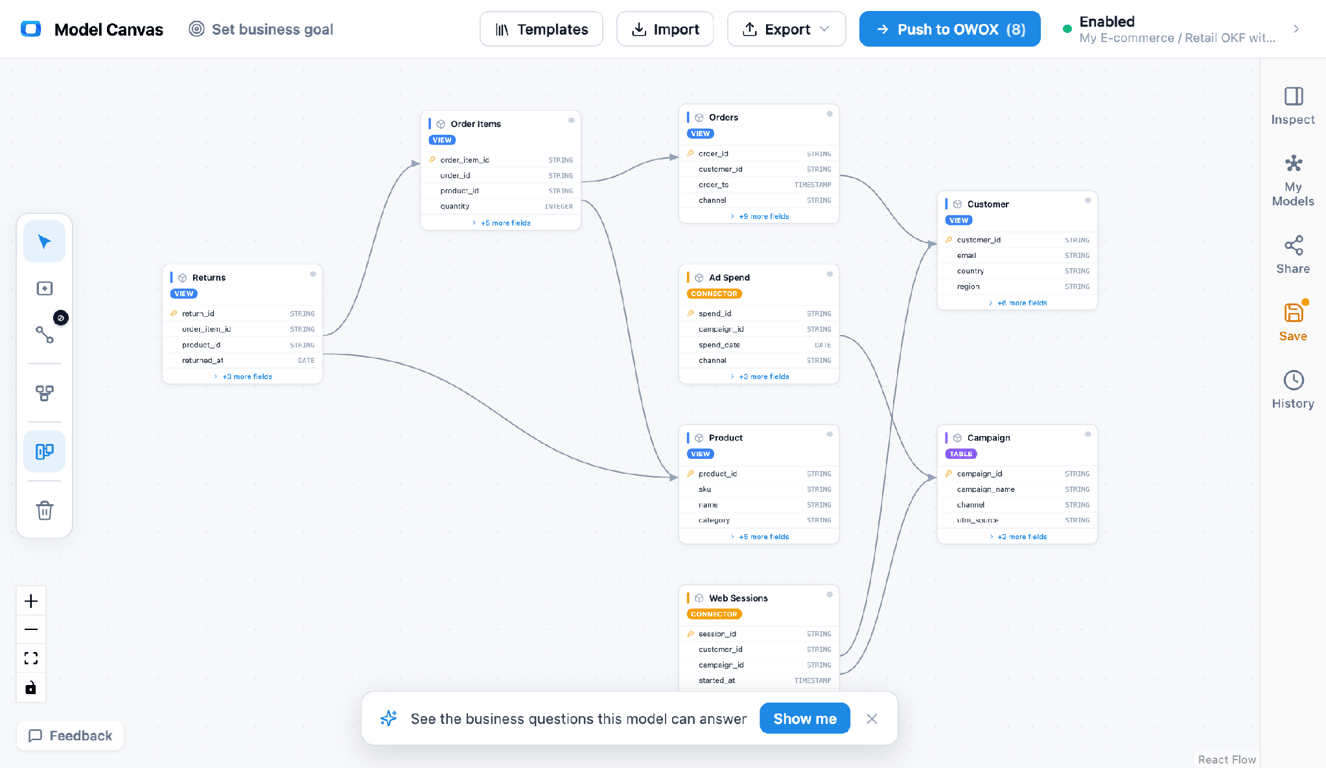
Draw or AI-draft the model, then export OKF (portable markdown) or an image – a spec you can version and hand to an LLM.
The 2026 shift: your ERD is now AI context
The 2026 shift: your ERD is now AI context
Here’s what changed. For years an ERD’s only job was to help a human understand a schema. Now there’s a second reader: the LLM. Text-to-SQL and “chat with your warehouse” tools fail the same way – they invent columns and guess joins – because they have no trustworthy description of your data. A diagram doesn’t help them; a portable, machine-readable model does.
That’s the lens worth applying to any tool on this list: does it output something an agent can read, or just a picture a person can look at? A PNG is a dead end for AI; an open format like OKF is context you can feed straight into a prompt or a retrieval step. It’s the difference between a diagram and a model.
How to choose
- You think in code and want it free → dbdiagram.io (DBML) or Mermaid (if it should live in git).
- You want the prettiest shareable diagram → DrawSQL.
- You need a schema sketch in seconds → QuickDBD.
- You already use a general diagram suite → Lucidchart or draw.io.
- You want the model to be portable and AI-readable → OWOX Model Canvas (exports OKF, opens Google’s samples, open-source, no sign-up).
For deeper background on the underlying design choices – star vs snowflake, fact vs dimension – see understanding star schema, and for more drawing options our roundup of free database diagram design tools.
Turn your data into decisions.
Governed data marts give you the clean foundation ML needs to actually work.
- No AI hallucinations
- Analyst-governed definitions
- Every number traces to SQL
Frequently Asked Questions
Can I keep my ERD in version control?
Yes — that's a strength of the code-based and open ones. Mermaid renders from Markdown in git; OWOX Model Canvas exports OKF (plain text) that you can commit, diff, and review in a pull request.
Are these tools really free, or free trials?
The ones above all have genuine free tiers, though paid plans add collaboration, private diagrams, or higher limits. OWOX Model Canvas, Mermaid, and draw.io are open-source; the modeling and OKF export in Model Canvas are free with no paywall.
What's the difference between an ERD tool and a data modeling tool?
An ERD tool draws the diagram; a data modeling tool understands the model — grain, keys, and joins — and outputs something reusable (SQL, or a portable spec like OKF). The line is blurring, but "does it produce a model or just a picture?" is the useful test. See our \best data modeling tools\ roundup.
Can free ERD tools export SQL?
Most can. dbdiagram.io, DrawSQL, QuickDBD, and Lucidchart all produce SQL DDL to some degree. OWOX Model Canvas focuses on OKF (a portable spec) plus diagram export.
Which ERD tool is best for AI / text-to-SQL?
Look for one that exports a machine-readable model, not just an image. OWOX Model Canvas exports OKF — plain markdown describing tables, columns, and joins — which you can hand to an LLM as context so it stops guessing your schema. A PNG can't do that.
Is there a free ERD tool with no sign-up?
Yes. OWOX Model Canvas runs in the browser fully anonymously — no account needed to draw, import, or export a model. Mermaid and draw.io are also free and open-source.
What is the best free ERD tool?
It depends on how you work. dbdiagram.io is best if you like defining schemas as code; DrawSQL for polished visuals; Mermaid for diagrams that live in git; and OWOX Model Canvas if you want the model to be portable and AI-readable (it exports OKF, an open markdown format). All have genuinely free options.