Marketing ROI on Booked Revenue, Not Platform Revenue
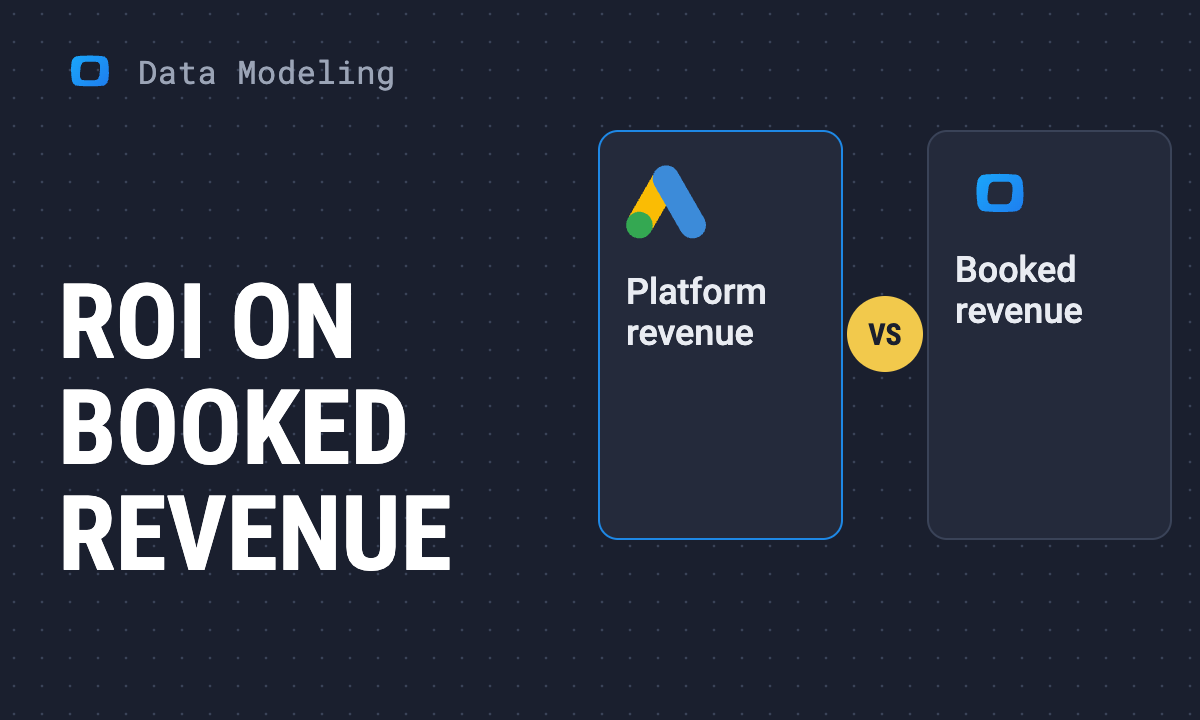
The ad platforms report revenue they claim, at their own click or view, gross, each taking full credit. The books report revenue they recorded: an invoice on its date, net of discounts and credit memos, paid days later or refunded. Marketing ROI computed on the first number does not survive the budget conversation. This article shows where ad spend meets the books in one business data model, reads one company's books through it, and explains how ROAS on booked revenue by campaign replaces the monthly discount factor.
The quarter closes. Say the ad platforms report a return on ad spend of four and the P&L says the quarter was flat. The CFO asks which number the budget request is built on, and the honest answer is: the platforms’ one.
The platform’s revenue is a claim. The books’ revenue is a record. Marketing ROI holds up in the budget conversation only when it is computed on the record, which takes one thing: ad spend and the books in the same data model, on the same keys, so claim and record sit side by side for every campaign.
Two revenues
You know the first half of this table. The second half is the part marketing rarely sees: how finance counts the same sale.
| What | Platform revenue | Booked revenue |
|---|---|---|
| Who counts it | The ad platform, from its pixel and its model | Finance, from the invoice |
| When | At the click or view, inside the platform’s window | On the invoice date, then on the payment date |
| How much | Gross checkout value | Net of discounts, tax kept out of income |
| Refunds | Rarely subtracted | A credit memo, dated when issued |
| Credit | Each platform claims the whole sale | Nobody; a sale is a sale |
The usual repair is a discount factor: take the platforms’ total, knock off a share for over-claiming, compare the rest with the store’s revenue once a month. Better than nothing, and still a guess applied to every campaign equally, a month late.
Where ad spend meets the books
Where ad spend meets the books
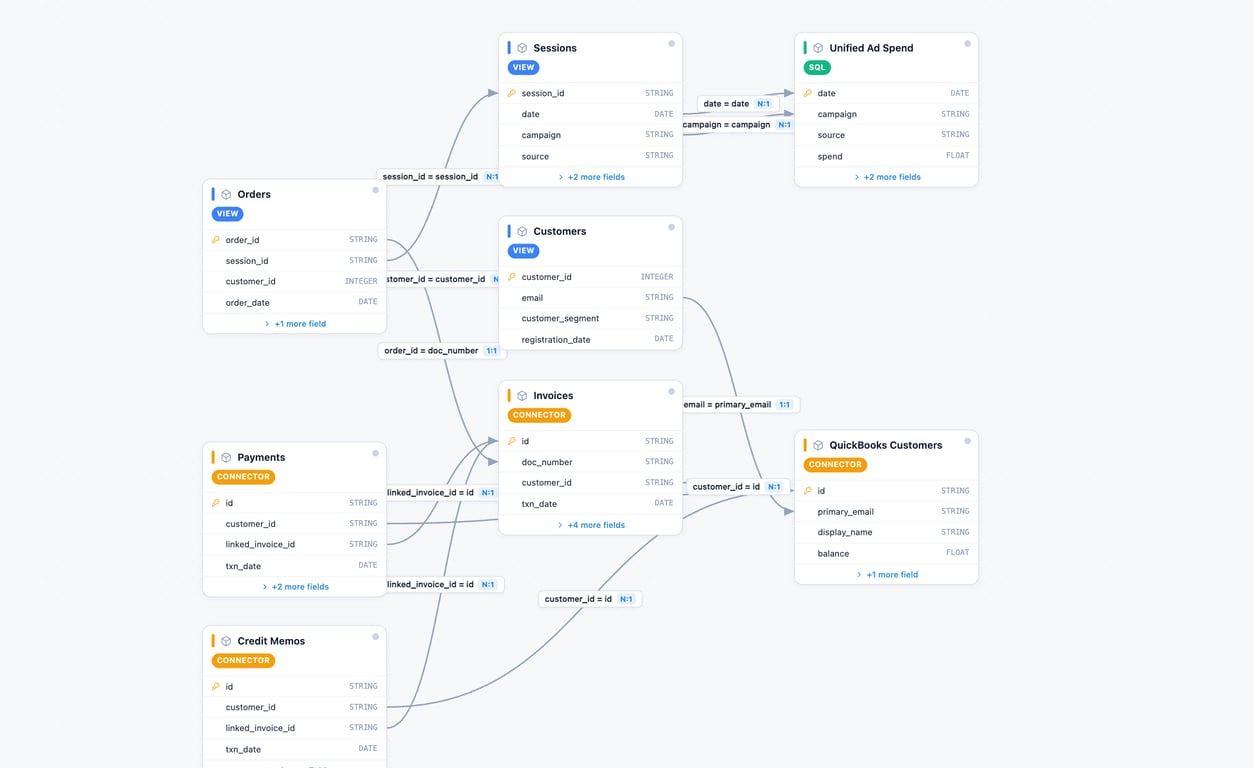
The repair that holds is a join, not a factor. Below is the part of the business data model marketing lives in, with the QuickBooks tables beside it: blue and green badges are the storefront and its ad platforms, orange ones come from QuickBooks through the QuickBooks data source.
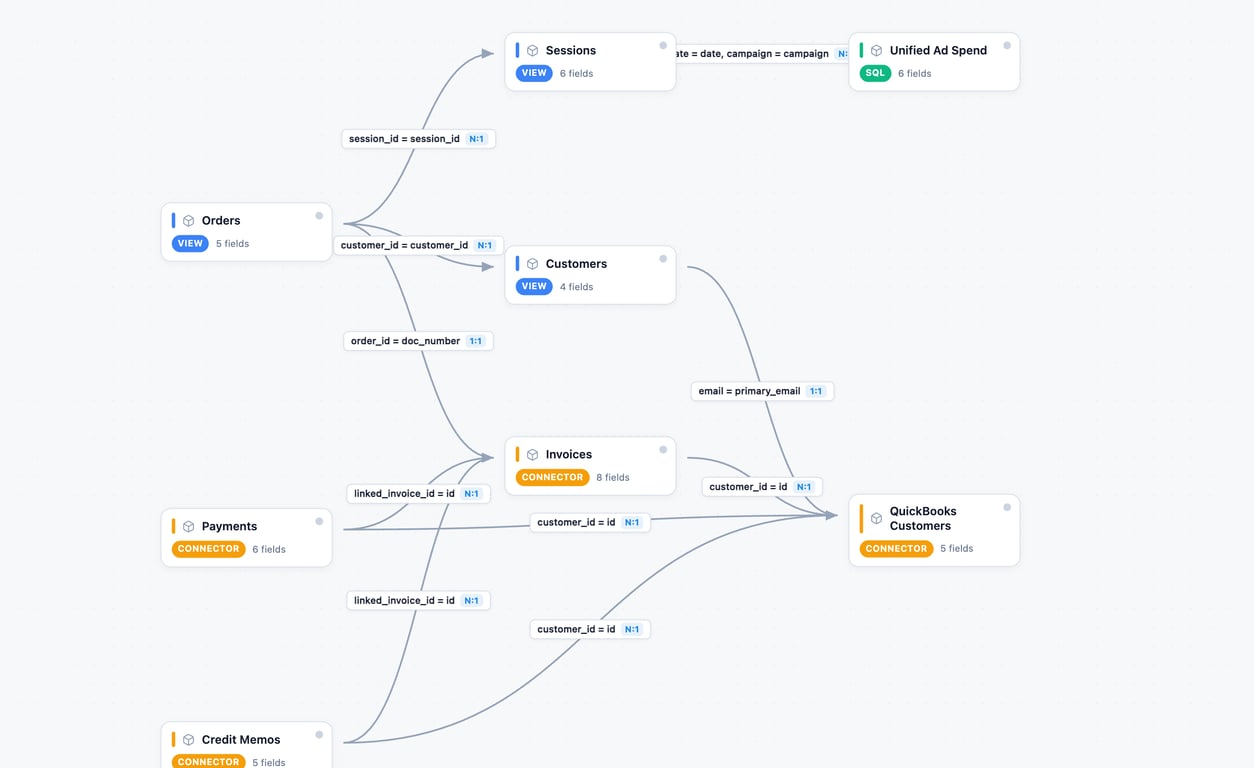
Follow the money from left to right:
- Unified Ad Spend is what Google, Meta and the others charged, by day and campaign, with the conversions each platform claims.
- Sessions carry the campaign that brought the visit, as the storefront’s own tracking recorded it (source, medium and campaign on the landing click), and Orders carry the session they were placed in. That is the only place a campaign and an order meet, and it is the store’s record, not the platform’s. Orders with no campaign are a line of their own.
- Invoices are the same orders as finance sees them. Where the store posts one invoice per order, the order number sits on the invoice. Where the store is paid at checkout and the books receive a daily summary, the day is the key: the campaign split comes from the orders, the books supply the day’s net amount, tax, fees and refunds.
- Payments say when the money arrived. Credit Memos say what came back.
With those joins, a campaign’s revenue reads at three points: what the platform claimed, what the store ordered, what finance booked and collected. The gaps between them are columns with names, not a factor. One thing this does not do: it says what a campaign’s orders became, not whether they would have happened anyway. Incrementality is a separate test, easier to run once the booked number exists.
OWOX Data Marts
See your first report built in real time. 15 minutes.
- Connect your data warehouse
- Pick your metrics
- Get a live Google Sheets report
In the time it takes to write a ticket. Then imagine never writing that ticket again.
Book a DemoWe'll use your actual use case
What one company’s books showed
What one company’s books showed
We loaded one company’s QuickBooks Online into its data warehouse and read it through this model. The books are small and hold no store, so they show the finance side of the join: the things a pixel never sees.
- The sale and the money are weeks apart. Customers took 19 days on average to pay, and 12 of 16 payments landed in a different month from the invoice they settled. A campaign’s October revenue is partly November cash.
- The books take tax, discounts and cost out before the number means anything. In October they set 143.02 of sales tax aside from 4,101.57 invoiced, and recorded 59.00 of discounts and 405.00 of cost of goods.
- A refund can move no cash at all. One September payment of zero applied a 100.00 credit memo against an invoice. Had that invoice been an online order, the platform that claimed it would still be counting it as revenue.
- Ad spend is already in the P&L. Small in these books, but there: the October profit and loss has an Advertising line of 74.86. Finance already holds a total ad-spend figure of its own; per campaign, the denominator still comes from the platforms.
The receivables (what customers still owe) rebuilt from these tables matched QuickBooks’ own report of what is owed, by how overdue, in every bucket; the analyst guide shows that check and the CFO article reads it for finance.
ROAS on booked revenue
With the model in place, return on ad spend is one line per campaign: booked revenue from the invoices the campaign’s orders became, net of discounts and credit memos, divided by that campaign’s spend. The platform’s own ROAS stays beside it as a second column, so the over-claim is visible per campaign rather than averaged away.
This is different from blended ROAS or a marketing efficiency ratio, which divide total revenue by total spend once a month. Blended numbers are honest about the total and silent about the campaign; a factor is a guess about the average. ROAS on booked revenue answers per campaign, and it can restate: a credit memo issued in November against an October order can reduce that campaign’s October revenue, which the books themselves post to November. Agree the cut-off date (the day after which a quarter’s numbers are frozen) with whoever keeps the books before the first report; after it, later credit memos post to the period they are issued in, as the books do.
The platforms’ claims remain useful inside the platforms, for bidding and creative, where only the platform’s own signal exists. They stop being the number marketing brings to the room; which number decides ad spend makes the same case from the marketing side, without the books.
What changes in the budget conversation
What changes in the budget conversation
The CFO reads the revenue marketing reports, because it is finance’s revenue, from the data warehouse copy of the books joined to the campaigns. “Why does your ROAS say four when the P&L is flat” would get an answer with lines in it: how many orders the platforms claimed against how many the store recorded, what the orders became as invoices net of discounts and tax, what was refunded, what is still unpaid. Each line is a column, none is hidden. The question left, which of those orders the campaign caused, is the one worth arguing about.
The companion piece for the CEO, why your dashboard and your accountant disagree on revenue, says the same thing to the rest of the room. The QuickBooks accounting dashboard shows the finance side as a working view.
What to ask for
Send three things to whoever owns the data warehouse, in-house or at your agency, and copy finance:
- The QuickBooks data source page: every table the connector loads and how they join.
- The analyst guide: loading the books and reconciling them to the P&L and the aging.
- The dashboard page: what the finance view looks like once it is there.
Then ask for one report before any dashboard: last quarter’s campaigns, three revenue columns each, claimed, ordered, booked, with the rule that assigns an order to a campaign written at the top. That is the page to bring to the next budget conversation.
Turn your data into decisions.
Governed data marts give you the clean foundation ML needs to actually work.
- No AI hallucinations
- Analyst-governed definitions
- Every number traces to SQL
Frequently Asked Questions
What is the difference between platform revenue and booked revenue?
Platform revenue is what an ad platform claims: a sale counted when its pixel fires, inside its own attribution window, at the gross checkout value, with each platform taking the whole credit. Booked revenue is what finance recorded: an invoice on its accounting date, net of discounts, with sales tax kept out of income, reduced later by any credit memo. The two differ by design, which is why marketing ROI computed on platform revenue does not survive the budget conversation.
Why don't Meta and Google Ads revenue match finance?
Because each platform counts its own claim and finance counts the record. Two platforms claim the same order; view-through and modelled conversions add sales no pixel saw complete; the platform counts the gross checkout value while the books net out discounts and tax and subtract refunds as credit memos; and the platform counts at the click while the books count on the invoice date and the payment date. In one company's books, 12 of 16 payments landed in a different month from their invoice and one payment applied a 100.00 credit memo with no cash moving.
What is ROAS on booked revenue?
Return on ad spend computed per campaign on the revenue finance booked rather than the revenue the platform claimed: the invoices that the campaign's orders became, net of discounts and credit memos, divided by that campaign's spend. It needs ad spend, sessions, orders, invoices, payments and credit memos in one data model on shared keys (campaign on the session, session on the order, order number on the invoice). The platform's own ROAS sits beside it as a second column, so the over-claim is visible per campaign instead of averaged away.
Is blended ROAS or MER enough instead of joining ad spend to the books?
It is honest about the total and silent about the campaign. Blended ROAS or a marketing efficiency ratio divides total revenue by total spend once a month, so it cannot say which campaign over-claims, and a discount factor applied to platform revenue is a guess about the average. ROAS on booked revenue by campaign answers the same question per line and moves with the books when a credit memo posts.