We analyzed 1,438 job postings. Here’s what reporting analysts actually do.
Here’s a reporting analyst job posting I pulled this morning:
“Seeking a Reporting Analyst to build and maintain dashboards, write SQL queries, automate recurring reports, integrate data from multiple platforms, and enable self-service analytics for business stakeholders. Must ensure data quality and governance compliance. Salary: $85,000–$110,000.”
That’s twelve distinct skills compressed into one paragraph – and one salary. But here’s the question nobody asks: how many of those skills actually require a human?
We analyzed 1,438 reporting analyst job postings from US ecommerce SMBs to find out. We categorized every skill mentioned, counted the frequencies, and split them into two buckets: skills a tool can deliver for $0–90/month, and skills that genuinely require a $70–120K/year human. The results will change how you think about the role – whether you’re in it or hiring for it.
What 1,438 job postings tell us about the reporting analyst role
What 1,438 job postings tell us about the reporting analyst role
Before we get into the skills breakdown, a quick note on where this data comes from and why it matters.
How we collected and categorized the data
We pulled 1,438 job postings for reporting analyst positions at US ecommerce companies with 50–500 employees. The postings came from major job boards between 2024 and early 2026. We extracted every skill mentioned, normalized the language (because “build dashboards” and “create data visualizations” mean the same thing), and counted frequencies across the full set.
Then we split every skill into two categories:
- Automatable – can be delivered by data integration tools, scheduling engines, or pre-built data marts without ongoing human judgment
- Human-required – needs context, institutional knowledge, stakeholder relationships, or judgment that tooling can’t replicate
The percentages below represent how often each skill appeared across all 1,438 postings.
The typical reporting analyst profile at a US ecommerce SMB
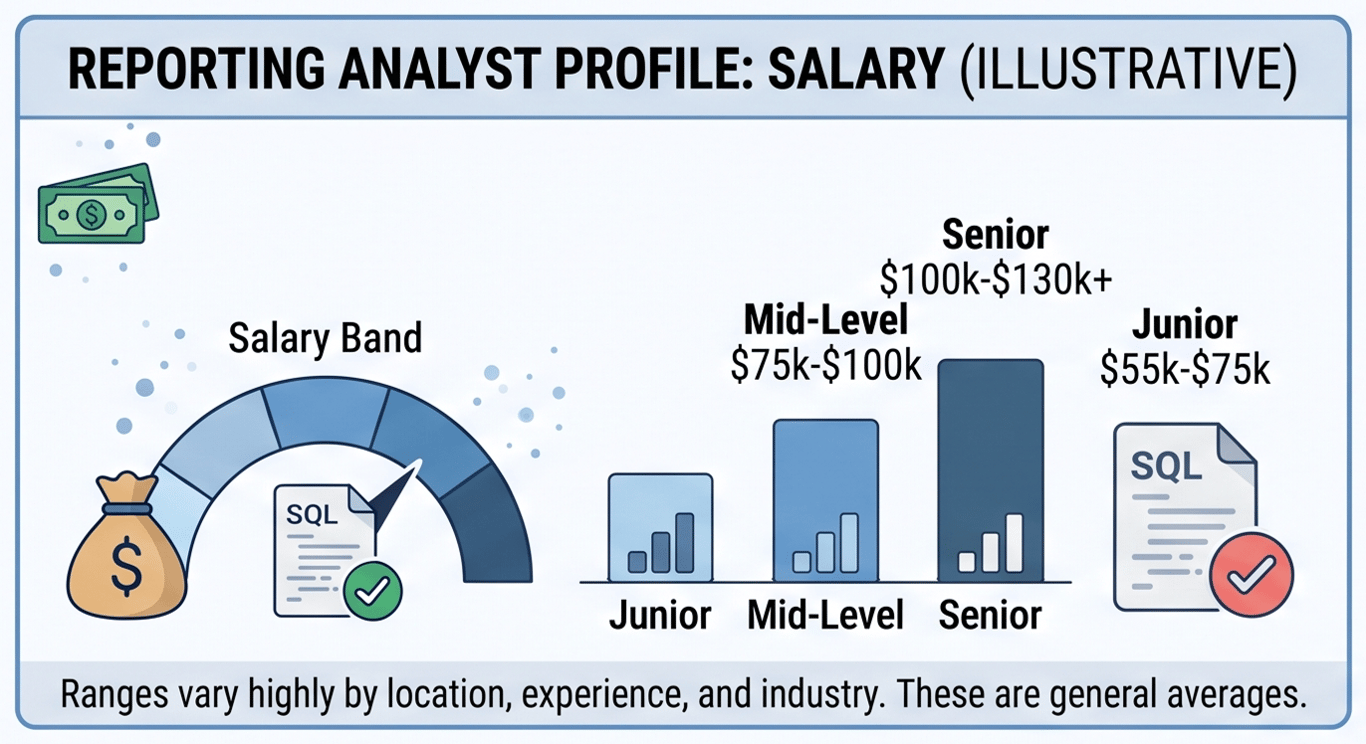
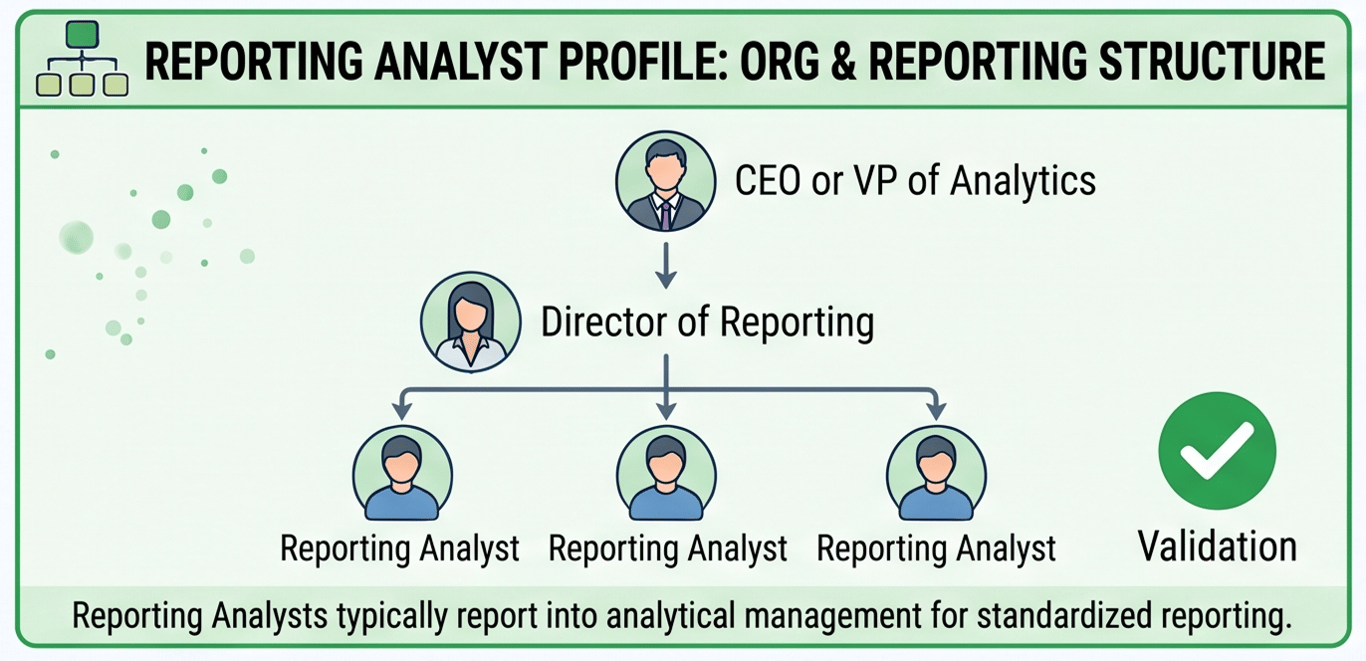
The median salary in our dataset sits around $83,000–$95,000, with a full range of $70,000–$120,000 depending on location and seniority. Most postings report into a Head of Analytics, VP of Marketing, or Director of Data – rarely directly to the C-suite.
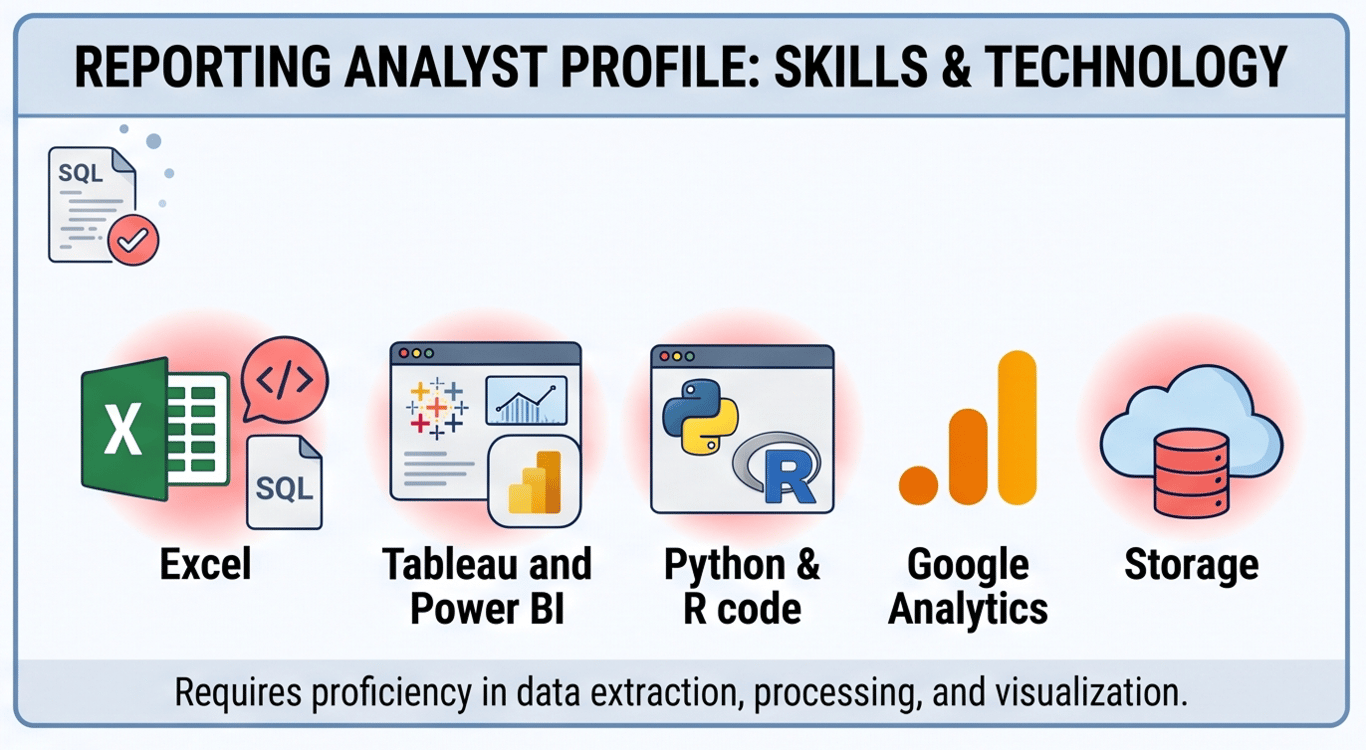
The tool stack is remarkably consistent: SQL is near-universal, followed by Excel or Google Sheets, then a BI tool (Looker, Tableau, or Power BI). About 30% of postings mention Python, usually as a nice-to-have rather than a requirement.
The typical day, based on the posting language, looks like this: pull data from a warehouse, join it with marketing platform data, build or refresh a report, answer a Slack question from the VP of Marketing or CEO, troubleshoot why yesterday’s numbers look weird, and – if there’s time – work on that dashboard redesign that’s been on the backlog for three months.
The six skills employers actually ask for
The six skills employers actually ask for
Every job posting is a wish list. But when you count what appears across 1,438 of them, patterns emerge fast. These are the six skills that employers consistently ask for – and every single one of them can be delivered by tooling.
SQL and query writing (95%)
This one barely needs explaining. SQL appears in 95% of reporting analyst postings – it’s the lingua franca of the role. But the specific SQL skills requested tell a more nuanced story.
Most postings ask for “ability to write and optimize complex queries” – which in practice means joins across 3–5 tables, aggregations with GROUP BY, window functions for running totals and rankings, and CTEs for readable multi-step logic. These aren’t data-science-grade queries. They’re the same 15–20 patterns repeated across every ecommerce reporting use case: revenue by channel, conversion by cohort, LTV by segment, inventory turnover by category.
That repeatability is the point. When the same query pattern appears hundreds of times, it’s a candidate for a data mart – a pre-built, tested, governed dataset that delivers the answer without anyone writing SQL from scratch every Monday morning.
Data integration and pipeline management (85%)
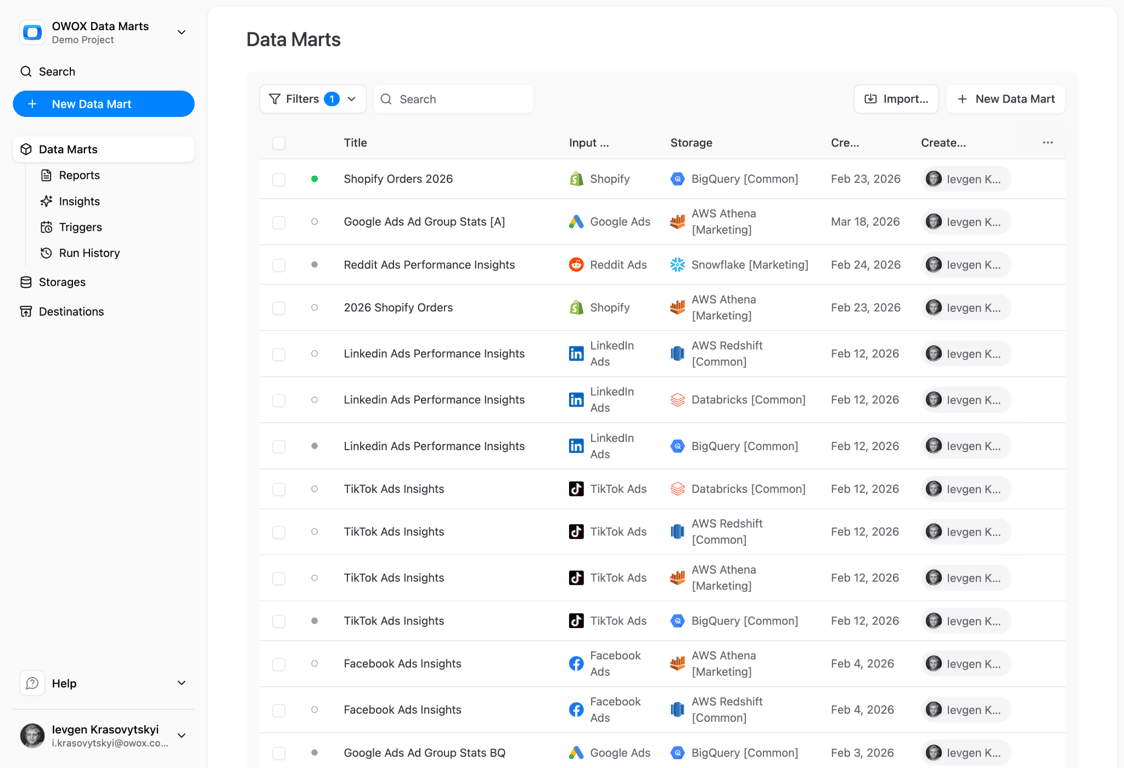
“Experience with ETL/ELT tools” shows up in 85% of postings. In plain language: companies need someone to make sure data from Google Ads, Shopify, their CRM, and their ERP all lands in the same warehouse in a queryable format.
This is plumbing work. Important plumbing – but plumbing. The job is connecting source A to destination B, handling schema changes, monitoring for failed loads, and making sure yesterday’s Shopify orders are in BigQuery by 6 AM. It requires initial setup expertise and ongoing monitoring, but the actual daily execution is almost entirely automatable with the right connectors.
Report building and visualization (80%)
“Build and maintain recurring reports for stakeholders” – that phrase, or a close variant, appears in 80% of postings. The tool varies (Looker, Tableau, Power BI, Google Sheets), but the job is the same: take data from the warehouse, make it look presentable, and deliver it on schedule.
There’s a crucial distinction most postings blur: building a report and maintaining a report are completely different skill levels. Building the first version requires understanding what the stakeholder actually wants (a human skill – more on that later). But maintaining it – refreshing the data, updating date ranges, adjusting for new product categories – is mechanical.
The maintenance burden is what kills analyst productivity. I’ve seen teams where 60% of analyst time goes to maintaining existing reports, leaving almost nothing for new analysis. That’s not a people problem. It’s an infrastructure problem.
Scheduling and automation (70%)
“Automate recurring reports” appears in 70% of postings, and it’s the skill that best illustrates the gap between what companies want and what they’ve actually built. Most ecommerce SMBs don’t have Airflow or Prefect. They have a Google Sheet that someone manually refreshes every Monday, or a cron job that nobody remembers setting up.
What they actually need is orchestration: run this query at 6 AM, wait for the data to land, transform it, push the results to a Google Sheet, and send a Slack notification when it’s done. If anything fails, retry once, then alert the analyst. This is exactly the kind of workflow that doesn’t need a $90K/year human watching it.
Self-service access and dashboards (65%)
“Enable business users to self-serve data” is one of those phrases that sounds simple in a job posting and is absolutely brutal in practice. It shows up in 65% of postings – and I’d estimate that fewer than 10% of those companies have actually achieved it.
True self-service means business users can answer their own questions without filing a ticket. That requires governed data marts with clear naming, appropriate permissions, and an interface that doesn’t require SQL knowledge. Most attempts at self-service fail because they hand business users a BI tool connected to a raw warehouse and call it “democratized.”
The part most guides skip is that self-service is an architecture problem, not a training problem.
You don’t need to spend 6 months for a semantic layer – instead you need joinable data marts with predefined metrics and dimensions that business users can navigate without understanding the underlying table structure.
Access control and permissions (40%)
The least frequent of the six skills, but the fastest growing. Access control appears in 40% of postings – up from roughly 25% two years ago. The rise tracks directly with data governance and compliance pressure.
In practice, this means row-level security (marketing sees marketing data, finance sees finance data), role-based access permissions, and PII handling. Most analysts learn this reactively – someone sees something they shouldn’t, and suddenly access control becomes a priority.
| Skill | Frequency in postings | Automatable? | OWOX feature |
|---|---|---|---|
| SQL and query writing | 95% | Yes – via data marts | Data Mart Management |
| Data integration | 85% | Yes – via connectors | Data Sources + Connectors |
| Report building | 80% | Yes – via spreadsheet delivery | Spreadsheet Reporting |
| Scheduling | 70% | Yes – via orchestration | Orchestration (Triggers) |
| Self-service access | 65% | Yes – via semantic layer | Joinable Data Marts + Conversational UI |
| Access control | 40% | Yes – via role-based permissions | Access Permissions |
OWOX Data Marts
See your first report built in real time. 15 minutes.
- Connect your data warehouse
- Pick your metrics
- Get a live Google Sheets report
In the time it takes to write a ticket. Then imagine never writing that ticket again.
Book a DemoWe'll use your actual use case
The skills that stay human
Now for the other side of the ledger. These are the skills that appear in the same job postings but can’t be replaced by a tool at any price. They require context, relationships, judgment, and the kind of institutional knowledge that doesn’t fit in a database schema.
Stakeholder translation (85%)
“Translate business questions into data requirements” – or some version of it – appears in 85% of postings. It’s the single most requested human skill, and for good reason.
When a VP of Marketing says “hey, can you pull something on how we did last quarter?” – that’s not a data request. That’s a conversation opener. What they actually need might be a channel-by-channel attribution breakdown, or a cohort retention analysis, or just a single number they can put in a board deck. The analyst’s job is to figure out which one, ask the right follow-up questions, and deliver something useful – not just accurate.
This skill can’t be automated because the input is ambiguous by nature. The same words mean different things depending on who’s asking, when they’re asking, and what decision they’re trying to make. An LLM can generate SQL. It can’t read the room.
Business-logic mapping (75%)
Here’s something that almost never appears in documentation: “revenue” means different things to different teams. Finance counts it net of returns and chargebacks. Marketing counts it at the point of conversion. Product counts it per user. The reporting analyst is often the only person who knows all three definitions and where they diverge.
Business-logic mapping – understanding the domain-specific rules that determine how data should be interpreted – shows up in 75% of postings. It’s the skill that turns a table of numbers into an answer.
This is why experienced data analysts at a company are so hard to replace. They carry institutional knowledge: why this metric was defined this way, which edge cases to watch for, what happened in Q3 2024 that makes year-over-year comparisons misleading. That context lives in people’s heads, not in the warehouse.
Variance diagnosis and root cause analysis (70%)
The dashboard says revenue dropped 15% week-over-week. Now what?
Variance diagnosis – figuring out why a number changed, not just that it changed – appears in 70% of postings. This is where reporting separates from analytics. A report tells you the number went down. A good analyst tells you it went down because a paid search campaign was paused on Tuesday, which overlapped with a site outage on Wednesday, and the comp period included a flash sale that inflated the baseline.
That kind of root cause analysis requires cross-functional context, historical knowledge, and pattern recognition that no dashboard can provide. Alerting tools can tell you something changed. They can’t tell you what to do about it.
Metric definitions and ownership (50%)
Who decides what “active user” means? In most ecommerce SMBs, the answer is the reporting analyst – whether they signed up for that responsibility or not.
Metric definitions and ownership shows up in 50% of postings, but the real frequency is probably higher. Many postings describe this skill without naming it: “ensure consistency of KPIs across teams”, “maintain metric documentation”, “resolve discrepancies between reports.”
The analyst becomes the de facto metrics governor – the person who arbitrates when two dashboards show different numbers for the same thing. This is a trust-building role. It requires authority, communication skills, and a willingness to say “actually, both numbers are right – they’re just measuring different things.”
Data integrity and governance (80%)
Trust in data is a human problem, not a technical one. Data integrity and governance appears in 80% of postings – a higher frequency than many of the technical skills – because companies have learned the hard way that bad data is worse than no data.
In practice, this means: validating data after pipeline runs, documenting data lineage, flagging anomalies before they reach a stakeholder’s inbox, and maintaining the kind of data governance practices that keep auditors happy. Tools can automate monitoring and alerting. But the judgment call – “is this anomaly a bug or a real business event?” – stays human.
AI orchestration (25% – and growing)
The newest skill on the list, and the one growing fastest. AI orchestration – knowing when to use AI tools and when not to – appears in just 25% of postings today, but that number has roughly tripled since early 2024.
What it means in practice: using AI tools to generate first drafts of SQL queries, summarize large datasets, or identify patterns – then validating the output before it reaches a stakeholder. The key word is orchestration, not delegation. The analyst doesn’t hand the job to AI and walk away. They direct the AI, check its work, and take responsibility for the answer.
This is the emerging differentiator. Analysts who can orchestrate AI effectively will do the work of three analysts. Those who can’t will be competing with tools that cost $90/month.
| Human skill | Frequency | Why it stays human |
|---|---|---|
| Stakeholder translation | 85% | Ambiguous input, political context, relationship-dependent |
| Data integrity & governance | 80% | Trust is earned through judgment, not automation |
| Business-logic mapping | 75% | Domain knowledge lives in heads, not schemas |
| Variance diagnosis | 70% | Requires cross-functional context and historical knowledge |
| Metric definitions | 50% | Organizational authority and communication, not code |
| AI orchestration | 25% | Requires judgment on when AI output is trustworthy |
Reporting analyst vs data analyst – where the roles diverge
Reporting analyst vs data analyst – where the roles diverge
These two titles get used interchangeably in about a third of the postings we reviewed. But when companies are precise about the distinction, a clear pattern emerges.
Scope and focus differences
Reporting analysts are operational. Their primary output is production-grade, recurring deliverables: the Monday revenue dashboard, the monthly board deck, the real-time inventory alert. They optimize for reliability, consistency, and stakeholder trust. A reporting analyst’s worst nightmare is a broken dashboard on a Monday morning.
Data analysts are more exploratory. Their primary output is answers to questions that haven’t been asked before: “Why did retention drop in the Pacific Northwest?”, “What would happen if we raised free shipping thresholds?” They optimize for insight, speed, and depth. A data analyst’s worst nightmare is spending all day refreshing existing reports.
Skill overlap and where they split
The tools overlap heavily – both roles need SQL, both use BI platforms, both work with stakeholders. The divergence is in what they do with those tools.
| Dimension | Reporting analyst | Data analyst |
|---|---|---|
| Primary output | Recurring dashboards, scheduled reports | Ad-hoc analyses, recommendations |
| SQL complexity | Joins, aggregations, CTEs, window functions | Same + statistical functions, sampling, modeling |
| Automation focus | High – automate everything recurring | Moderate – automate data prep, not analysis |
| Stakeholder interaction | Frequent, operational (status of reports) | Frequent, strategic (what does the data mean?) |
| Python/R | Nice-to-have (30% of postings) | Often required (55% of postings) |
| Statistics | Basic (averages, distributions) | Intermediate+ (hypothesis testing, regression) |
The key insight: reporting analysts spend more time on the automatable stack (SQL, integration, scheduling, report maintenance), which means they benefit more from tooling that handles that layer. A data analyst’s work is harder to automate because it’s exploratory by definition.
The economics – salary vs automation cost
The economics – salary vs automation cost
This is the section that makes the business case. Not against reporting analysts – but for a different allocation of what they spend their time on.
What companies pay for the full skill bundle
A reporting analyst at a US ecommerce SMB earns $70,000–$120,000 per year. The median in our dataset is around $88,000. Add benefits, payroll taxes, tools, and management overhead, and the total cost of employment is roughly $100,000–$160,000 per year.
For that investment, you get a person who writes SQL, maintains integrations, builds dashboards, schedules reports, manages access, and translates stakeholder needs, defines metrics, diagnoses variances, and governs data quality. You get the full bundle.
The question isn’t whether that’s a fair price. It’s whether you’re getting the right return on that investment.
What the automatable stack costs with tooling
The six automatable skills – SQL queries, data integration, report building, scheduling, self-service, and access control – can be delivered by a platform like OWOX for under $100 per month.
That covers:
- Data marts with joins that replace repetitive SQL tasks for common ecommerce reporting patterns
- Connectors that replace manual ETL scripts and integration maintenance
- Spreadsheet and Looker Studio delivery that replaces manual report refreshing
- Orchestration triggers that replace cron jobs and manual scheduling
- Conversational UI and joinable data marts that enable genuine self-service analytics
- Role-based access permissions that replace ad-hoc security configurations
The math – $70–120K/yr vs $0–90/mo
Let’s be blunt about what this means.
If 60% of a reporting analyst’s day goes to the automatable skills (a conservative estimate – some teams report 70%+), then you’re paying $42,000–$72,000 per year for work that costs $0–$1,080 per year with tooling.
| Skill category | Human cost (annual) | Tooling cost (annual) |
|---|---|---|
| Automatable stack (SQL, integration, reports, scheduling, self-service, access) | $42,000–$72,000 | $0–$1,080 |
| Human stack (translation, logic, diagnosis, metrics, governance, AI orchestration) | $28,000–$48,000 | Not automatable |
| Total | $70,000–$120,000 | $0–$1,080 + human |
The point isn’t to fire the analyst. The point is to free them. An analyst spending 60% of their time on mechanical tasks is an analyst who can’t do the work that actually moves the business.
The economics aren’t about cutting costs – they’re about redirecting the $70–120K investment toward the skills that generate ROI: stakeholder translation, business logic, and the kind of judgment that turns data into decisions.
How OWOX covers the automatable stack
How OWOX covers the automatable stack
Here’s the specific mapping between the six automatable skills from the job postings and the OWOX features that deliver them. No theory – just features and what they replace.
SQL → data marts
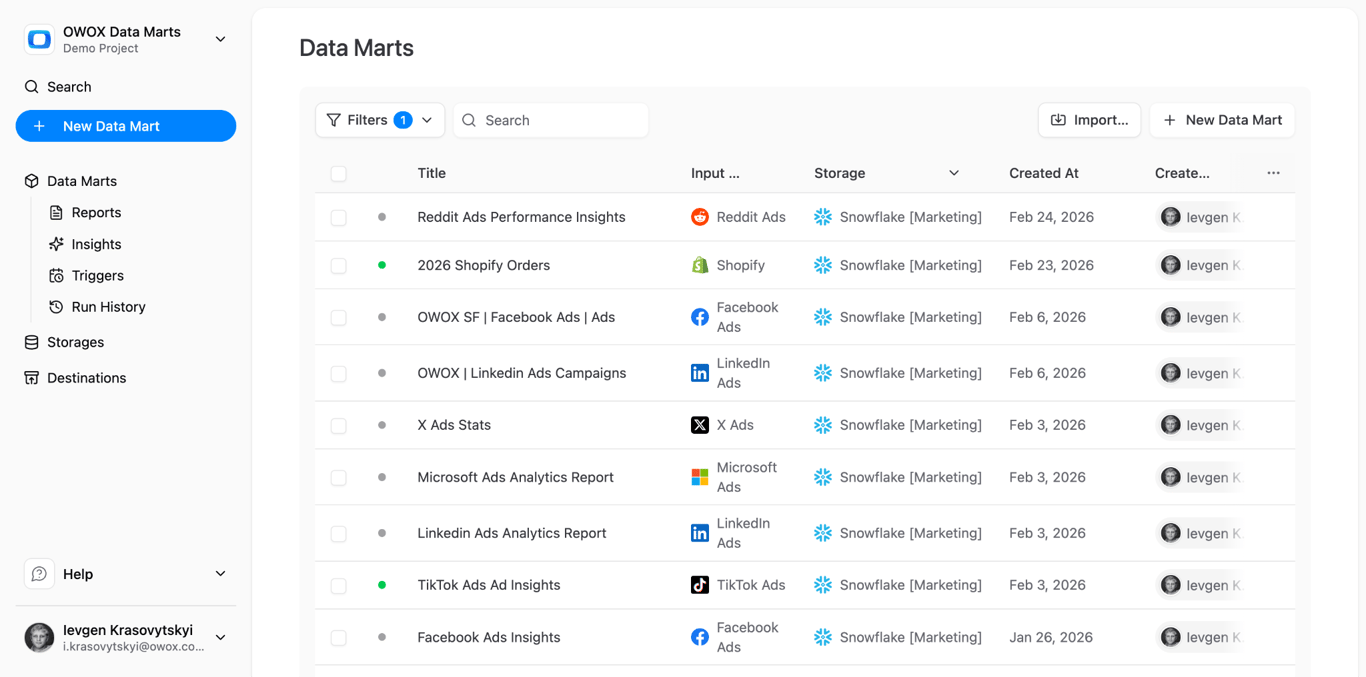
The most common SQL patterns in reporting analyst postings – revenue by channel, conversion by cohort, retention curves, funnel drop-off – are exactly the patterns that data marts are built for. Analysts define the logic once then joins data marts with data modeling. Business users consume the results through Sheets, Looker Studio, or the conversational UI in tools like Claude.
Setup takes about two minutes per data mart. The analyst’s SQL expertise isn’t wasted – it’s elevated from repetitive query writing to one-time model design.
Integration → connectors
The 85% of postings that ask for “data integration experience” are asking for someone to connect marketing platforms to a warehouse. OWOX’s data source connectors cover platforms – Google Ads, Facebook, Shopify, etc – with no-code setup. Data lands in your data arehouse on schedule, with schema handling and error monitoring built in.
Reports → spreadsheet reporting + Looker Studio
The 80% of postings asking for “report building” are mostly asking for recurring deliverables in Sheets or a BI tool. OWOX spreadsheet reporting pushes data mart results directly to Google Sheets on schedule. For visual dashboards, the Looker Studio connector turns any data mart into a live data source.
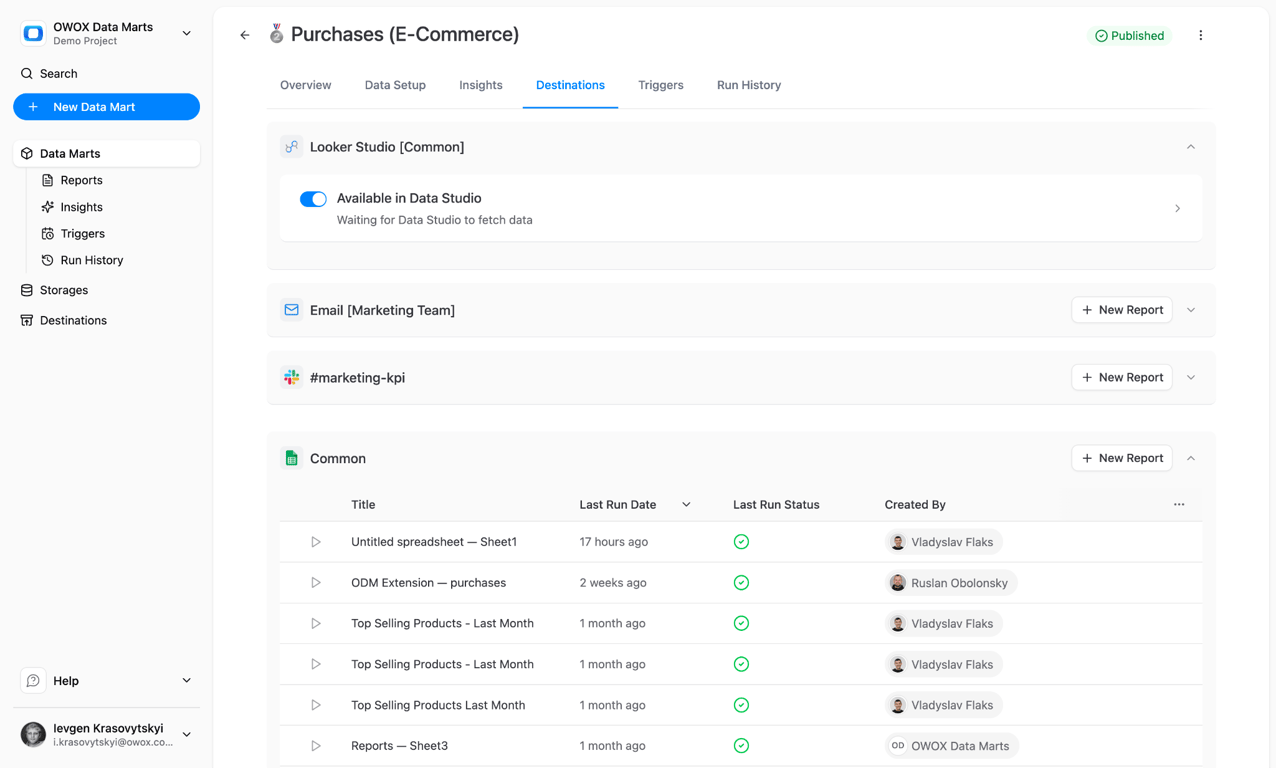
No manual refresh. No copy-paste from a query result. The report updates itself.
Scheduling → orchestration
The 70% asking for “automate recurring reports” need orchestration. OWOX triggers run data marts on schedule or on event, handle dependencies between marts, manage retries on failure, and notify the team when something needs attention.
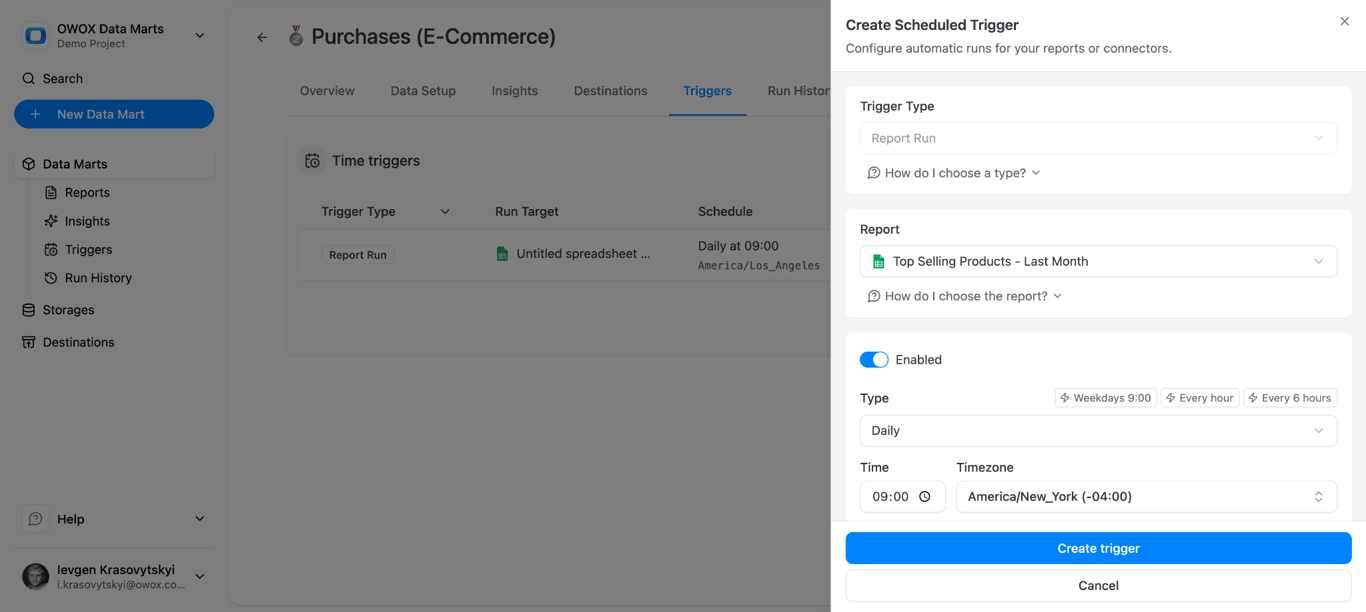
Honestly, the setup takes about two minutes. Define the trigger, set the schedule, done. The analyst goes from babysitting cron jobs to checking a notification feed.
Self-service → conversational UI + access permissions
The 65% asking for “self-service analytics” need two things: a queryable interface that doesn’t require SQL, and a permission model that keeps data secure. OWOX’s conversational UI lets business users ask questions in plain English against governed data marts. Access permissions ensure they only see what they should see.
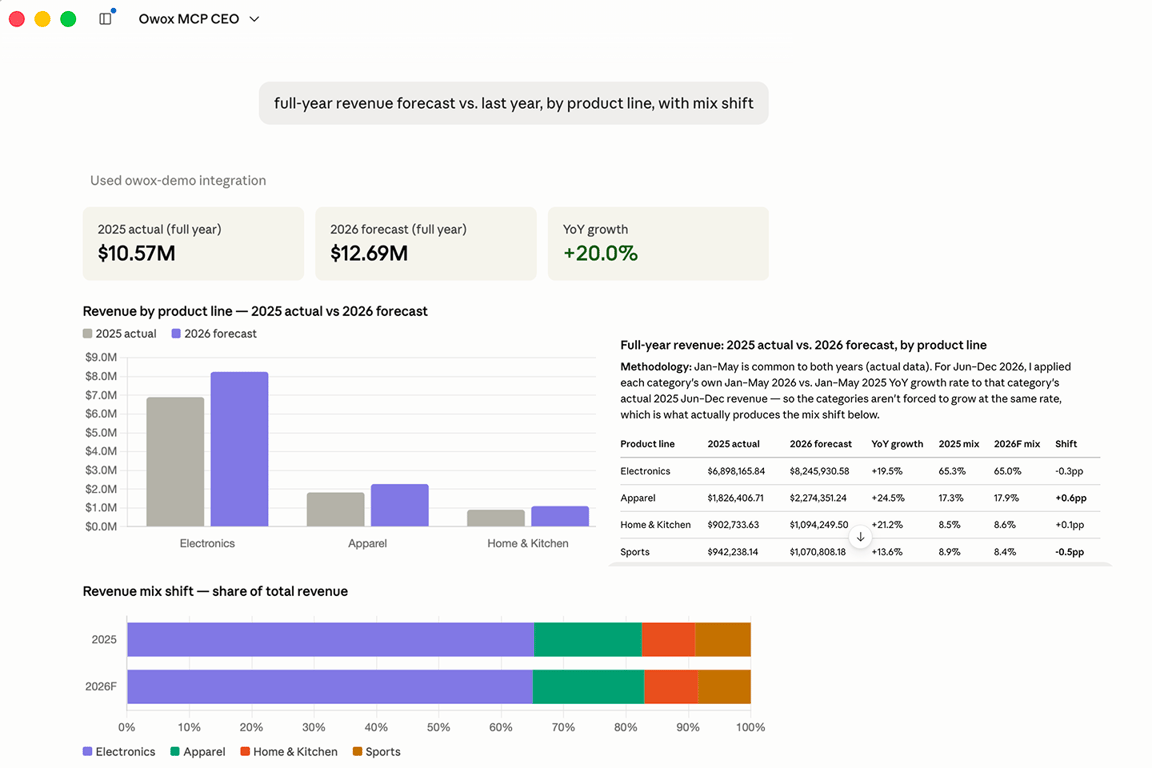
This is where the reporting analyst’s time gets freed the most dramatically. Every ad-hoc request that used to require an analyst writing a query now gets answered by the tool – with guardrails the analyst defined.
What this means for your career (or your next hire)
What this means for your career (or your next hire)
The data tells a clear story. The reporting analyst role isn’t disappearing – it’s splitting. The mechanical half is being absorbed by tooling. The human half is becoming more valuable. Where you go from here depends on which side of the desk you sit on.
If you’re a reporting analyst
Your SQL skills aren’t going away – but they’re becoming table stakes. In 2026, “I can write SQL” has the same career value as “I know Excel” had in 2015. It’s necessary, not sufficient.
The career move is from executor to orchestrator. The analysts who thrive in the next five years will be the ones who set up the automatable stack (data marts, connectors, scheduling), then spend their freed-up time on the work that actually drives decisions: understanding what stakeholders really need, mapping business logic into data models, diagnosing why metrics moved, and managing the reporting backlog strategically rather than reactively.
Practically, that means investing in three areas:
- Stakeholder translation – learn to ask better questions, not just write better queries
- Data governance – become the person the org trusts to define and defend metrics
- AI orchestration – learn to direct AI tools effectively, validate their output, and take responsibility for the results
If you’re hiring one
Rewrite the JD. Seriously. Most reporting analyst postings are a undifferentiated blend of automatable tasks and human judgment skills, priced as one bundle. That leads to two bad outcomes: overpaying for mechanical work, or undervaluing the judgment.
Instead, separate the stack:
- Automate first: Set up the tooling for SQL, integration, reporting, scheduling, self-service, and access. That’s OWOX at $0–90/mo.
- Then hire for judgment: The analyst you need is great at stakeholder translation, business-logic mapping, variance diagnosis, and metric governance. Pay them well – they’re doing work no tool can replicate.
- The hybrid model: One senior analyst with strong judgment skills, equipped with a tool that handles the mechanical stack, will outperform a team of three junior analysts refreshing dashboards manually. The math isn’t close.
Turn your data into decisions.
Governed data marts give you the clean foundation ML needs to actually work.
- No AI hallucinations
- Analyst-governed definitions
- Every number traces to SQL
Frequently Asked Questions
Is reporting analyst a good career in 2026?
Yes, but the role is evolving fast. Analysts who spend most of their time on automatable tasks like refreshing dashboards and writing repetitive SQL are increasingly competing with tools that cost $90 per month. Analysts who invest in human-judgment skills such as stakeholder translation, business logic, governance, and AI orchestration are becoming more valuable. The career path leads to senior analytics, analytics engineering, or data leadership roles.
How do you transition from reporting analyst to senior data analyst?
Invest in the skills that stay human: stakeholder translation, business-logic mapping, and variance diagnosis. Build expertise in metric governance and become the person your organization trusts to define KPIs. Learn to orchestrate AI tools effectively. The transition is from executor running reports to advisor interpreting data and recommending actions. Automating the mechanical work first frees time for strategic thinking.
What SQL skills do reporting analysts need?
The most requested SQL skills are writing and optimizing joins across multiple tables, GROUP BY aggregations, window functions like ROW_NUMBER and running totals, CTEs for readable multi-step queries, and basic performance optimization. These are not data-science-grade skills but rather the 15 to 20 query patterns that cover most ecommerce reporting needs.
What is the average salary for a reporting analyst in the US?
Based on analysis of 1,438 job postings at US ecommerce SMBs, the range is $70,000 to $120,000 with a median around $88,000. Salaries skew higher on the coasts and at larger companies. Total cost of employment including benefits and overhead typically runs $100,000 to $160,000 per year.
Can reporting be fully automated with AI?
The mechanical parts — writing repetitive SQL, refreshing dashboards, scheduling data loads, managing access — yes, and that covers 60% or more of the typical reporting analyst workload. But stakeholder translation, business-logic mapping, variance diagnosis, and metric definitions require organizational context and judgment that AI cannot replicate. The future is human analysts orchestrating AI tools, not being replaced by them.
What tools do reporting analysts use most?
SQL is near-universal, appearing in 95% of job postings. After that comes Google Sheets or Excel, a BI tool like Looker, Tableau, or Power BI, and increasingly a data integration platform. About 30% of postings mention Python as a nice-to-have. The trend is toward unified platforms that combine integration, transformation, and delivery rather than separate tools for each step.
What is the difference between a reporting analyst and a data analyst?
Reporting analysts focus on production-grade recurring deliverables like dashboards, scheduled reports, and operational metrics. Data analysts do more exploratory work including ad-hoc analyses, hypothesis testing, and strategic recommendations. Both need SQL and stakeholder skills, but reporting analysts spend more time on automation and maintenance while data analysts spend more time on investigation and modeling.