
Snowflake for Data Analysts: How to Turn Your Warehouse Into a Reusable Reporting Layer
Discover how analysts can turn Snowflake into a governed reporting layer with reusable data marts, standardized metrics, and trusted AI insights


Snowflake gives data teams elastic storage, scalable compute, and a modern SQL engine. For data analysts, though, it often stops short of what you really need: a reliable, reusable reporting layer that business stakeholders can actually self-serve from.
Most analytics stacks built on Snowflake end up with the same pattern:
- Analysts writing ad hoc SQL directly against raw or lightly-modeled tables
- Dozens of slightly different versions of “the same” metric are living in BI tools
- Dashboards that break when someone renames a column or swaps a source
- A growing dependency on data engineers to make even small changes
.png)
This article focuses on how analysts can turn Snowflake from “just a warehouse” into a governed, reusable reporting layer that supports consistent metrics, self-service analytics, and trustworthy AI use cases – without turning every request into a data engineering project.
We’ll walk through a data-analyst-centric approach where you:
- Design a data mart layer on top of Snowflake
- Encapsulate business logic into reusable data marts
- Standardize metrics, so they’re computed once and reused everywhere
- Expose clean, governed record-level data to BI tools and AI tools
Along the way, we’ll look at how an analyst-owned control layer – such as OWOX Data Marts – can sit between Snowflake and your business tools to orchestrate this reporting layer in a way that’s transparent, governed, and maintainable.
If you’re an analyst who spends too much time maintaining brittle dashboards, rewriting the same joins, or debugging conflicting numbers in executive decks, this guide is for you.
Why Snowflake Alone Often Isn’t Enough for Analysts
Snowflake removes many technical barriers to storing and querying data. But the hardest problems analysts face are not about compute or storage - they’re about structure, reuse, and trust.
When Snowflake is used without a clear reporting layer on top, the same issues appear across almost every team:
- Analysts copy and tweak complex SQL instead of reusing governed logic.
- Metrics drift across dashboards, tools, and departments.
- Reporting pipelines depend on informal agreements between analysts and data engineers.
- AI assistants generate confident but misleading answers because they have no access to curated, governed datasets.
Let’s unpack these problems in more detail.
Ad hoc SQL doesn’t scale as a reporting strategy
Running queries directly in Snowflake worksheets or your preferred SQL editor is ideal for exploration and one-time analysis. It breaks down when those same queries become:
- Monthly revenue decks
- Always-on marketing dashboards
- Product performance reports
Within a few months, you might have:
- 10+ versions of “active users,” all slightly different
- Each is saved in a different tool, with no shared catalog or review process
- No easy way to update them when business logic changes
Common symptoms:
- Copy-paste reuse: Analysts copy queries from old notebooks, make small tweaks, and accidentally fork logic.
- Hidden assumptions: Critical business rules live only in SQL comments or people’s heads.
- Inconsistent filters: One dashboard filters out internal traffic, another doesn’t – both say “Revenue.”
This creates several issues:
- Inefficiency: Time is spent reconstructing joins and filters that already exist elsewhere.
- Hidden complexity: Business rules (e.g., “exclude internal users,” “ignore test campaigns”) live inside individual queries.
- High cognitive load: New analysts struggle to know which query is “the right one” to start from.
Snowflake happily runs all these queries. The missing piece is an analyst-owned layer that defines logic once and reuses it across tools and use cases.
The result: more time reconciling numbers and less time generating insight.
Inconsistent Metrics Across Dashboards, Teams, and Tools
When every dashboard defines its own metrics on top of Snowflake tables, inconsistency is inevitable.
You might see:
- Marketing’s weekly report shows one revenue number, while Finance’s dashboard shows another.
- Product uses a different definition of “active user” than Growth.
- Operations building Excel models off CSV exports that don’t match any BI report.
The root causes are usually:
- Metric definitions inside tools: Each BI platform encodes its own logic (calculated fields, custom measures, filters).
- Lack of central documentation: There’s no canonical place where “Revenue,” “LTV,” or “Qualified Lead” is precisely defined.
- Silent changes: An analyst updates a metric definition in one dashboard, but others keep using the old version.
Consequences include:
- Endless “Which number is correct?” debates in leadership meetings.
- Reduced trust in data, even when the underlying warehouse is rock solid.
- Slower decision-making because analysts must reconcile numbers instead of analyzing trends.
Snowflake provides consistent data; what’s missing is consistent data mart layer. Without a governed reporting layer, metrics remain fragmented.

Engineering bottlenecks slow down iteration
To avoid the chaos of ad hoc SQL and BI logic, some organizations centralize all transformations with data engineering. That improves discipline, but introduces:
- Long lead times to add or change metrics
- Backlog of “minor” analyst requests that never get prioritized
- Workarounds as analysts go back to running “temporary” SQL that quietly becomes production
You don’t need more bureaucracy; you need a way for analysts to own the reporting layer safely, while still playing nicely with engineering standards and Snowflake best practices.
Risky or Unusable AI That Ignores Your Governed Definitions
As more teams experiment with AI copilots and natural language interfaces on top of Snowflake, a new class of problems emerges.
Without a governed reporting layer, AI systems typically:
- Connect directly to raw or lightly-modeled tables in Snowflake.
- Infer relationships and metrics from schema names and ad hoc examples.
- Generate SQL that looks right but subtly contradicts your official definitions.
Examples of what can go wrong:
- An AI assistant answers, “What was our revenue last quarter?” using gross revenue, while Finance reports net revenue.
- A chatbot pulls all “active users” based on any event, ignoring your rule that only certain events count.
- AI-generated queries double-count users or orders because they don’t know about deduplication rules or surrogate keys.
Risks include:
- Hallucinated logic: The AI may invent joins or filters that have never been validated.
- Inconsistent narratives: Stakeholders get different answers depending on whether they ask an analyst, a dashboard, or an AI assistant.
- Compliance concerns: Sensitive fields may be queried or exposed without the right context or aggregation.
Snowflake gives AI great data access and performance, but it doesn’t tell AI how your business defines success. For AI to be trustworthy, it needs to sit on top of curated, governed datasets – exactly what a reusable reporting layer is designed to provide.

What a Reusable Reporting Layer Actually Looks Like
When analysts talk about a “single source of truth,” this is what they usually mean, whether they use that phrase or not. A reusable reporting layer on Snowflake has a few key characteristics:
1. Business-ready data marts, not raw tables
Analysts shouldn’t have to reason about:
- Dozens of source systems
- Low-level event schemas
- Complex join paths and deduplication rules
Instead, you work with business-ready data marts: curated tables or views organized around real-world entities and use cases, such as:
- dm_orders – one row per order, with revenue, discounts, and channel attribution
- dm_customers – one row per customer, with lifecycle stage and LTV metrics
- dm_marketing_performance – aggregated spend, impressions, and conversions
These data marts are:
- Stable: Column meanings don’t change every sprint
- Documented: You know what each field represents and how it’s derived
- Reused: The same mart feeds many dashboards, reports, and AI workflows
2. Centralized, versioned metric definitions
Metrics like “Revenue,” “Active Users,” or “Marketing ROI” should be:
- Defined once, not in every dashboard
- Stored centrally, close to the data
- Versioned, so changes are explicit and traceable
In practice, that means metrics are implemented in SQL (or a semantic layer) sitting on Snowflake, not hidden inside:
- Individual dashboards
- Spreadsheet formulas
- Notebook cells
Every tool – Looker, Power BI, Excel, or AI agents – reads from the same computed values.
3. Clear separation between raw, modeled, and reporting layers
A healthy Snowflake setup for analysts has three conceptual layers:
- Raw layer: Ingested source data, as close to the original as possible
- Modeled layer: Cleaned and conformed entities (customers, products, events)
- Reporting layer: Data marts and metric tables purpose-built for analysis
Analysts mostly live in the reporting layer. Data engineers can focus on the raw and modeled layers, maintaining pipelines and reliability. Each group knows where its responsibilities start and end.
Introducing an Analyst-Owned Control Layer on Top of Snowflake
Snowflake is the foundation. The missing piece is a control layer that analysts can own: something that sits between Snowflake and business tools, coordinating how data marts and metrics are defined, computed, and consumed.
This control layer should allow analysts to:
- Describe data marts and metrics declaratively
- Reuse logic across multiple reports and tools
- Run transformations on Snowflake efficiently
- Govern access and lineage without manual tracking
This is where OWOX Data Marts comes in.
What a Data Mart Really Is in a Modern Snowflake-Based Stack
Traditionally, a data mart was a smaller subset of a data warehouse oriented around a particular business domain (e.g., sales, finance). In a modern Snowflake-based data stack, the idea is similar – but more flexible and SQL-driven.
You can think of a data mart as an owned analysis-ready table or view, built on top of warehouse data, that encodes stable business logic for a specific use case with the following characteristics:
- Domain-focused: Centered around real entities and workflows – customers, orders, campaigns, subscriptions.
- Pre-joined and cleaned: Complex relationships and edge cases are handled once, upstream.
- Metric-rich: Contains standardized KPIs and derived fields that are ready to use in reporting.
- Reusable: The same mart can drive dozens of dashboards, ad hoc analyses, and AI queries.

Examples in a Snowflake environment might include:
- dm_marketing_performance for channel spend, conversions, and ROI
- dm_customer_lifecycle for acquisition cohorts, activity, and churn risk
- dm_subscription_revenue for MRR, ARR, and retention metrics
Instead of each analyst stitching these together in one-off SQL, the mart becomes the canonical source for its domain.
Why Analysts Should Own the Reporting Layer, Not Just Query It
Data engineers are essential for building reliable ingestion pipelines, enforcing data quality, and maintaining core models. But when every reporting change requires engineering time, your analytics practice slows to a crawl.
Analysts are closest to:
- Stakeholder questions and decision-making contexts
- Nuances of business rules and metric definitions
- The day-to-day reality of dashboards, reports, and experiments
That’s why analysts should own the reporting layer – the data marts and metrics that sit on top of Snowflake’s modeled data.
Concretely, analyst ownership means:
- Defining and evolving data marts without waiting on engineering sprints
- Encoding business logic in versioned, reviewable transformations
- Coordinating metric changes with stakeholders, then rolling them out safely
Benefits include:
- Faster iteration: New questions and experiments can be supported in days, not weeks.
- Better governance: Analysts can enforce naming conventions, documentation, and review processes close to where metrics are defined.
- Less shadow work: Fewer private spreadsheets, notebooks, and CSV exports duplicating logic.
- Clear responsibility: Engineers own ingestion and core models; analysts own reporting semantics.

This doesn’t replace engineering; it decouples responsibilities so each team can move at the right speed without tripping over the other.
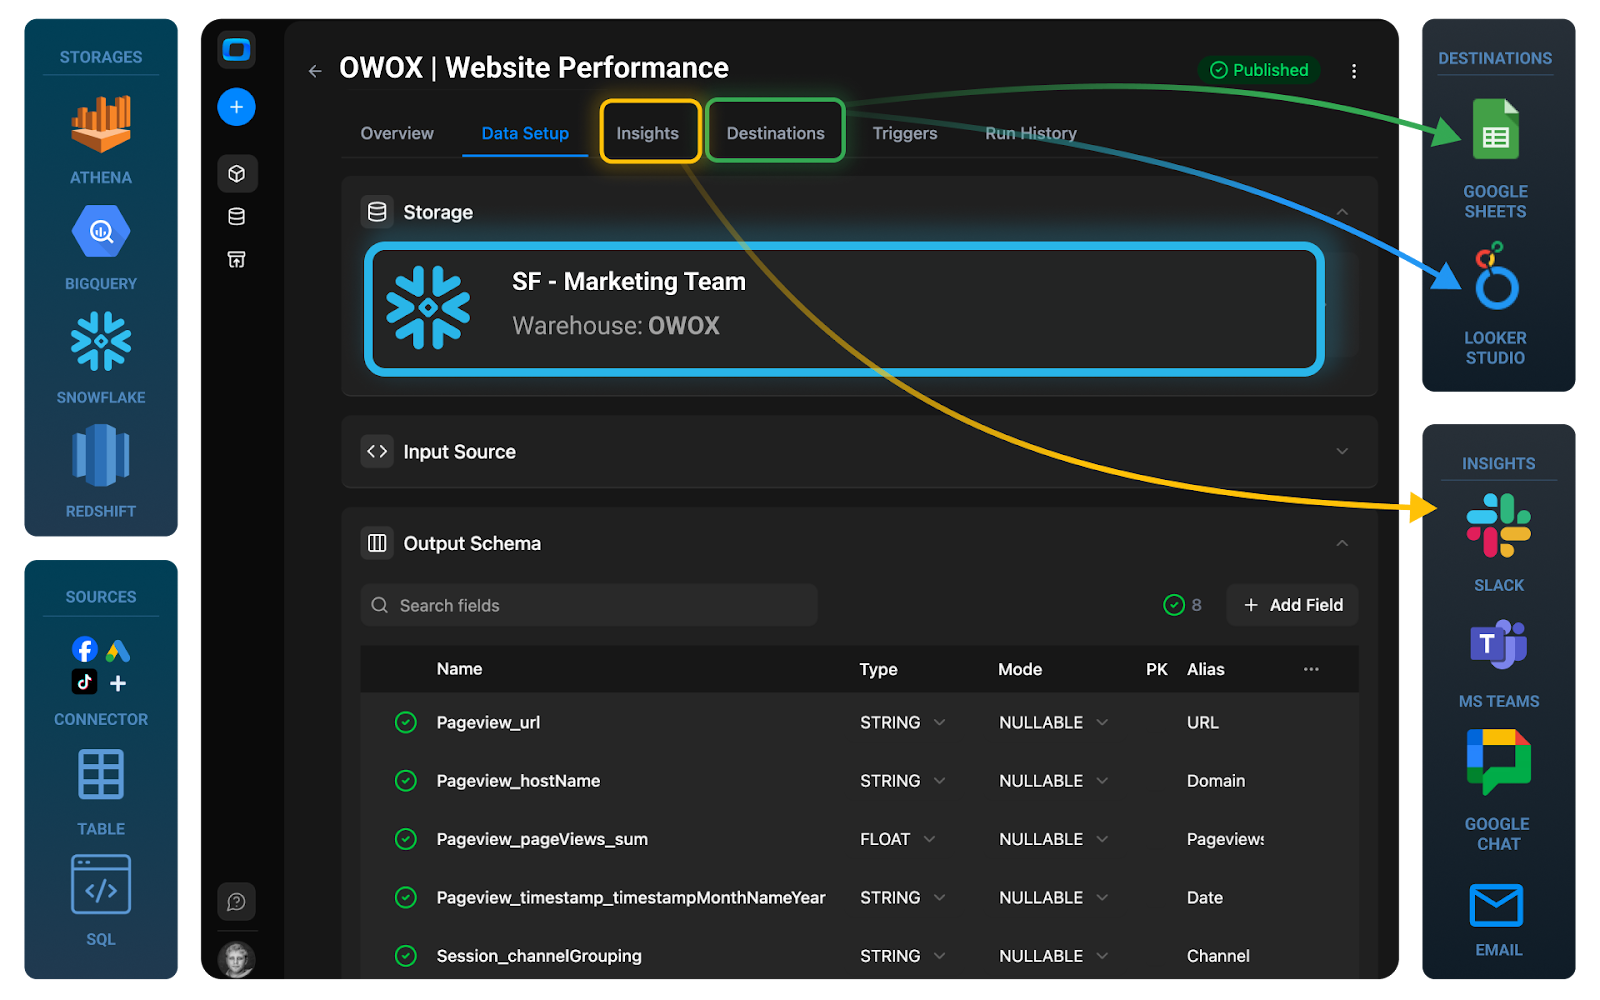
How OWOX Data Marts Turns Snowflake into a Reusable Reporting Layer
OWOX Data Marts is designed as an analyst-friendly control layer on top of your warehouse. Instead of hand-managing dozens of queries, you use OWOX to define and orchestrate your reporting layer while Snowflake does the heavy lifting.
You can:
- Build curated data marts from raw and modeled Snowflake tables
- Encapsulate business logic into reusable, tested transformations
- Expose stable, governed datasets to any downstream tool
- Iterate on metrics and schemas without breaking existing dashboards
Because OWOX Data Marts connects directly to your Snowflake account and keeps data inside your warehouse, it enhances what you already have rather than replacing it.
If you want to see how this works with your own data, you can start by connecting Snowflake and defining your first data mart in minutes.
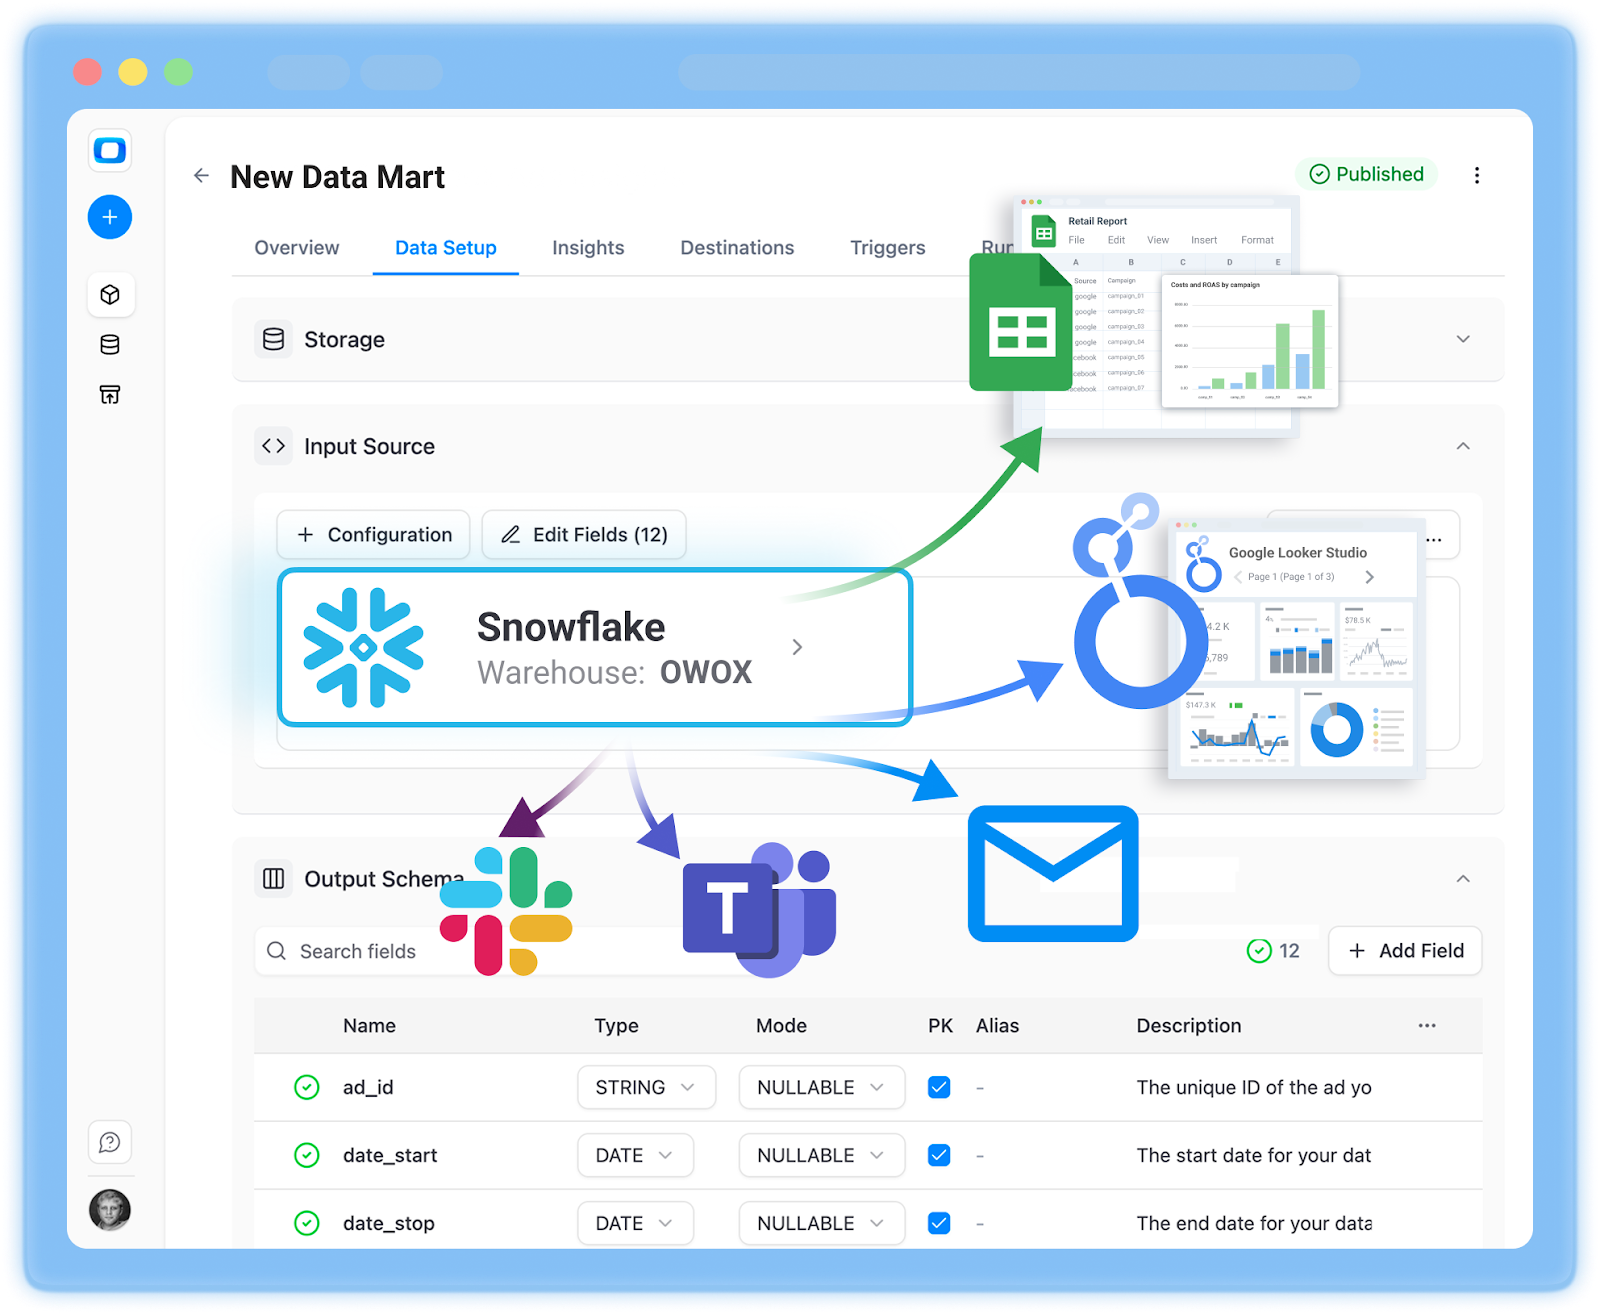
At a high level, OWOX:
1. Connects directly to your Snowflake warehouse
- Uses your existing schemas and tables as inputs.
- Keeps data inside Snowflake; OWOX orchestrates logic, Snowflake executes it.
2. Let's analysts define reusable data marts and metrics
- Curate domain-specific marts with clear, documented logic.
- Reuse joins, filters, and calculations across multiple marts.
- Version and review changes, so updates are controlled and auditable.
3. Feeds every downstream stakeholder with the same truth
- BI tools connect to the same data marts instead of raw tables.
- AI assistants and copilots can be pointed at governed datasets, not raw schemas.
With this architecture:
- Snowflake is your data platform.
- OWOX Data Marts is your analyst control layer.
- BI tools, spreadsheets, and AI interfaces become thin consumers of a shared, reliable reporting layer.
Benefits you’ll see in practice:
- One definition of each key metric is used everywhere.
- Fewer broken dashboards when upstream schemas change.
- Shorter cycle time from business question to a stable dashboard.
- Safer, more accurate AI outputs grounded in curated marts.
If you want to see how this looks with your own Snowflake environment, you can start building your first data mart in OWOX. Click here.
Turning Snowflake Data Marts Into Trusted AI Insights
AI can read schemas, generate SQL, and surface patterns faster than any human analyst. But without governed inputs, it’s just as good at producing misleading or inconsistent answers. The difference between “wow, this saves us days” and “we can’t trust this” usually comes down to what the AI is allowed to query.
On Snowflake, that choice is stark:
- Point AI at raw or lightly-modeled tables, and you get brittle, inconsistent answers.
- Point AI at curated, analyst-owned data marts, and you get explainable insights that match your dashboards and KPIs.
OWOX Data Marts is designed for the second path. By turning Snowflake into a reusable reporting layer first, you give AI a reliable substrate to operate on. AI then becomes a distribution and acceleration layer for analysis, not an alternative source of truth.
Why Classic AI on Top of Raw Snowflake Tables Often Leads to Hallucinations
When AI copilots connect directly to raw Snowflake schemas, they see column names, data types, and maybe some basic relationships, but not your business logic.
Common failure modes include:
- Wrong metrics: AI answers “What’s our churn?” by counting any account that didn’t have an event last month, ignoring how you define active customers.
- Broken joins: It joins fact tables on natural keys that look plausible but cause double-counting or data loss.
- Incorrect filters: It includes test traffic, internal users, or sandbox environments because nothing tells it not to.
- Oversimplified logic: It picks the easiest path through the schema, not the one that’s aligned with your reporting conventions.
Because language models are trained to be helpful and fluent, they’ll still produce:
- SQL that runs but encodes the wrong logic
- Narratives that sound confident but contradict official dashboards
- Visualizations built from misjoined or mis-aggregated data
You don’t just get “hallucinated” text – you get hallucinated analytics. The warehouse is fine; the AI just isn’t grounded in your governed definitions.
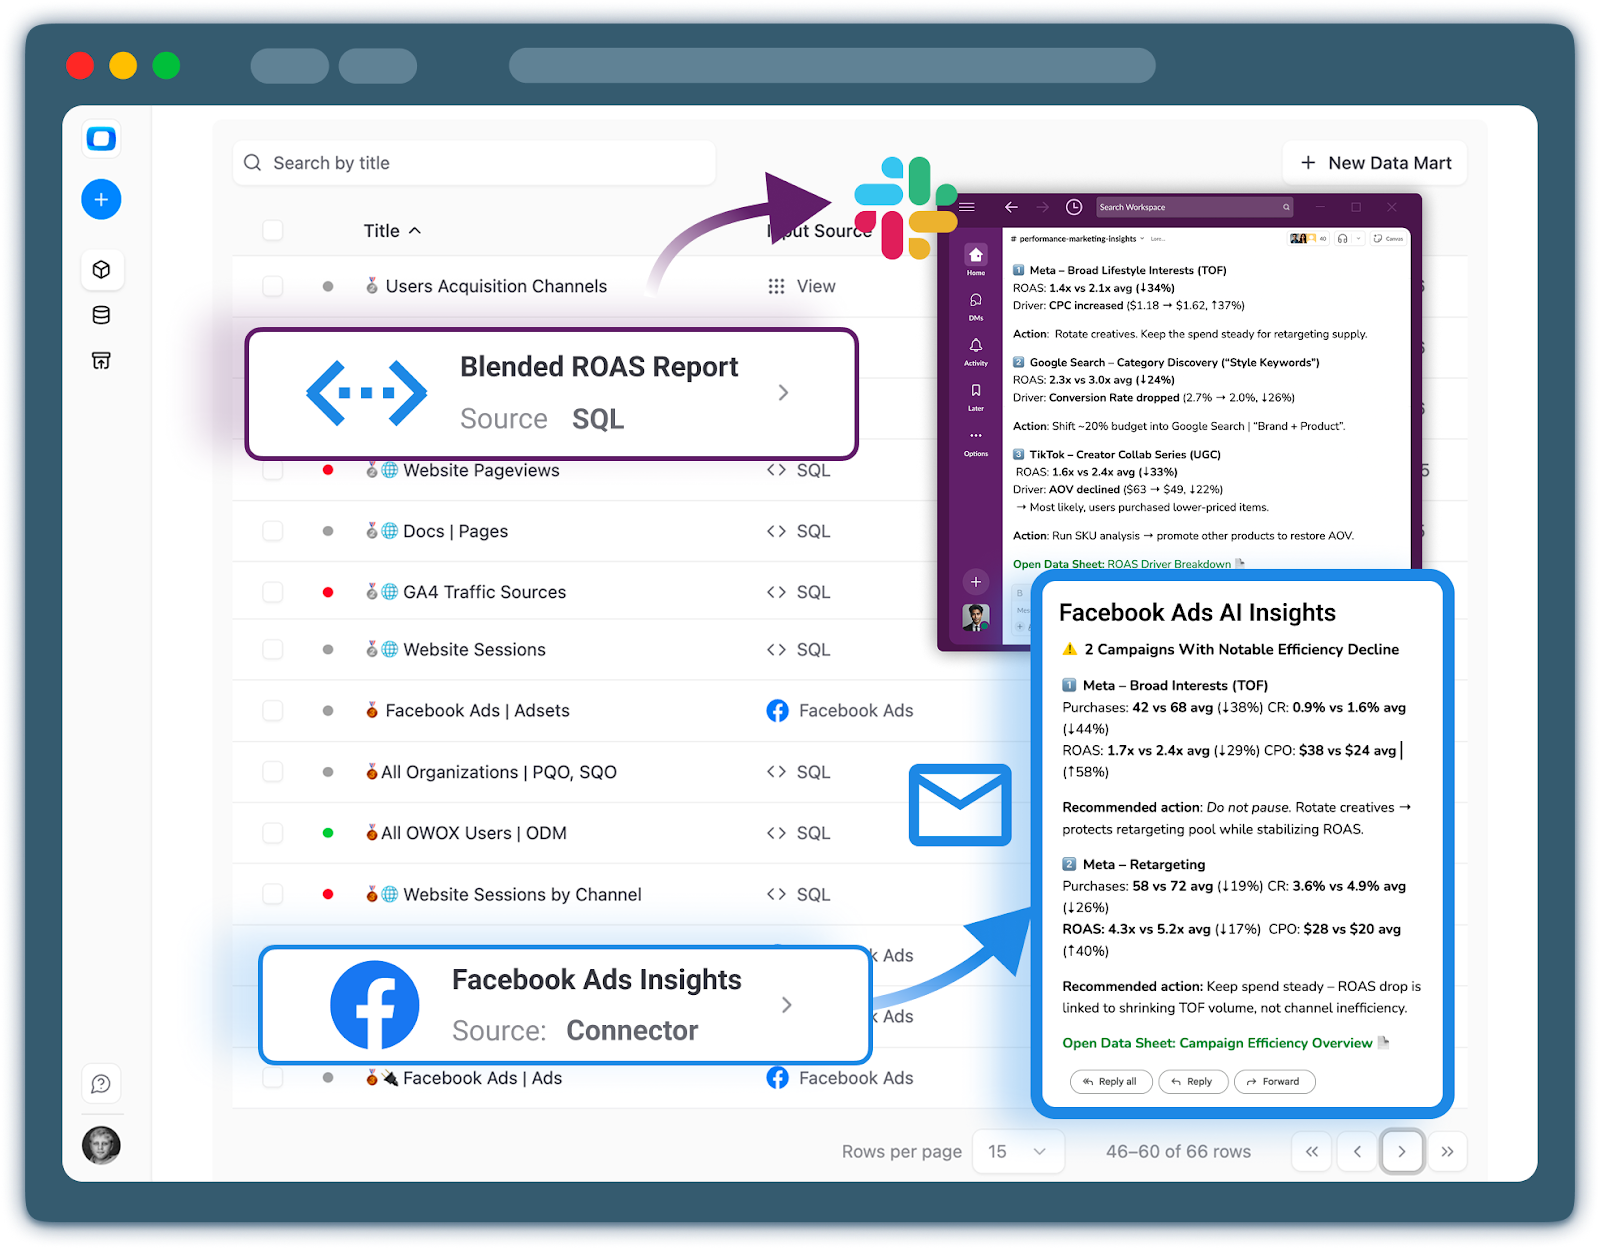
That’s how you use the Output Schema in OWOX Data Marts to give AI the right context, the business names and descriptions for every metric.
How AI Insights Uses Only Governed Data Marts and SQL-Based Results
To make AI trustworthy, you have to constrain its world to governed, analyst-defined data marts and the results derived from them. That’s the approach OWOX takes.
Instead of letting AI explore every table in Snowflake, OWOX:
- Exposes only curated data marts (e.g., dm_marketing_performance, dm_customer_lifecycle) as the analytical surface.
- Uses analyst-defined SQL and metric definitions as the primary building blocks for insights.
- Treats marts as the contract: if it’s not in a mart, AI doesn’t invent logic around it.
Workflow-wise, this looks like:
- Analysts define and govern data marts in OWOX on top of Snowflake.
- OWOX runs the SQL on Snowflake, materializing or querying marts as needed.
- AI components operate only on these marts and their query results – never on arbitrary raw tables.
- Generated narratives and explanations reference documented metrics and dimensions from the marts.
Benefits of this constrained approach:
- AI answers line up with your existing dashboards and reports.
- Every insight can be traced back to a specific mart, metric, and SQL query.
- You can evolve logic centrally (by updating marts) without retraining or reconfiguring AI.
If you’re building toward trustworthy AI on top of Snowflake, this “AI on marts, not on raw” pattern is critical – and OWOX Data Marts gives you a practical way to implement it.
Tailoring Proactive Insights by Team and Channel: Slack, Teams, Email
Once AI is grounded in governed data marts, it becomes safe – and genuinely useful – to push insights proactively to where people actually work.
Instead of stakeholders pulling data from dashboards, OWOX can:
- Monitor key data marts and metrics (e.g., conversion rate, CAC, churn risk).
- Detect significant changes, anomalies, or threshold breaches.
- Deliver concise, contextual updates to the right people via Slack, Microsoft Teams, or email.
Practical examples:
Marketing in Slack
- Daily post in #performance-marketing summarizing yesterday’s spend, conversions, and ROAS, all derived from dm_marketing_performance.
- Alerts when a specific channel’s CPA spikes beyond an agreed threshold.
Product and Growth in MS Teams
- Weekly summary of activation and retention metrics from dm_customer_lifecycle in a shared Teams channel.
- Anomalies in feature adoption are flagged with links to relevant dashboards.
Leadership via Email
- Monday morning digest of top KPIs (MRR, churn, NPS) grounded in revenue and customer lifecycle marts.
- Narrative explanations of drivers (“Churn increased due to cohort X; see attached breakdown”).
Because everything flows from the same Snowflake data marts:
- Numbers in Slack/Teams/email match what users see when they click through to BI dashboards.
- Analysts can adjust thresholds, metrics, or cohorts once in the mart, and all channels update automatically.
- AI becomes a trusted messenger of your reporting layer, not an alternative source of ad hoc calculations.
This is how Snowflake, OWOX Data Marts, and AI fit together: Snowflake as the platform, OWOX as the governed reporting and control layer, and AI as the interface that brings timely, consistent insights directly to your teams.
Frequently asked questions


Finally, a tool that doesn't ask business users to learn a new dashboarding UI. Our marketing team already knows Sheets. OWOX just delivers the right data.
Joinable data marts concept was the thing that sold us. We can now use the semantic layer without building one.
Self-hosted the OSS version on Digital Ocean. Zero vendor lock-in. Contributed a Shopify connector back in week two.