The beginner's guide to data transformation
Want to organize, blend, normalize, format large datasets and prepare for reporting with business intelligence tools? Read this guide on data transformation in the ETL process.
In today’s digital age, businesses are inundated with vast amounts of data. This data, if collected, stored and used correctly, can provide invaluable insights so businesses can act data-informed and drive business growth.
However, even if data is collected properly, they are rarely in the format that your business intelligence (BI) tools can utilize… Usually, data connectors and pipelines provide you with raw and unorganized data, so you can not extract any significant patterns from such raw data.
This is why you need to convert this raw data into a usable, business-ready format, to structure the data to match your business needs. This is where the data transformation begins.
In this guide, we will discuss data transformation from the very beginning. After reading this article, you will grow professional knowledge on data preparation and can successfully plan and execute data transformation projects.
What is data transformation?
Data transformation involves changing data from one structure or format to another, usually transitioning it from its original form in a source system to a desired form suitable for a target system. It is a crucial component of most of the data integration, data management and data preparation tasks.
Data transformation is about making raw data more accessible and valuable to businesses. Data becomes actionable BI as a result of data preparation, normalization, blending, and attribution**.**
The purpose of data transformation
The purpose of data transformation
The purpose of data transformation is to convert raw data into a meaningful and actionable format, facilitating better decision-making and insights.
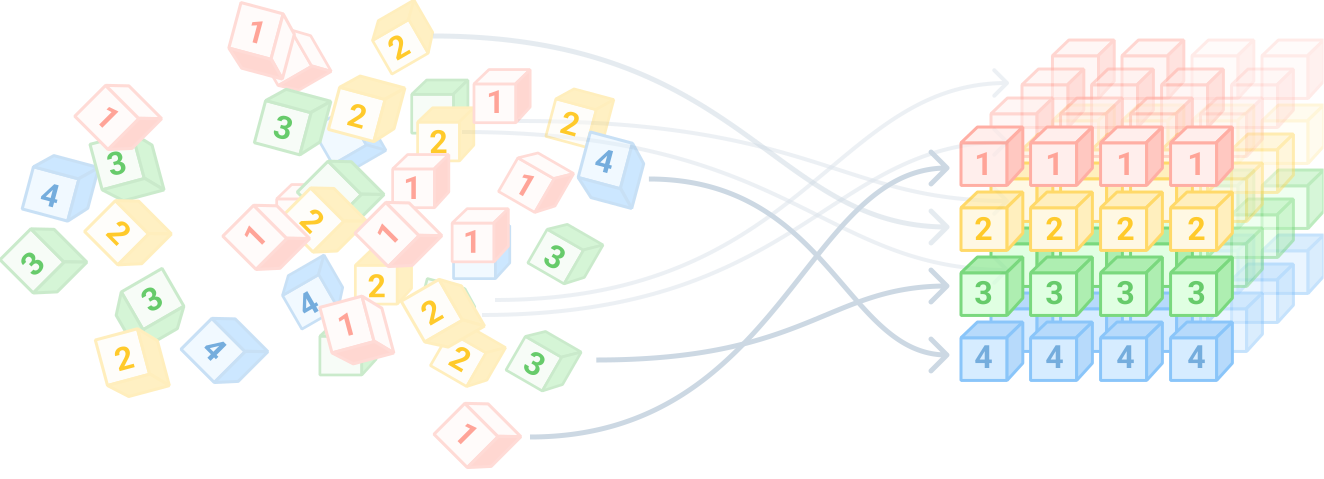
Data integration and consolidation
The main objective of data transformation is to pull data from multiple sources, modify it into a format that’s easily interpretable, and then route it to its intended destination. Data transformation refers to T from ETL (Extract, Transform, Load) process, this procedure entails gathering data from various points, reshaping it to fit a specific, required structure, and subsequently storing it in a unified database.
Compatibility between different data sources
With the rise of big data, tracking systems, ad platforms, marketing, sales or business tools, companies are dealing with data from a myriad of sources. This diverse data can pose compatibility issues.
Data transformation addresses this by converting data from any source into a standardized format, or blending data from multiple sources into the same structure.
Data quality and consistency
Data extracted from source locations can often be not usable in its original form. The transformation process adds value to this data by resolving inconsistencies, missing values, and other quality issues. This ensures that the data is consistent, reliable, and of high quality.
OWOX Data Marts
See your first report built in real time. 15 minutes.
- Connect your data warehouse
- Pick your metrics
- Get a live Google Sheets report
In the time it takes to write a ticket. Then imagine never writing that ticket again.
Book a DemoWe'll use your actual use case
5 steps of data transformation process
5 steps of data transformation process
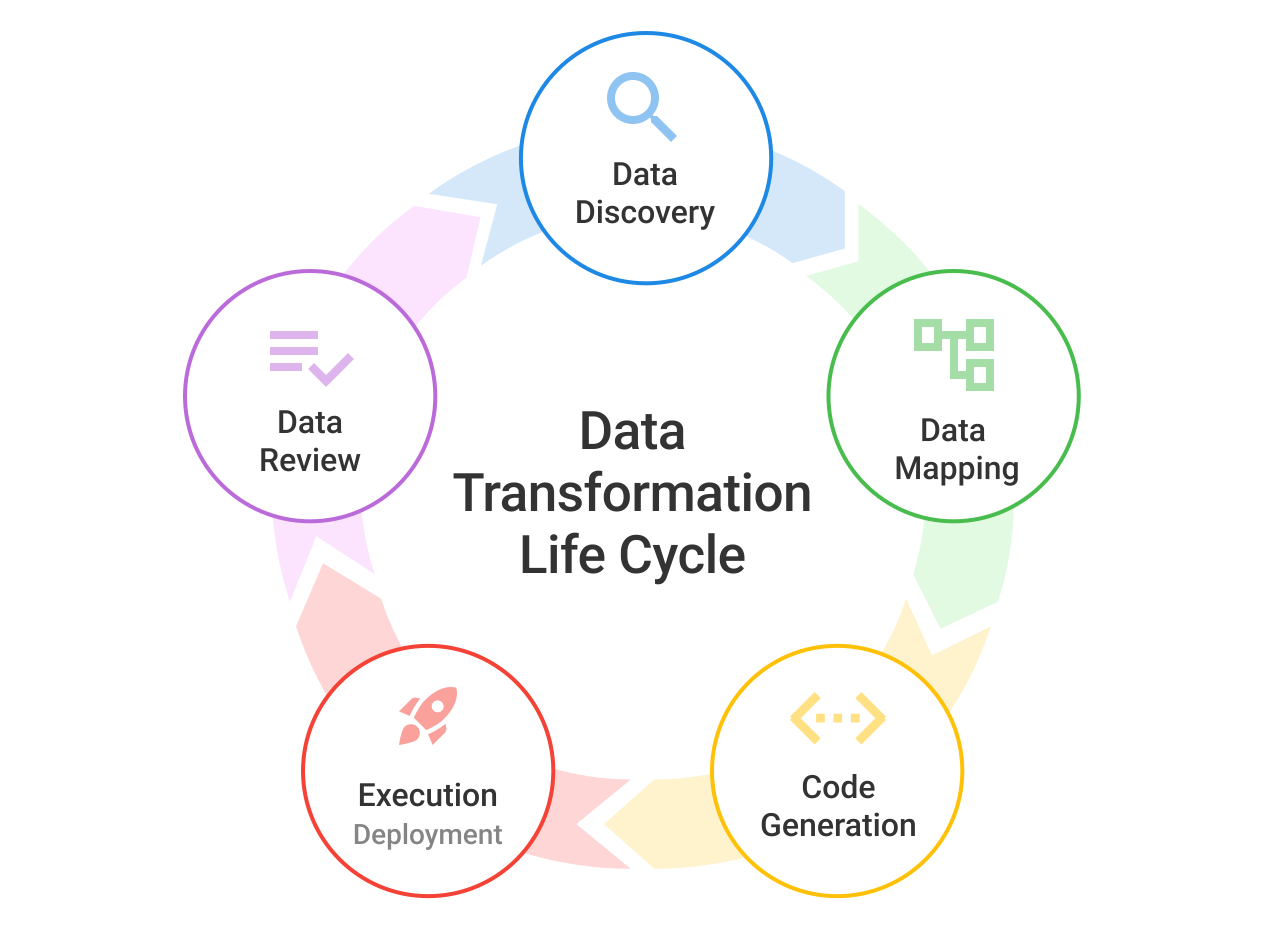
Here are the five essential steps involved in the data transformation process:
1. Data discovery
- This is the initial step in the transformation process. It involves identifying and understanding the data in its original format.
- Tools like data profiling can be employed to gain a comprehensive understanding of the data’s structure.
- This step aids in determining the necessary transformations to convert the data into the desired format.
2. Data mapping
- Data mapping is the process of defining how each field from the source data should be represented in the destination system.
- It involves specifying how data fields are mapped, joined, filtered, and modified to achieve the desired output format.
3. Code generation
- This step involves generating or developing executable code that can transform the data based on the mapping rules specified.
- The code can be in various languages such as SQL, R, or Python, and it defines the transformation logic.
4. Execution (deployment)
- Once the transformation code is generated (or template is used), it needs to be executed on the data to produce the desired output.
- This step can be tightly integrated with the transformation tool or might require separate steps for manual execution.
5. Data review
- The final step ensures that the transformed data meets the specified requirements.
- It involves checking the output data for accuracy and consistency. If any discrepancies or anomalies are detected, they are communicated to the developer or data analyst for resolution.
Methods of data transformation
Methods of data transformation
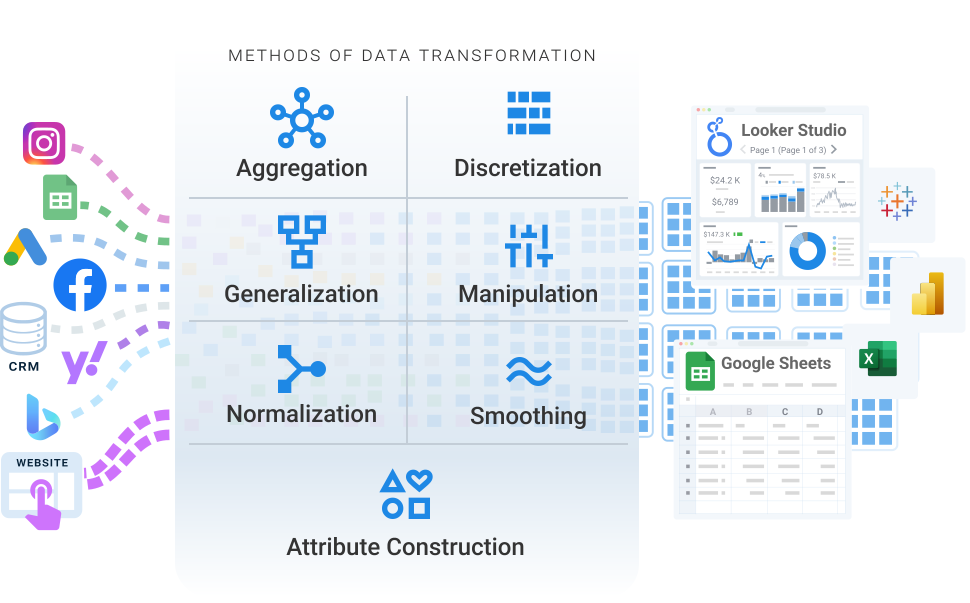
Data transformation is a fundamental process in data analytics and data management. The goal is to improve data quality, make it more accessible, and ensure it’s in the right shape for specific analytical tasks. Here are some of the primary methods used in data transformation:
Data aggregation
Data Aggregation involves collecting raw data and showcasing it in a condensed manner for statistical evaluation. This method can be used to produce statistics like average, minimum, maximum, sum, and count. By analyzing the aggregated data, insights about specific resources or resource groups can be derived after the data has been aggregated and presented in a report form.
Attribute construction
This method enhances the data mining process, making it both proficient and impactful. By deriving and introducing new attributes from the existing set, it supports the mining process, emphasizing attribute or feature development within data transformation.
Data discretization
Data discretization involves segmenting continuous data attributes into a set number of ranges and allocating specific values to these ranges. Various methods are available for discretization, ranging from simple equal-width and equal-frequency methods to more complex ones.
Data generalization
Generalization entails creating multiple layers of summarized data within an evaluation database, offering a broader perspective on a particular issue or scenario. This technique is commonly employed in Online Analytical Processing (OLAP) to swiftly address multi-dimensional analytical inquiries.
Data manipulation
Manipulation entails altering or adjusting data to enhance its clarity and structure. Analytical tools aid in detecting trends within the data, converting it into a format conducive to generating insights, whether related to financial metrics or consumer patterns.
Data normalization
Data normalization is a method that transforms original data into a format more suitable for processing. Its main objective is to minimize or remove redundant data, enhancing the performance of data mining techniques and accelerating the data retrieval process.
Data smoothing
Smoothing is a technique employed to discern patterns in data that’s cluttered with noise, especially when the exact nature of the trend isn’t evident. This approach is versatile and can be used to identify trends in diverse areas, from stock markets to economic indicators.
Types of data transformation
Data transformation is a critical process in the realm of data management and analytics. The transformation process ensures that data is clean, consistent, and ready for reporting / consumpltion by various applications or end-users. While there are several methods and techniques for data transformation, the types of data transformation can be broadly categorized based on the mode of operation. Here are the primary types:
Traditional or batch data transformation
- This is the most common type of data transformation, where data is collected over a period and then processed in batches.
- The transformation process in this type is pre-scheduled and occurs at specific intervals, such as daily, weekly, or monthly.
- Batch data transformation is suitable for large volumes of data where real-time processing is not a requirement. It’s often used in scenarios like end-of-day reporting, monthly financial closings, and periodic data backups.
- While it can handle vast amounts of data efficiently, the downside is that the transformed data might not reflect the most recent changes until the next scheduled batch process.
Interactive data transformation
- Unlike batch transformation, interactive data transformation processes data in real-time or near-real-time.
- As soon as the data is received, it is immediately transformed and made available for use. This type is particularly useful in scenarios where timely data availability is crucial.
- Interactive transformation is commonly used in applications like real-time analytics, online transaction processing systems, and live dashboards where up-to-the-minute data is essential.
- The challenge with interactive transformation is ensuring that the system can handle the continuous influx of data without delays or bottlenecks.
Tools for data transformation
Data transformation is vital for converting raw data into actionable insights. Various tools facilitate this process, ensuring data quality and compatibility. Some of the top data transformation tools include Hevo Data, Datameer, IBM InfoSphere DataStage, Informatica – PowerCenter, Matillion, SAP Data Services, Talend, Pentaho Data Integration, and CloverDX.
Where transformation logic should live
Where transformation logic should live
Whichever tool runs it, a transformation is a set of decisions written as SQL: what is filtered, how tables are joined, how a metric is calculated. Those decisions should be readable by the people who use the result. OWOX Data Marts does not transform data. It takes the SQL an analyst has written, or a table or view that a transformation produced, and publishes it as a Data Mart with a description and described fields, so that reports read one governed definition.
Reports are delivered from the warehouse where the data already is: Google BigQuery, Snowflake, AWS Redshift, AWS Athena or Databricks. For how the pieces of a reporting model fit together, see types of data models.
Turn your data into decisions.
Governed data marts give you the clean foundation ML needs to actually work.
- No AI hallucinations
- Analyst-governed definitions
- Every number traces to SQL