Board pack numbers you can defend: what the audit covers and what it doesn't
When the CFO, the board or the auditor asks whether the numbers can be defended, they are asking six questions about each figure: what it counts, where it came from, whether it is calculated the same way as the figure beside it, who can change it, whether the run worked, and how it ties to the accounts. This guide says which figures the audit opinion covers and which fall outside it, turns the six questions into an evidence file with a named reviewer, shows on demo data how one quiet definition change turns 28% growth into 7%, says what OWOX Data Marts records and what it does not, and ends with a note for the person who asked.
“Can we defend these numbers?” If the CFO, the audit committee, the auditor, an investor or a lender put that to you this week, here is the answer you can give back: a number can be defended when you can show what it counts, where it came from, and how it ties to the accounts, and when it was calculated the same way as the number it is compared with. Being correct is not enough. It has to be shown to be correct, by someone other than the person who built it.
If you asked, the last section is for you. The rest is for the analyst or finance lead who was handed the question.
The short answer
A board pack usually mixes two kinds of figure, and they are defended differently.
Figures from the ledger: revenue, gross margin, cash. They come from the accounting records behind the annual financial statements; “the audit” here means the external audit, which gives an opinion on those statements. The monthly management accounts in the pack are not audited: finance stands behind them through its month-end close. A listed group’s half-year figures are usually reviewed, which gives limited assurance, not an audit opinion (IAASB, ISRE 2410).
Operating figures from analytics: order value, conversion, customer acquisition cost, pipeline, often ARR. They come from a warehouse, a spreadsheet or a dashboard, and they fall outside the audit opinion, though the board reads them with the same trust. If one appears in the annual report, the auditor reads it as “other information”: they consider whether it is materially inconsistent with the financial statements or with what they learned in the audit, but their opinion “does not cover the other information” (ISA 720 (Revised), paragraphs 2 and 11).
They still reach the auditor. Board minutes are audit evidence (ISA 500, paragraph A8), and when evidence from one source “is inconsistent with that obtained from another”, the auditor has to follow it up (paragraph 11). A KPI in the minutes that contradicts the ledger is that. And when an auditor uses a report your company produced, say monthly sales by product, ISA 500 paragraph 9 requires them to evaluate whether it is “sufficiently reliable”, including its “accuracy and completeness” and whether it is “sufficiently precise and detailed”. They can test the report, or the controls over how it is prepared (paragraph A50). The evidence file below documents how those controls are designed; they still have to operate every period, and an auditor can test whether they did. It is a management control, the first line: internal audit, where there is one, tests whether it works, and the external audit is separate again. (We quote the edition in IFAC’s 2013 handbook. A proposed ISA 500 (Revised) was approved for exposure in June 2026 and is open for comment until 15 December 2026; no effective date is set (IAASB).)
Use the accounting words precisely
The asker will. Bookings are contracts signed in a period at their signed value; in a shop, the nearest equivalent is gross merchandise value, the value of every order placed. Recognised revenue is earned when control of a good or service passes to the customer, as each performance obligation is satisfied, “at a point in time” or “over time” (IFRS Foundation). ARR is the yearly value of subscriptions in force on a date; no accounting standard defines it, so your company does.
Order value is none of these. For goods sold with a right of return, revenue excludes the products expected to come back, which sit in a refund liability, with an asset for the goods expected to be recovered (IFRS 15, paragraphs B20–B27, IASB staff paper). Sales tax and VAT collected for the government are not revenue: IFRS 15 excludes “amounts collected on behalf of third parties” from the transaction price (paragraph 47; the IFRS for SMEs standard says the same in Section 23, paragraph 23.23). Shipping charged to the customer is usually revenue, either as part of the sale or as a separate performance obligation; if the company only arranges shipping as an agent, only its fee is revenue. The option to treat shipping as fulfilment is US GAAP, not IFRS (FASB comparison of Topic 606 and IFRS 15). And on a marketplace, a seller who never controls the goods is an agent, not a principal, so the order value is not its revenue at all (IFRS 15, B34–B36, IFRS Interpretations Committee). Finance owns the definition of revenue. Every other figure in the pack gets its own name and is reconciled to finance’s.
The six questions behind “can we defend it”
The six questions behind “can we defend it”
Ask these of every figure in the pack; the ones you cannot answer are your list of work.
| Question | What answers it | What usually goes wrong |
|---|---|---|
| What does it count? | One written sentence, approved by whoever owns the number | Two figures both called “revenue” |
| Where did it come from? | The source system, the tables and the saved query | The query lives in one person’s laptop |
| Is it calculated the same way as the figure beside it? | The same definition for every period on the page | The definition changed between quarters and nobody restated the earlier one |
| Who can change it? | A short list of people allowed to edit the calculation | Anyone with access can edit the query |
| Did it run, and on what data? | A record of when it ran, whether it succeeded and when the source data last changed | A refresh failed quietly and last month’s figure stayed on the slide |
| How does it tie to the accounts? | A reconciliation to the nearest ledger line, with an “unexplained” row | The operating figure and the ledger figure are never shown side by side |
Figures with no ledger line
Conversion, retention, a cohort’s repeat rate have nothing in the accounts to tie to. Defend them three ways. Tie the numerator and the denominator to a source count: orders to the order table, visitors to the analytics tool, customers to the customer list, on the same dates. Write the denominator down and keep it stable: sessions and users give two different conversion rates. Have a second person recalculate it from source each period.
A written standard you can borrow
ESMA’s guidelines on alternative performance measures ask that each financial measure outside the statements is defined, labelled and reconciled “to the most directly reconcilable line item” in the financial statements, and that a redefined one comes with “restated comparative figures”, without hindsight (ESMA guidelines, 2015, paragraphs 20–22, 26, 40, 41). They apply to measures in published regulated information and prospectuses (paragraph 3), not to any company’s internal board pack, and to financial measures only, not to ones such as subscriber numbers (paragraph 19). They are still the clearest written standard for what “defensible” means.
OWOX Data Marts
See your first report built in real time. 15 minutes.
- Connect your data warehouse
- Pick your metrics
- Get a live Google Sheets report
In the time it takes to write a ticket. Then imagine never writing that ticket again.
Book a DemoWe'll use your actual use case
A definition change the board would not see
A definition change the board would not see
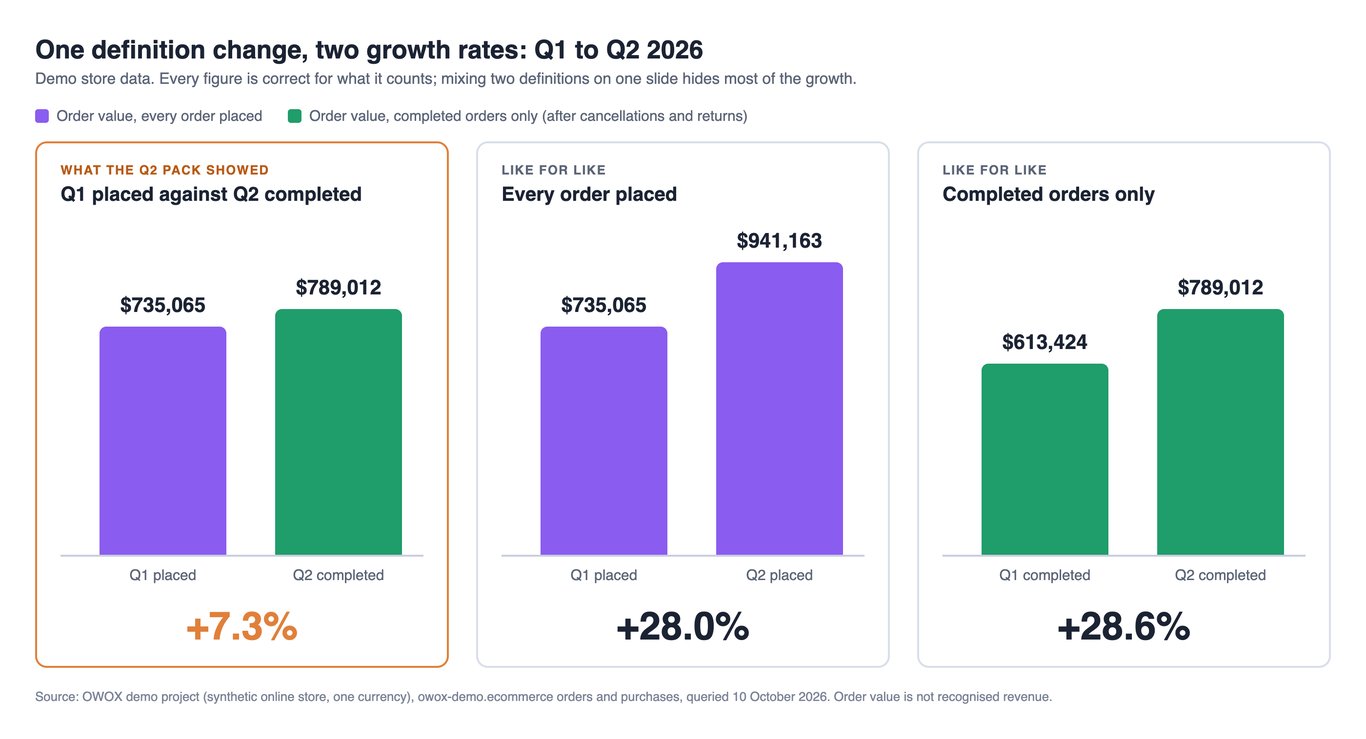
The third question, failing. The figures come from our demo project, an online store whose data sits in Google BigQuery. The demo is synthetic, small and clean: one currency, one order date and three order statuses (completed, cancelled, returned). We ran the query on 10 October 2026.
Suppose the Q1 pack reported “sales” as every order placed, and in Q2 someone, sensibly, switched to completed orders only without restating Q1.
| Q1 2026 | Q2 2026 | Change | |
|---|---|---|---|
| What the Q2 pack showed: Q1 placed, Q2 completed | $735,065 | $789,012 | +7.3% |
| Like for like, every order placed | $735,065 | $941,163 | +28.0% |
| Like for like, completed orders only | $613,424 | $789,012 | +28.6% |
The board would read 7% growth in a quarter that grew 28%. Every figure is correct for what it counts; the conclusion is wrong.
One caution. In real data the newest quarter’s completed value is not final: returns are still arriving. Compare quarters at the same age, or mark the latest one provisional. The demo has no return dates, so it cannot show this.
Neither row is revenue. The bridge from order value to gross profit for one quarter is worked line by line in why everyone in the meeting has a different number.
The query behind the table. In the demo, line_net_revenue already holds completed orders only, so it needs no status filter:
SELECT
  FORMAT_DATE('%Y-Q%Q', o.order_date)
    AS quarter,
  COUNT(DISTINCT o.order_id)
    AS orders_placed,
  ROUND(SUM(p.line_revenue))
    AS placed_value,
  COUNT(DISTINCT IF(o.status = 'Completed',
    o.order_id, NULL)) AS orders_completed,
  ROUND(SUM(p.line_net_revenue))
    AS completed_value
FROM `owox-demo.ecommerce.purchases` AS p
JOIN `owox-demo.ecommerce.orders` AS o
  ON p.order_id = o.order_id
WHERE o.order_date
  BETWEEN '2026-01-01' AND '2026-06-30'
GROUP BY quarter
ORDER BY quarter
On your own data, write the filter out, for example SUM(IF(o.status = 'Completed', p.line_revenue, 0)), and check how the status is spelled: 'Completed' and 'completed' differ, and the wrong one returns zero without an error. In the demo it gives the same totals.
The evidence file: what to keep behind each number
The evidence file: what to keep behind each number
None of this needs a new tool: one table next to the board pack, a row per figure, these columns: figure, source (ledger or analytics), definition, owner, query location, last run and data date, closed-period copy, reconciled to, unexplained amount, reviewer and date. Start with the figures the board discusses most.
- List every figure and mark where it comes from. A ledger figure is defended by finance’s close. An analytics figure needs the rest of this list.
- Write the definition as one sentence and name its owner. What is counted and excluded, which date, which system. Finance signs off any figure next to revenue. Name it so it cannot be mistaken for revenue: “completed order value”, not “sales”.
- Save the query where its changes are kept. A repository such as Git records every edit with its date and author.
- Record each run: when the figure was calculated, whether the run succeeded, and when the source data last changed.
- Keep the closed period as it was delivered. Late returns, backdated entries and reloads move last quarter if you recalculate it from live tables. Copy what you reported into a dated table that only finance can write to; a locked tab can be unlocked. If a figure has to change, restate it on purpose (recalculate the earlier periods on the new definition) and say so on the slide.
- Reconcile to the accounts every period. Put the analytics figure next to the nearest ledger line, list the reconciling items, and keep a row called “unexplained”. Agree with finance how large that row may be before it needs an explanation. Above that, it goes to the owner of the accounts before the pack goes out. A small unexplained line you can show is more convincing than a perfect match nobody can explain. A warehouse report used to pick an audit sample must agree to the ledger total first, or the population is incomplete (ISA 500, A49).
- Name a reviewer who did not build it. Each period, they rerun or recalculate the figure and check the reconciliation, keep their workings with the date, and sign the row. That signature is the “shown to be correct, by someone else” from the opening. In a small company with one analyst, the reviewer is whoever owns the accounts: the outsourced accountant or bookkeeper, a fractional CFO, or the founder.
- Separate who approves a change from who makes it. Finance, or whoever owns the definition, approves a change to a board figure before it is deployed; someone else makes it; Git and the file record both.
Keep the file where edits leave a trace, in a drive or repository with version history, for as long as finance keeps that period’s records.
A first pass in a small company is the five or so figures in the deck: a one-sentence definition, the source, the tie to the accounts and a reviewer for each, with the threshold for the unexplained row agreed with whoever owns the accounts.
What this does not do: nothing enforces it. The next figure added in a hurry will skip it.
Where OWOX Data Marts helps, and where it stops
Where OWOX Data Marts helps, and where it stops
A tool helps with steps 2 to 4. Claims below are from the product documentation, read 10 October 2026.
The definition and its owners, next to the calculation
In OWOX Data Marts, a Data Mart is defined with SQL, a table or a view in your warehouse, with a description, field descriptions and named Data Owners (the data and the schema) and Business Owners (the business requirements) (core concepts). In Google Sheets, each imported column header carries the field’s description, and the first column names the Data Mart and the latest refresh (Google Sheets destination), so the definition travels into the .
What it does not do: it does not decide the definition. Finance does.
Who can change it
A Business User cannot edit Data Marts (roles and permissions). One default to change for finance figures: a new Data Mart is “Shared for maintenance”, so other members with the Data Owner role can edit it. Turning that off keeps reporting access and removes editing for anyone who is neither an owner nor a Project Admin (ownership and sharing).
What it does not do: it controls edits inside OWOX Data Marts only. Someone with direct access to the warehouse can still change the tables underneath. Keep warehouse write access to the few people who need it, run pipelines under service accounts rather than personal ones, and review the access list periodically.
A record of what ran
Each Data Mart has a Run History with each run’s status and timestamps (table-based Data Marts); for a report that joins Data Marts it shows the SQL sent (joinable Data Marts). Every run that delivers data records when its source tables were last written to (Data Last Updated), which is not the same as the period the data covers (Data Last Updated). quality checks, such as empty table, duplicate rows, null rate, or a data freshness check on the latest timestamp in a field, keep the SQL for each check, so a reviewer can reproduce it (data quality checks).
What it does not do: a check finds an empty table or a duplicated order, not a correct calculation of the wrong definition.
What it does not keep for you
- A history of edits to the definition. Run History records runs. OWOX Data Marts’ documentation describes no version history of a Data Mart’s SQL, so keep the SQL in Git (step 3).
- Frozen closed periods, the reconciliation or the reviewer’s signature. Those stay in finance’s files (steps 5 to 7).
- A compliance stamp. No tool makes a report “audit-ready”. The auditor decides what evidence is sufficient. What a tool gives you is a record to show them.
If your question is narrower
- Sales, marketing and finance bring three revenue figures for the same quarter: why everyone in the meeting has a different number.
- You want written metric definitions without a large project: metric definitions without a semantic layer.
- You need to trace which reports a change to a source table will affect: data lineage.
For the person who asked: what you can tell the board
For the person who asked: what you can tell the board
Forwarding this? Replace the square brackets with your own figures and names. Your analyst tells you which version fits.
You asked whether we can defend the numbers in the board pack. Here is where we stand.
Two kinds of numbers. Revenue, margin and cash come from the accounts; finance stands behind them through the month-end close (the routine of checking and finalising each month’s books), and the annual statements are audited. The operating figures, [order value, conversion, acquisition cost], come from our analytics and fall outside the audit opinion. The board reads them with the same trust, so we are putting them through the same questions.
What “defensible” will mean here. For every figure: a written definition, an owner, the saved calculation, a record that it ran, the closed quarter kept as reported, a reconciliation to the accounts, and a second person who checks and signs it each quarter.
Version A, what we checked and what is still open. Checked: [figures], each reconciled to the accounts, unexplained difference under [the threshold agreed with finance]. Still open: [figures], which have no written definition yet; ready by [date].
Version B, what we found. [Last quarter’s “sales” and this quarter’s “sales” were not calculated the same way. Like for like, growth was [x]%, not the [y]% on the slide.] We will restate it in the next pack, recalculating last quarter on the same definition, and say so.
What only you can decide. Which definitions we use (finance sets revenue; please approve the list, one sentence each, by [date]); which figures go in the pack at all; and that a change to how a board figure is calculated is approved first and earlier periods restated, never changed quietly.
What it costs. Nothing to buy for the first pass. It costs [analyst]’s time to build the file and a reviewer’s and finance’s time each quarter.
What not to expect. The operating figures will not all agree with the accounts; order value is not revenue. What changes is that every difference has a name and a line.
If an investor or lender asked how the KPIs are produced. A short reply you can send: “Our revenue, margin and cash figures come from our accounts, [prepared by our accountant / audited by X]. Our operating KPIs come from our order and analytics data. Each has a written definition, a saved calculation and an owner, and each period [name] checks it and ties it to the accounts where a matching line exists, with any difference listed. We can share the definitions and the latest reconciliation.” Send only what is true today.
One question to ask in the next meeting: “Which figure is this, who owns it, and how does it tie to the accounts?” When that has a quick answer for every number on the page, the pack can be defended.
Turn your data into decisions.
Governed data marts give you the clean foundation ML needs to actually work.
- No AI hallucinations
- Analyst-governed definitions
- Every number traces to SQL
Frequently Asked Questions
Does the external auditor audit the KPIs in our board pack?
Not as such. An external audit gives an opinion on the financial statements, which are built from the accounting records. Operating figures in a board pack, such as order value, conversion or ARR, are management information. They still matter to the audit when the auditor uses a report the company produced: the auditor has to evaluate whether that information is sufficiently reliable, including its accuracy and completeness (ISA 500, paragraph 9). Listed companies in the EU must also define the operating measures they publish and reconcile them to the financial statements (ESMA guidelines on alternative performance measures).
What is the difference between bookings, recognised revenue and ARR?
Bookings are contracts signed in a period at their signed value. Recognised revenue is what has been earned: under IFRS 15 a company recognises revenue as it transfers the promised goods or services, at a point in time or over time (IFRS Foundation). ARR, annual recurring revenue, is the yearly value of the subscriptions in force on a date. No accounting standard defines ARR, so each company writes its own definition. Finance owns all three.
Is order value the same as revenue?
No. Order value is what customers ordered. Revenue is recognised when control of the goods passes to the customer, as each performance obligation is satisfied (IFRS Foundation). For goods sold with a right of return, the products expected to come back are left out of revenue and held as a refund liability, with an asset for the goods expected to be recovered (IASB staff paper). Sales tax and VAT collected for the government are not revenue: IFRS 15 paragraph 47 excludes amounts collected on behalf of third parties, and the IFRS for SMEs standard says the same in Section 23, paragraph 23.23. Shipping charged to the customer is usually revenue, either as part of the sale or as a separate performance obligation; if the company only arranges shipping as an agent, only its fee is revenue. On a marketplace, a seller that never controls the goods is an agent, so the order value is not its revenue at all (IFRS Interpretations Committee). Report order value under its own name and reconcile it to finance's revenue line by line. A worked bridge from order value to gross profit on demo data is in why everyone in the meeting has a different number.
What should we do when a metric definition changes between quarters?
Say so, and restate the earlier periods on the new definition so the comparison is like for like. ESMA's guidelines for listed companies ask that a redefined measure comes with an explanation and restated comparative figures, without using hindsight (ESMA guidelines, paragraphs 40 and 41). In our demo data, comparing one quarter's placed order value with the next quarter's completed order value shows 7.3% growth; like for like, it was 28%.
Does OWOX Data Marts make reports audit-ready?
No tool does; the auditor decides what evidence is sufficient. OWOX Data Marts keeps a record you can show: each Data Mart's description, field descriptions and named Data Owners and Business Owners (core concepts), who may edit it (roles and permissions), and a Run History of runs and data quality check results (data quality checks). Its documentation describes no version history of a Data Mart's SQL, and it does not freeze closed periods or reconcile to your ledger, so keep the query in Git and the closed-period copies and the reconciliation in finance's files.