Everyone in the meeting has a different number: how to get one source of truth
Teams bring different numbers because each one counts something different, and nobody wrote down which. This guide closes the gap line by line on one quarter of demo data, gives you five steps for this week that need no new tool, shows where the written definition can live, and ends with a one-page summary to forward to the person who asked.
“Why does everyone in this meeting have a different number?” If that question was put to you this week, here is the answer you can give back: nobody’s number is wrong. Each one counts something different, and nobody wrote down which.
If you are the person who asked, the last section is written for you: one page, in plain words, including the one thing only you can do. The rest is for whoever was handed the question. It shows the gap closed line by line on real figures, what to do this week with what you already have, and where a tool helps and where it does not.
The short answer
A single source of truth is not a database and not a dashboard. It is three things: one written definition for each number, one named person who owns it, and one place every report reads it from. Storing all the data in one system does not give you that. Three teams can query the same tables three ways and still bring three figures.
The meeting usually looks like this. The agency shows sales and a return on ad spend from the ad platform, marketing a chart from the analytics tool, and finance the management accounts, where revenue is lower than both. Each figure is correct for what it counts. The argument is about the total, while the difference sits in a few lines that nobody has listed.
So the work is to list the lines. You cannot reconcile two numbers. You can only reconcile two definitions.
One quarter, three numbers: the reconciliation line by line
One quarter, three numbers: the reconciliation line by line
Here is what listing the lines looks like. The figures come from our demo project, an online store whose data sits in Google BigQuery. A data warehouse, such as BigQuery, is the database a company keeps its combined business data in. The period is the third quarter of 2026, and we ran the query on 10 October 2026.
| Line | Orders | Amount |
|---|---|---|
| Booked order value: every order placed | 1,942 | $998,141 |
| Minus cancelled orders | 182 | −$87,926 |
| Minus returned orders | 108 | −$61,038 |
| Net order value: completed orders | 1,652 | $849,177 |
| Minus the product cost of those orders | −$311,722 | |
| Gross profit, before other costs of sale | $537,455 |
Amounts are order-line values as the demo stores them, sale price times quantity. The demo has no tax or shipping fields, so neither is included or excluded.
Two people can bring $998,141 and $849,177 as “Q3 sales” and both be right: the first is everything booked, the second is what was kept after cancellations and returns. The gap between them is 290 orders, and it takes two lines to explain. A third person may bring $537,455, which is not sales at all but margin. In a real company, cost of sales also includes freight, duties and delivery, so gross profit is lower again.
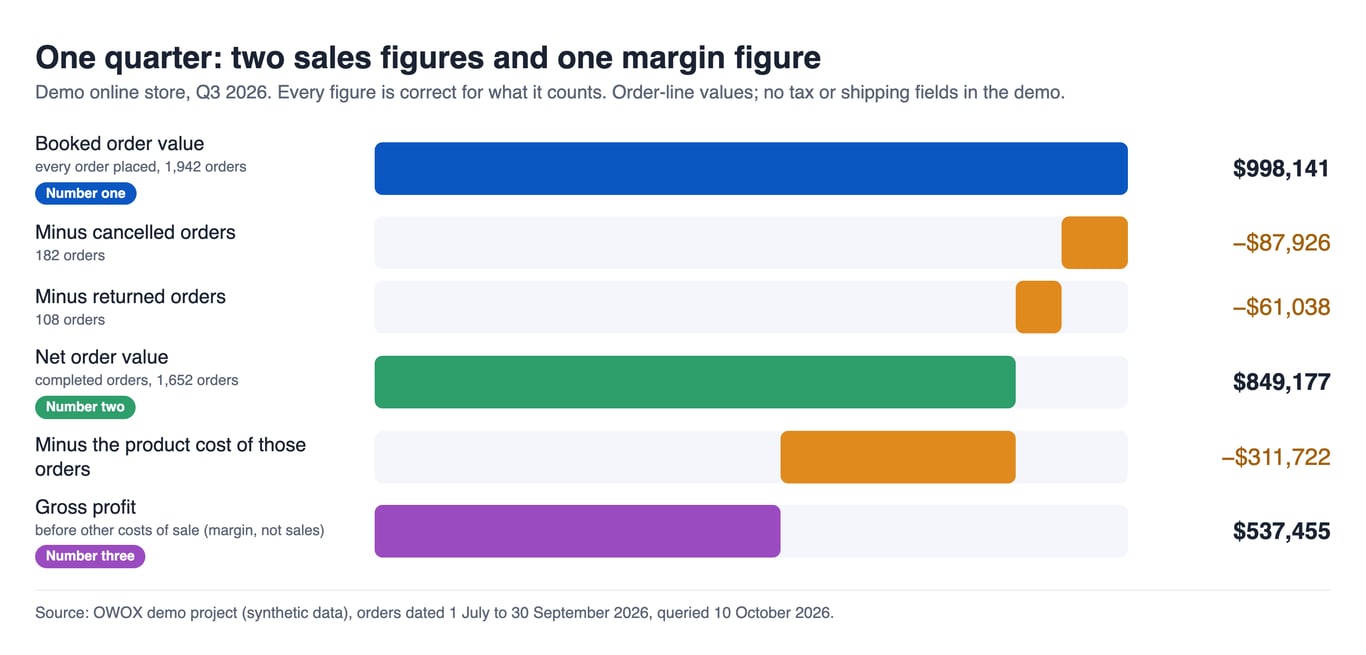
The bridge is not finished until it ends at the revenue in the management accounts. Order value is not recognised revenue. In a real company, the lines between the last order figure and the ledger are usually deposits and other deferred income, the returns provision and late returns, tax and shipping. Finance reconciles those, and that step is what settles the argument. Our demo has no ledger, so this article cannot show that last step: the bridge above stops at gross profit.
This is the query behind the table. SQL is the language used to ask a database for data; you do not need to read it to follow the rest. It is printed so your analyst can see exactly what each line counts, and run the same shape of query on your own orders.
SELECT
  o.status,
  COUNT(DISTINCT o.order_id) AS orders,
  ROUND(SUM(p.line_revenue)) AS gross,
  ROUND(SUM(p.line_net_revenue)) AS net,
  ROUND(SUM(p.line_net_cost)) AS cost,
  ROUND(SUM(p.line_net_profit)) AS profit
FROM `owox-demo.ecommerce.purchases` AS p
JOIN `owox-demo.ecommerce.orders` AS o
  ON p.order_id = o.order_id
WHERE o.order_date
  BETWEEN '2026-07-01' AND '2026-09-30'
GROUP BY ROLLUP (o.status)
ORDER BY gross DESC
The demo is small and clean, and your data will not be. It is synthetic. It has one currency, one order date and three order statuses. A real company’s bridge has more lines, and they are usually these:
- Timing. One team dates a sale when the order was placed, another when it was delivered, another when the money arrived, and a deposit is income only when the goods are handed over. Shopify’s own sales reports count a return as a negative sale on the date the return was processed, not the date the order was placed, so a quarter’s returns can belong to last quarter’s orders (Shopify Help Center, read October 2026). Check how your own store platform, WooCommerce or another, dates them.
- Tax, shipping and discounts. Included in one figure and left out of another. In Shopify, net sales are gross sales minus discounts and returns, while total sales add taxes, duties, shipping and fees back on: three figures from one report.
- Currency. Converted at the day’s rate in one report and at a monthly rate in the other.
- Test and internal orders. Everyone agrees they should be excluded. Not every report excludes them.
- Who gets the credit. That case needs its own method, below.
None of these is a data error. Each is a decision somebody once made.
When one figure comes from an ad platform: the overlap, run on the demo
An ad platform’s figure is not a subset of your orders. It counts conversions by its own rules, and some of them never appear in your order table. So you do not subtract it; you compare it on the overlap. Match the orders the platform claims to your order IDs, bridge that part line by line, and treat the rest as attribution (why Facebook Ads and GA4 report different numbers).
We ran that rule on the same demo quarter on 12 October 2026. Five of the demo’s ad platforms report a purchase value of their own. “Platform says” is that value. The three shop columns are the orders the shop itself recorded from that platform’s paid visits.
| Platform | Ad spend | Platform says | Shop: booked | Shop: net | Shop: gross profit |
|---|---|---|---|---|---|
| $15,416 | $138,653 | $78,505 | $66,467 | $41,559 | |
| Bing | $8,878 | $48,138 | $52,215 | $42,014 | $26,361 |
| $8,650 | $48,969 | $44,822 | $40,685 | $25,877 | |
| $4,112 | $5,464 | $3,725 | $2,059 | $1,339 | |
| $1,538 | $11,125 | $9,495 | $7,300 | $4,672 | |
| Total | $38,594 | $252,349 | $188,762 | $158,525 | $99,808 |
What the run showed:
- The unmatched remainder is $63,587 net, and one platform accounts for most of it. The platforms claim $252,349; the shop booked $188,762 from their visits. Four platforms claim $67,664 more than the shop booked, $60,148 of it Facebook, which claims 1.8 times its booked orders; Bing claims $4,077 less. That remainder is the attribution line. The bridge can size it; it cannot explain it.
- Return on ad spend, three ways on the same $38,594: 6.54 on what the platforms say, 4.11 on net order value, 2.59 on gross profit.
- The ranking changes with the base. On its own figure Facebook is the best platform at 8.99. On net order value it is 4.31, behind Reddit (4.75), Bing (4.73) and Google (4.70), and on gross profit it is 2.70, behind the same three (3.04, 2.97, 2.99). LinkedIn goes from 1.33 to 0.50.
How strong this is: one quarter of synthetic demo data. The demo’s platform tables hold daily totals with no order ID, so the overlap here is by platform and period, not order by order; with order IDs you would match row by row. TikTok and X are left out because their demo tables carry no purchase value. The shop side credits an order to the visit it was placed in.
WITH claimed AS (
  SELECT 'facebook' AS source,
    SUM(spend) AS spend,
    SUM(CAST(JSON_VALUE(
      conversion_values, '$[0].value')
      AS FLOAT64)) AS claimed
  FROM `owox-demo.ads_owox.facebook_ads_ad_account_insights`
  WHERE date_start
    BETWEEN '2026-07-01' AND '2026-09-30'
  UNION ALL
  SELECT 'google', SUM(cost_micros) / 1e6,
    SUM(conversions_value)
  FROM `owox-demo.ads_owox.google_ads_ad_groups_stats`
  WHERE CAST(date AS DATE)
    BETWEEN '2026-07-01' AND '2026-09-30'
  UNION ALL
  SELECT 'bing', SUM(Spend), SUM(Revenue)
  FROM `owox-demo.ads_owox.microsoft_ads_ad_performance_report`
  WHERE TimePeriod
    BETWEEN '2026-07-01' AND '2026-09-30'
  UNION ALL
  SELECT 'reddit', SUM(spend) / 1e6,
    SUM(conversion_purchase_total_value)
  FROM `owox-demo.ads_owox.reddit_ads_report`
  WHERE date
    BETWEEN '2026-07-01' AND '2026-09-30'
  UNION ALL
  SELECT 'linkedin', SUM(costInUsd),
    SUM(conversionValueInLocalCurrency)
  FROM `owox-demo.ads_owox.linkedin_ads_ad_analytics`
  WHERE dateRangeStart
    BETWEEN '2026-07-01' AND '2026-09-30'
),
shop AS (
  SELECT s.source,
    COUNT(DISTINCT o.order_id) AS orders,
    SUM(p.line_revenue) AS booked,
    SUM(p.line_net_revenue) AS net,
    SUM(p.line_net_profit) AS gross_profit
  FROM `owox-demo.ecommerce.orders` AS o
  JOIN `owox-demo.ecommerce.purchases` AS p
    ON p.order_id = o.order_id
  JOIN `owox-demo.ecommerce.sessions` AS s
    ON s.session_id = o.session_id
  JOIN `owox-demo.ecommerce.traffic_sources` AS t
    ON t.traffic_source_id = s.traffic_source_id
  WHERE o.order_date
    BETWEEN '2026-07-01' AND '2026-09-30'
    AND t.is_paid
  GROUP BY s.source
)
SELECT c.source,
  ROUND(c.spend) AS spend,
  ROUND(c.claimed) AS claimed,
  sh.orders,
  ROUND(sh.booked) AS booked,
  ROUND(sh.net) AS net,
  ROUND(sh.gross_profit) AS gross_profit,
  ROUND(c.claimed / c.spend, 2)
    AS roas_claimed,
  ROUND(sh.net / c.spend, 2) AS roas_net,
  ROUND(sh.gross_profit / c.spend, 2)
    AS roas_gross_profit
FROM claimed AS c
JOIN shop AS sh USING (source)
ORDER BY spend DESC
Give each ratio its own name, as you would each revenue figure. How marketing’s figure bridges to finance’s, line by line, is in one pipeline number for sales, marketing and finance.
OWOX Data Marts
See your first report built in real time. 15 minutes.
- Connect your data warehouse
- Pick your metrics
- Get a live Google Sheets report
In the time it takes to write a ticket. Then imagine never writing that ticket again.
Book a DemoWe'll use your actual use case
What you can do this week, with what you already have
What you can do this week, with what you already have
None of this needs a new tool. It needs one number, one period and a few conversations.
- Pick one number and one closed period. Revenue for last month or last quarter, after month-end close, so finance’s figure will not move under you.
- Collect each team’s figure and how it was produced. The export, the filter, the saved query or the spreadsheet formula. Ask “what does this count?”, not “who is right?”.
- Build a bridge, like the table above. Start from the largest order figure and subtract line by line until you reach finance’s revenue. Platform figures go on the overlap, as above. Whatever is left unexplained is the real finding.
- Write each definition as one sentence. What is counted, what is excluded, which date applies, which system it comes from. Then give the numbers different names: “booked order value” and “net order value”, never two things both called “revenue”.
- Put the sentences where people already look, and name an owner. Finance owns revenue and its definition. Every other figure gets its own name, its own owner, marketing for ad spend and leads, and is reconciled to finance’s revenue. A wiki page, the first tab of the shared spreadsheet or a comment at the top of the saved query will do.
What this does not do: nothing enforces it. A page of definitions holds only while people follow it. The next report built in a hurry will count its own way, and the page will not know.
Where the definition should live
Where the definition should live
A written definition drifts when it sits apart from the calculation. Each step below starts with what you can do without a new tool, then says what OWOX Data Marts adds, then what it does not do. If you are not technical, you can skip to “What a single source of truth will not fix”: this part is about tools.
One written definition per number
Without a tool: keep the sentence next to the calculation, in the same file or the same query.
With OWOX Data Marts: an analyst defines a Data Mart, a dataset built on a table, a view or a SQL query in your warehouse, with descriptions for its fields and named owners (core concepts). Together, the Data Marts and the declared links between them form your model. In the demo, the description says which order statuses each field counts. Those are the demo’s own words; in a real company, finance writes that sentence.
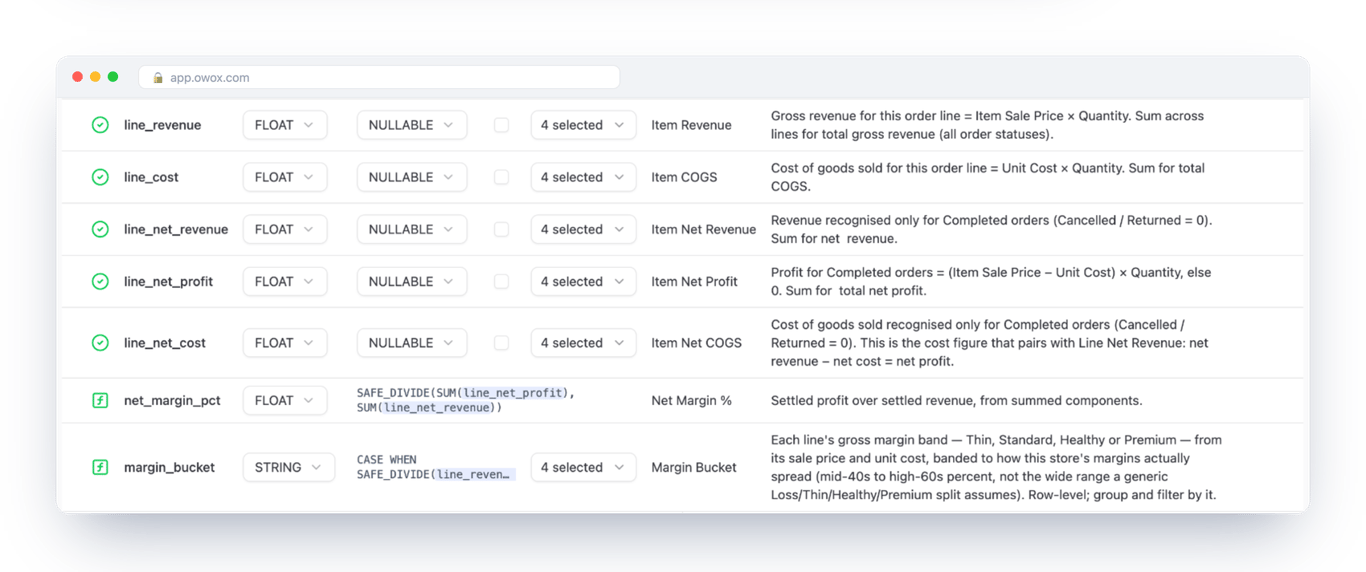
What it does not do: it does not write or pick the definition, and it does not clean your data. Its quality checks catch empty, duplicate, missing and stale data (the list of checks), not a business rule that is wrong.
One place every report reads from
Without a tool: agree on one saved query or one view, and build every report from it.
With OWOX Data Marts: a report delivers a Data Mart to the tool people already use, such as a , Data Studio (the name Google now uses for Looker Studio) or a chat channel (destinations). The data goes from its sources into your warehouse and from there to the sheet. The person who opens it chooses columns and filters, not how net order value is calculated.
What it does not do: it has no say over reports built elsewhere. The agency’s slides will keep showing their own figures; you have a written line to hold them against.
Asking in a chat instead of waiting for a report
Without a tool: the question waits for the analyst.
With OWOX Data Marts: the MCP server, part of OWOX Data Marts Cloud, lets an assistant such as Claude or ChatGPT query only the published Data Marts. It “cannot run arbitrary SQL”, and every query is recorded with the SQL that ran (OWOX documentation, read October 2026).
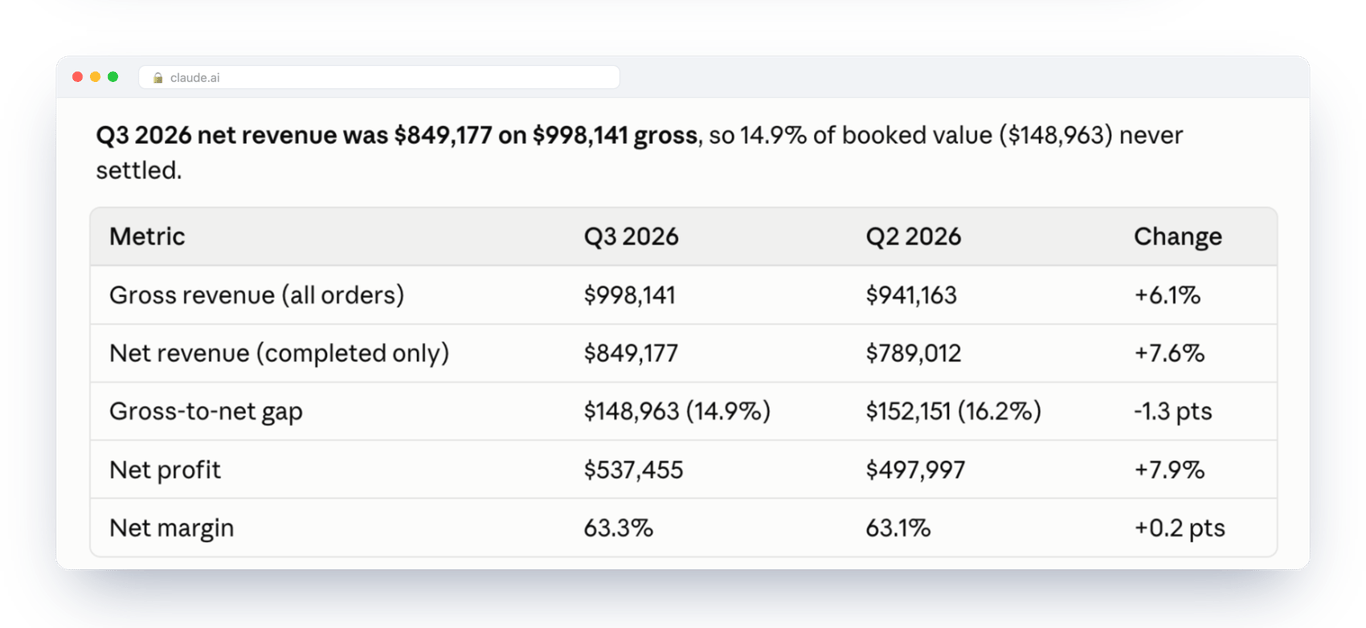
What it does not do, and one result that did not go our way. The rows in each answer go to the company behind the assistant, Anthropic for Claude or OpenAI for ChatGPT, so decide first whether that is acceptable. Asked the same question three ways, the assistant matched both figures to the dollar, but chose which to say first: net for “revenue”, gross for the “top line”. The full test is in governed AI analytics on BigQuery.
If you already run dbt, a semantic layer or a BI tool
A Data Mart can point at an existing table or view (view-based Data Marts), so it sits on top of dbt models (dbt builds tables with SQL). If another layer already holds your field meanings, it is a second copy to keep in step.
What a single source of truth will not fix
What a single source of truth will not fix
- It does not end disagreement. People still argue about what to do. They stop arguing about what the number means.
- It does not make source systems agree. The table above sizes the gap between a platform and the shop; it does not close it.
- It does not shorten the conversation or remove the analyst. Someone accountable writes each definition and stands behind it. No tool does that part.
Pürblack, a premium wellness brand, is a public example of the order of work: definitions first, questions second. Their story is in their own words.
If your question is narrower
- The report arrives late and is contradicted by the next one: conflicting numbers in reports.
- Marketing needs reports that finance will not dispute: marketing reporting nobody can argue with.
- You want people to answer their own questions without creating new versions of each number: governed self-service analytics.
- You want written metric definitions without a large project: metric definitions without a semantic layer.
- You are the founder and want to ask the business directly: who do you ask about your data?
For the person who asked: the one-page version
For the person who asked: the one-page version
Forwarding this? Replace the figures in square brackets with your own.
You asked why everyone has a different number. Here is the answer without the working.
Nobody is lying to you. Last quarter has at least two honest sales figures: [$998,141] for every order placed and [$849,177] after cancellations and returns. A third, [$537,455], is margin, not sales. The revenue in the management accounts is different again, and it is the one the others have to reconcile to.
The agency’s number. Return on ad spend is [6.54] on what the ad platforms say they earned. On the same spend it is [4.11] on net order value and [2.59] on gross profit.
The fix is not another dashboard. It is one written sentence for each number you run the company on, one person who owns that sentence, and one place every report takes it from. Finance owns revenue. Every other figure gets its own name and is reconciled to finance’s.
What only you can do. Put finance, marketing and your analyst in one room. Marketing has to be there: the platform figures are its to explain, and it is the team most likely to reject an agreement made without it. Finance sets the definition of revenue; marketing and sales name their own figures and show how they reconcile to it, on a closed month. Then say it out loud: this is the one we use here.
What it costs, and what you will be asked for. Nothing to buy for the first step. It costs your analyst’s time to collect each team’s figure and build the bridge, more when more systems are involved, and one meeting of finance’s and marketing’s time. Your analyst will ask you for that meeting, and for the authority to name one owner for each number.
Until then. Ask for the figures side by side, each with its name, and the bridge between them.
What to expect. When the figures are lined up for the first time, part of the gap will not be explained yet. Whatever is left unexplained is the first thing to investigate.
What not to expect. No tool makes the numbers agree by itself. People will keep disagreeing about what to do, and they should.
One question to ask in the next meeting: “Which revenue is this, and where is it written down?” When that has a quick answer, you have stopped asking who is right and started asking where to look.
Turn your data into decisions.
Governed data marts give you the clean foundation ML needs to actually work.
- No AI hallucinations
- Analyst-governed definitions
- Every number traces to SQL
Frequently Asked Questions
What is a single source of truth for business data?
A single source of truth is one written definition for each number the company runs on, one named person who owns that definition, and one place every report reads it from. It is not a database and not a dashboard: three teams can query the same tables three ways and still bring three figures.
Why do sales, marketing and finance report different revenue numbers?
Because each counts something different under the same word. One figure is every order placed, another is what remains after cancellations and returns, another is dated by delivery or by when the money arrived. In the worked example, one quarter of a demo store gives $998,141 booked and $849,177 net order value, both correct for what they count. Finance's revenue in the management accounts is the figure the others are reconciled to.
Is a data warehouse a single source of truth?
No. A data warehouse gives every team the same rows. It does not say which rows count. Two correct queries over the same tables return different revenue if one includes cancelled orders and the other does not. The source of truth is the written definition, wherever it is kept.
Do we need a new tool to get a single source of truth?
Not to start. Pick one number and one closed period, collect each team's figure, list the lines between the largest and the smallest, write each definition as one sentence and name an owner. A tool helps keep the definition next to the calculation: in OWOX Data Marts an analyst defines a Data Mart with SQL, a table or a view, with a description and owners (core concepts).
Can an AI assistant give everyone the same number?
Only if it answers from definitions somebody wrote. Pointed at raw tables, an assistant has to guess which column means revenue. Through the OWOX Data Marts MCP server, Claude or ChatGPT query published Data Marts and "cannot run arbitrary SQL"; the rows in each answer are sent to the AI provider (OWOX documentation). The assistant still chooses which figure to say first.
Will a single source of truth stop the arguments in our meetings?
It stops the argument about what a number means, because that is written down once. It does not stop disagreement about what to do, and it should not. It also does not make an ad platform and an order table agree: they count different events.