Top 10 Marketing Reporting Tools for Advertising in 2026
Explore the top advertising reporting tools of 2026. Automate your ad reports and get clearer insights from your campaign data.

Are you leveraging your data to its fullest potential in your advertising campaigns? With 87% of marketers acknowledging that data is their most underutilized asset, the importance of structured, reliable reporting cannot be overstated.
This article walks you through the essential components of effective advertising reports and shows you how to build them efficiently. You’ll discover how to build reports easily, avoid manual work, and automate the entire process using ten of the most widely used marketing analytics tools.
Note: This post was originally published in December 2020 and has been comprehensively updated in 2026 to reflect current tools and best practices.
What are advertising reports?
Advertising reports are documents that summarize the performance of advertising campaigns. They track metrics such as reach, clicks, conversions, and ROI to help marketers understand which strategies are working and which are not.
These reports typically draw data from multiple platforms, providing a comprehensive view of digital, social media, and traditional advertising efforts. That cross-channel view is what makes them genuinely useful for budget decisions.
Why advertising reports are important
Why advertising reports are important
Advertising reports do more than document past results — they shape future decisions. The structure and focus of any ad report should be tailored to its audience, frequency, and specific objectives.
Here’s why they matter:
- Decision-making: They give managers the data they need to make informed choices about budgets and strategies.
- Performance tracking: Reports reveal which campaigns are working and which need to be cut or adjusted.
- Budget management: By analyzing performance, teams can reallocate spend toward the most profitable channels.
- Customization: Reports can be scoped to different stakeholders — from CMOs who need top-level numbers to channel managers who need campaign-level detail.
- Strategic adjustments: Insights from reports help teams adapt in real time rather than discovering problems at quarter-end.
- Market trends: Good reports surface patterns in consumer behavior that direct your next campaign.
- ROI measurement: They quantify the financial return on advertising spend — the number every economic buyer wants to see.
OWOX Data Marts
See your first report built in real time. 15 minutes.
- Connect your data warehouse
- Pick your metrics
- Get a live Google Sheets report
In the time it takes to write a ticket. Then imagine never writing that ticket again.
Book a DemoWe'll use your actual use case
Components of an advertising report
Components of an advertising report
A well-structured advertising report pulls together data from across your marketing stack. The exact components depend on your channels and goals, but most reports share a common core.
- Landing page performance: Page visits, new contacts, form submissions, and conversion rates.
- Email performance: Emails sent, open rates, click-through rates, and overall engagement.
- Social media performance: Reach, engagement, video views, and actions taken on each platform.
- Total leads or contacts: Lead sources broken down by channel — social, organic, direct, paid.
- Source tracking: Contacts attributed to specific campaigns, keywords, and ad placements.
- Content performance: How well your content attracted new visitors and contributed to ranking gains.
- Blog and organic performance: Posts published, views, and subscriber growth over the reporting period.
Identifying the right metrics for your advertising reports
Identifying the right metrics for your advertising reports
Before you build a report, identify which metrics matter most to the people reading it. Every metric should connect directly to a business goal.
For example:
- If your goal is to increase clicks, your report should track click volume and cost per click (CPC).
- If your goal is to increase conversions, include cost per action (CPA) and the number of conversion events.
- If you want to improve return on marketing investment (ROMI), you need ad spend, revenue, and average order value in the same view.
It’s always worth including ad cost data in every paid channel report — without it, you can’t make a defensible case for scaling any campaign. The main KPIs that suit most companies are listed below.
Try to keep reports focused. Don’t include more data than the reader actually needs — it dilutes the signal. Instead of one universal dashboard, create separate dashboards for different decision-making levels. Paid traffic specialists and marketing directors need different views, different time horizons, and different levels of granularity.
Metrics and parameters should be logically sequenced. If CPA has changed, show the conversion trend alongside it so the reader can draw the right conclusion.
To make reports clearer and easier to act on:
- Add context. Market trends, seasonal patterns, competitor activity — anything that shapes how the numbers should be read.
- Add textual commentary. Explain what happened and why, not just what the number is.
- Invest in visualization. Charts and well-designed dashboards make data far easier to interpret than rows of figures.
How often should reports be generated?
How often should reports be generated?
Report frequency should match the decision-making cadence of the audience. Reporting too often creates noise; reporting too rarely means decisions are based on stale data. Decisions in most organizations fall into four levels:
- Vision decisions — made by the board of directors, CEO, and CMO. These cover brand investment and the split between online and offline budgets. Usually annual or bi-annual, grounded in market research.
- Strategic decisions — made by marketing and e-commerce directors, typically monthly. These involve budget distribution across channels and defining top-level KPIs.
- Tactical decisions — usually weekly, made by paid traffic managers. The channel budgets are set; the task is deciding which campaigns to fund, which to pause, and which results to report up.
- Execution decisions — near real-time, made inside advertising platforms (Google Ads, Meta Ads, etc.) by specialists evaluating individual keywords or ads.
See marketing report templates and examples for each of these cadences.
Why automation is required in reporting
Why automation is required in reporting
If you’re still building advertising reports manually — in Google Sheets, Excel, or directly inside GA4 — you’re not just losing time. You’re introducing risk into the data your decisions depend on.
Low-quality data is the primary driver of bad decisions:
- In Google Analytics 4, 10%–20% of conversions are lost, and API data is aggregated while reports are sampled.
- Combining data in spreadsheets leads to regular failures and subtle errors that compound over time.
- Data in advertising platforms is stored in incompatible formats and changes retrospectively, causing report discrepancies.
- The result: businesses waste time and money on decisions built on unreliable numbers.
The most reliable way to resolve this is to move your advertising data into your own warehouse — BigQuery, Snowflake, Redshift, Athena, or Databricks — and build reports from there. Data that lives in your warehouse is data you control. No vendor can cut your historical records, change the API terms, or lock you into their cloud.
That’s the principle behind OWOX Data Marts: your analysts define the metrics as SQL, OWOX governs and publishes those Data Marts, and business users pull the numbers they need into Google Sheets — without touching the underlying data or waiting for an analyst to run a query. Every number traces back to analyst-approved SQL with a full audit trail, so you always know exactly where a figure came from.
Benefits of using a marketing reporting tool
Benefits of using a marketing reporting tool
A good marketing reporting tool doesn’t just save time — it changes what’s possible. Automated, centralized reporting means the whole team can work from the same numbers without bottlenecks or version conflicts.
Key benefits include:
- Improved data accuracy: Automated collection eliminates manual transcription errors that silently corrupt reports over time.
- Better visualization: Modern tools offer flexible charts, drill-downs, and dashboards that make complex data readable for any audience.
- Increased efficiency: Marketing teams spend less time pulling numbers and more time interpreting them.
- Real-time data access: Up-to-date information means faster adjustments and less lag between what’s happening and what you know about it.
- Better collaboration: Shared dashboards and centralized data sources mean everyone is working from the same version of the truth.
- Scalability: Good tools grow with your business — handling more data sources, more channels, and more users without requiring a rebuild.
Key features of a marketing reporting tool
Key features of a marketing reporting tool
Not all reporting tools are built the same. Before committing to a platform, check that it covers the features your team actually needs.
- Data integration: The ability to connect to your existing ad platforms, CRM, and data warehouse — not just the popular defaults.
- Automated data collection: Scheduled pulls mean reports are always current, without manual intervention.
- Customizable : Business users should be able to build reports that show exactly the metrics they care about, without needing SQL expertise.
- Real-time visualization: Immediate data means faster responses to changes in campaign performance.
- Drill-down capability: Aggregated numbers hide problems. Good tools let you go from summary to detail in a few clicks.
- Collaboration and sharing: Stakeholders need to access the right report without asking the data team each time.
- Integration with other tools: The reporting layer should work with your existing stack, not replace it.
Choosing the right marketing reporting tool
Choosing the right marketing reporting tool
With so many options available, the choice comes down to a handful of practical questions about your team’s setup and goals.
- Data sources: Can the tool connect to every channel and system you’re already using?
- Customization: Can your team build the reports they actually need, or are they limited to pre-built templates?
- Scalability: Will it handle growing data volumes without degrading performance?
- User interface: Is it accessible for non-technical users, not just analysts?
- Collaboration: Can the right people access the right reports without IT involvement?
- Pricing: Does the total cost of ownership — including setup, training, and ongoing fees — fit your budget?
- Support: When something breaks at 11pm on a campaign day, is there someone to call?
Top 10 marketing reporting tools for advertising
Top 10 marketing reporting tools for advertising
The tools below are widely used by advertising teams and agencies to streamline data aggregation, improve visualization, and make faster decisions. Each one has a different strength — and a different set of trade-offs.
1. Google Analytics 4
Google Analytics 4 is one of the most widely used free tools for digital ad reporting. It collects data from users’ HTTP requests, browser/OS metadata, and cookies via the GA4 tracking code, then builds reports from those parameters.
You can create advertising reports in GA4 using linked Google Ads data.
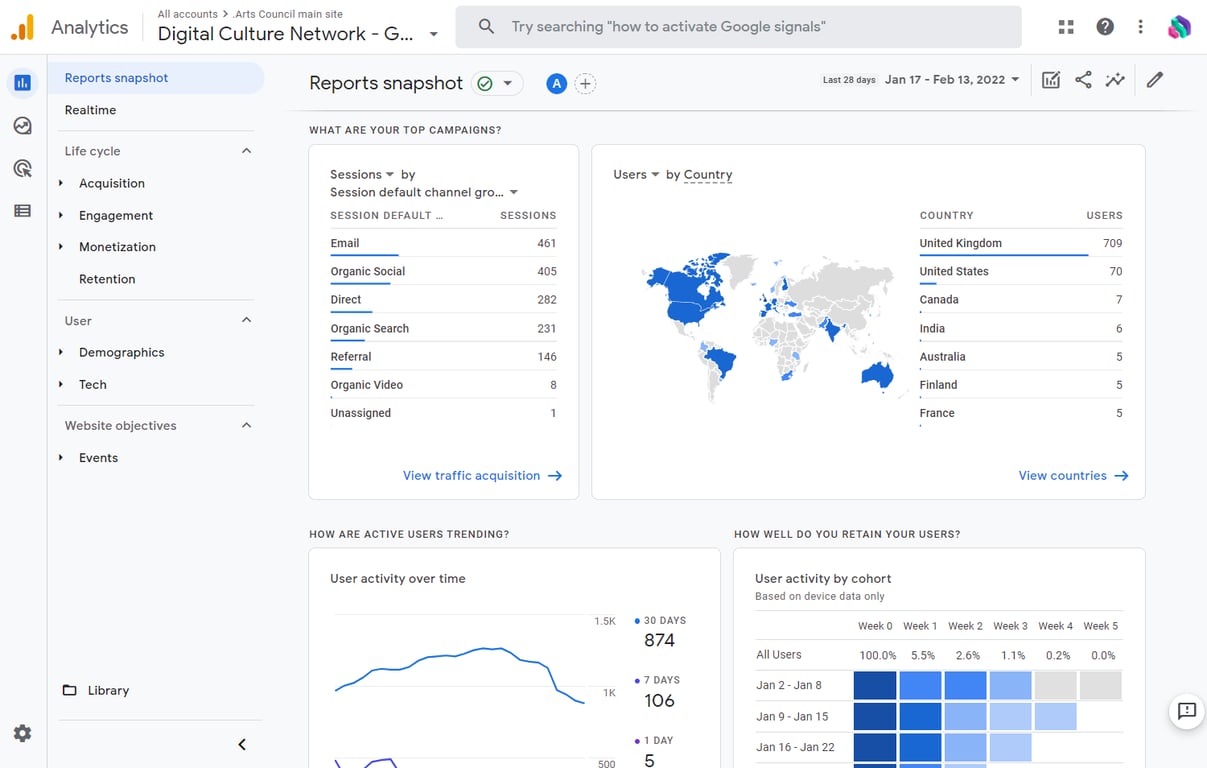
The free version of GA4 is well-suited to small and mid-sized businesses. However, it doesn’t account for CRM data or non-Google channel costs unless you import them manually, and there’s a 24–48 hour processing delay. Conversion tracking also loses 10%–20% of events depending on browser restrictions and consent settings.
2. OWOX Data Marts + Sheets Extension
OWOX Data Marts takes a fundamentally different approach to advertising reporting. Instead of building reports inside a vendor’s platform, analysts define the metrics your team actually uses as SQL Data Marts — session logic, attribution rules, cost models — and OWOX governs, schedules, and publishes those Data Marts to your warehouse.
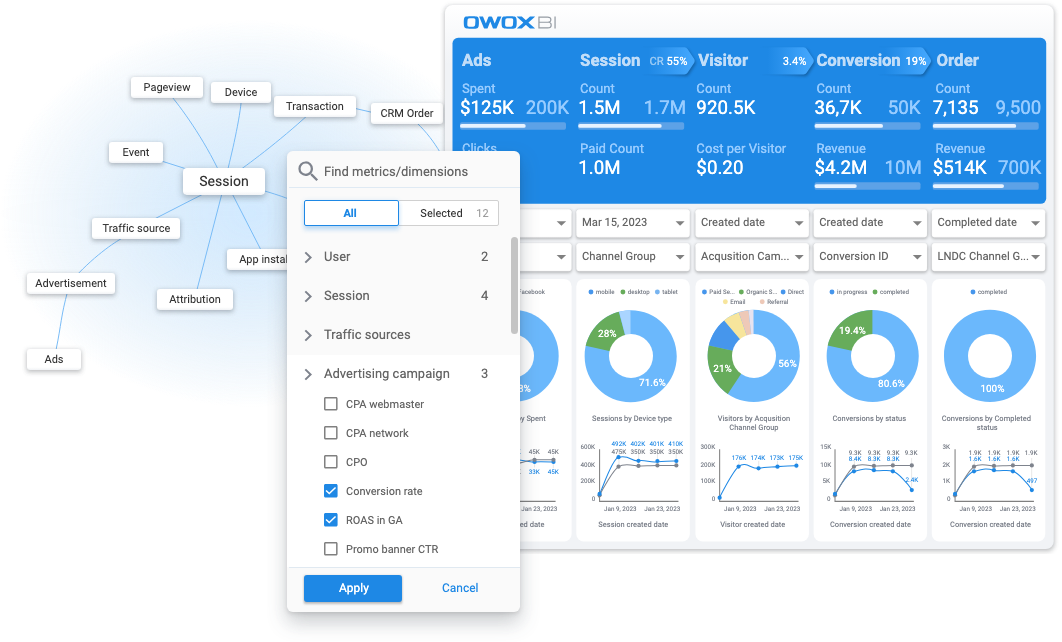
Business users then access those Data Marts directly through the OWOX Sheets Extension — browsing the mart library, selecting columns, applying filters, and refreshing reports inside Google Sheets, without writing SQL. When an analyst updates the underlying mart, every connected Sheet refreshes automatically.
For advertising reporting specifically, your Data Marts can combine:
- User behavior data from GA4 or your website event stream
- Ad cost data from Facebook Ads, Google Ads, LinkedIn Ads, TikTok Ads, and other channels
- Revenue and order data from your CRM
- Email and social campaign data
Three things make this approach distinct. First, no AI hallucinations — every number in a report is generated from deterministic, analyst-approved SQL, with a full audit trail. If a metric is wrong, you can trace it to the exact SQL that produced it. Second, no semantic layer required — metrics live at the Data Mart level, so there’s no brittle abstraction layer to build and maintain. Third, data stays in your warehouse — OWOX never copies your data to a vendor cloud, so you keep full ownership and avoid lock-in.
3. Looker Studio (formerly Google Data Studio)
Looker Studio is a free tool for creating shareable, interactive dashboards. Users connect data sources, customize layouts with drag-and-drop operations, and build visualizations for deep data exploration.
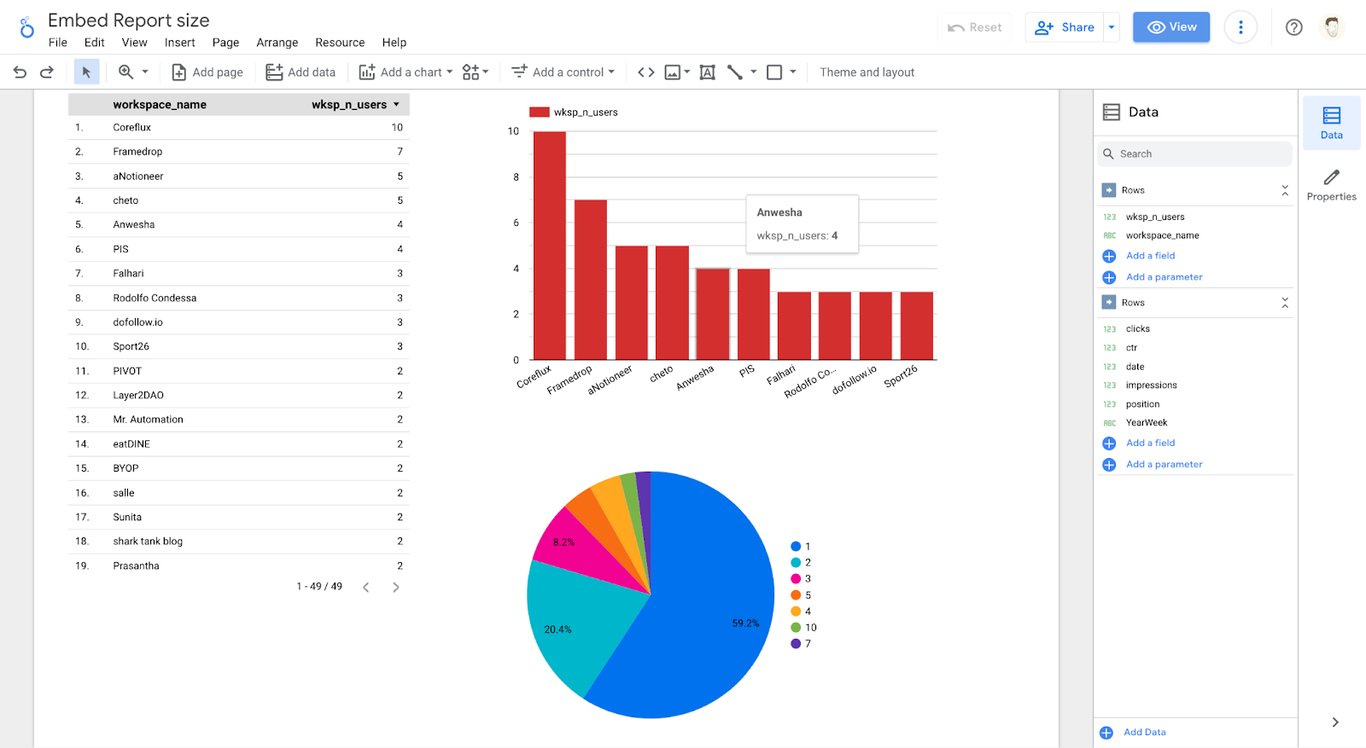
Looker Studio’s biggest limitation is performance at scale: reports slow down noticeably with more than two data sources, and there are caps on the number of visual elements per page. The most effective pattern is to consolidate your marketing and sales data into a single BigQuery dataset first, then connect Looker Studio to that single source.
This approach also improves data reliability — you’re reporting from warehouse-stored, analyst-validated data rather than pulling live from each platform API separately.
4. StitchData
StitchData is an ETL service that connects to more than 130 data sources — databases like MySQL and MongoDB, and SaaS tools like Salesforce and Zendesk — and replicates all selected data to a destination warehouse.
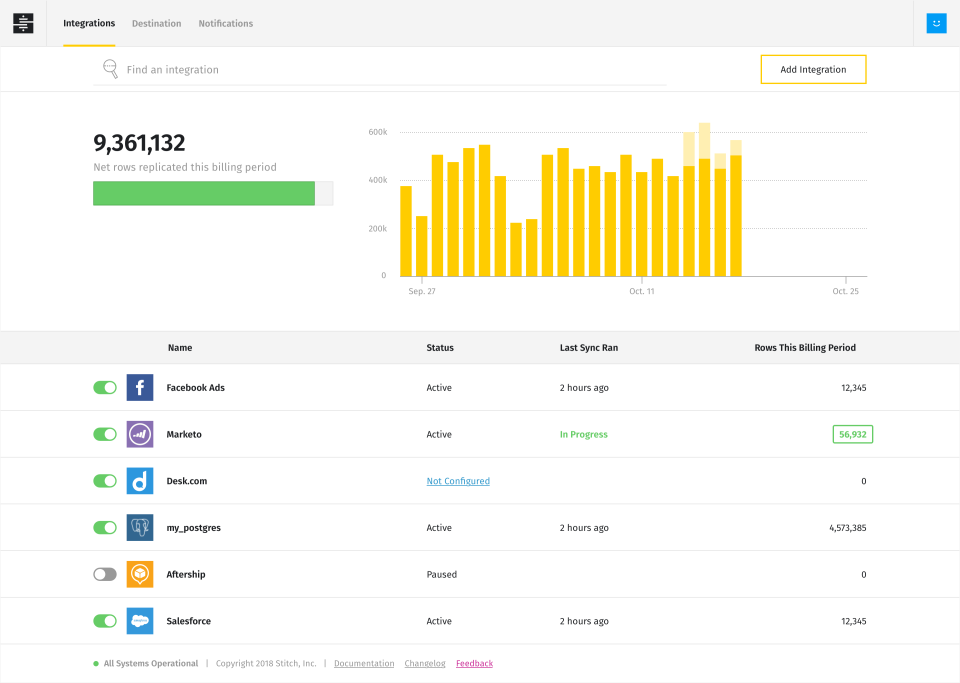
From there, you can build advertising reports from inventory, sales, and purchasing data by connecting your warehouse to Looker Studio, Tableau, or Power BI.
StitchData does not support SQL Server or Azure, and has limited options for data transformation — it moves data, it doesn’t shape it. It’s suitable for businesses of all sizes that need a managed integration layer.
5. Integrate.io
Integrate.io (formerly Xplenty) is a cloud-based ETL platform that automates data flows across a wide range of sources and destinations. It cleans, normalizes, and transforms data before loading, and supports connections to Salesforce, Google Ads, Zendesk, HubSpot, and many other platforms.
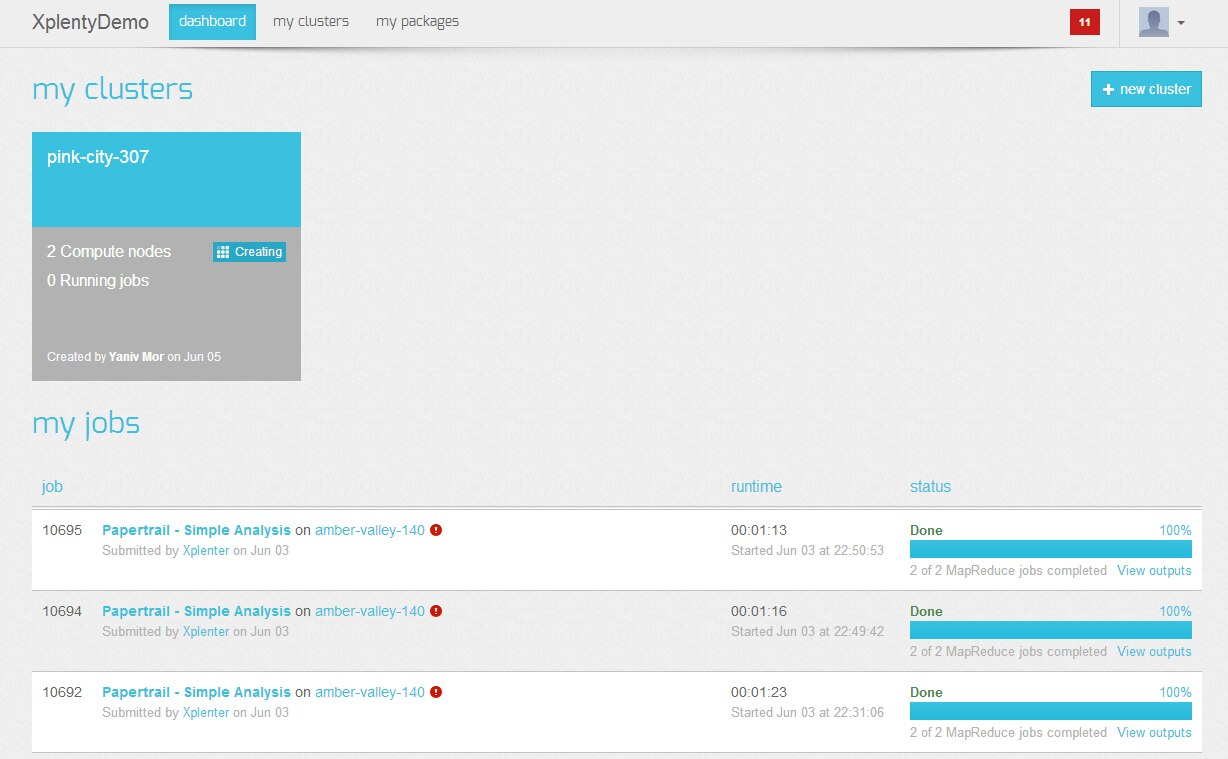
It’s a powerful but complex tool — expect a learning curve. It’s best suited to large businesses and IT departments that need robust, customizable data pipelines rather than quick-start reporting.
6. Klipfolio
Klipfolio is a dashboard and reporting tool focused on robust data visualization. It offers a variety of chart types — bullet charts, scatter plots, and custom visualizations — which are well-suited to presenting advertising performance data clearly.
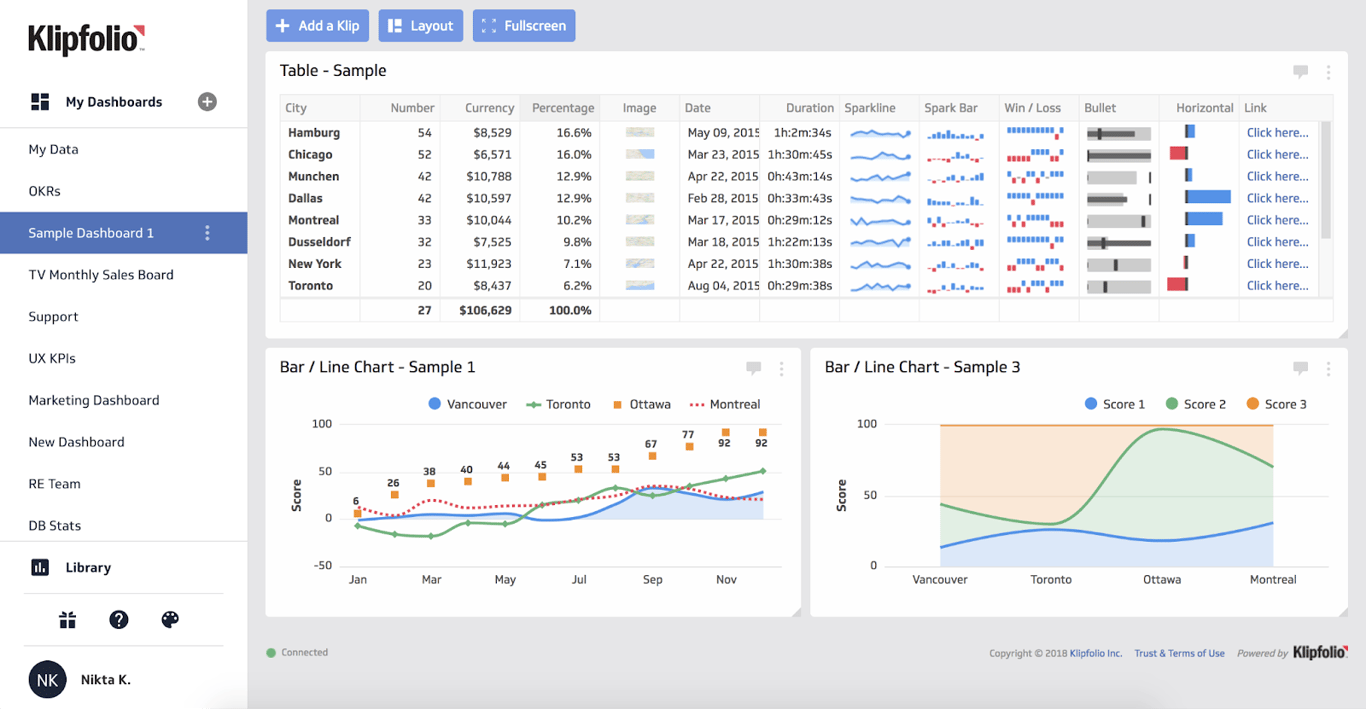
Klipfolio’s built-in templates let teams get reporting up and running quickly, with enough customization to tailor reports to specific campaign goals. It works well for both technical and non-technical users, making it a practical choice for agencies that need to produce client-facing reports at scale.
7. Tableau
Tableau is recognized primarily for its data visualization capabilities. It lets marketers transform raw campaign data into interactive visual reports, making it easier to spot trends, anomalies, and patterns across complex datasets.
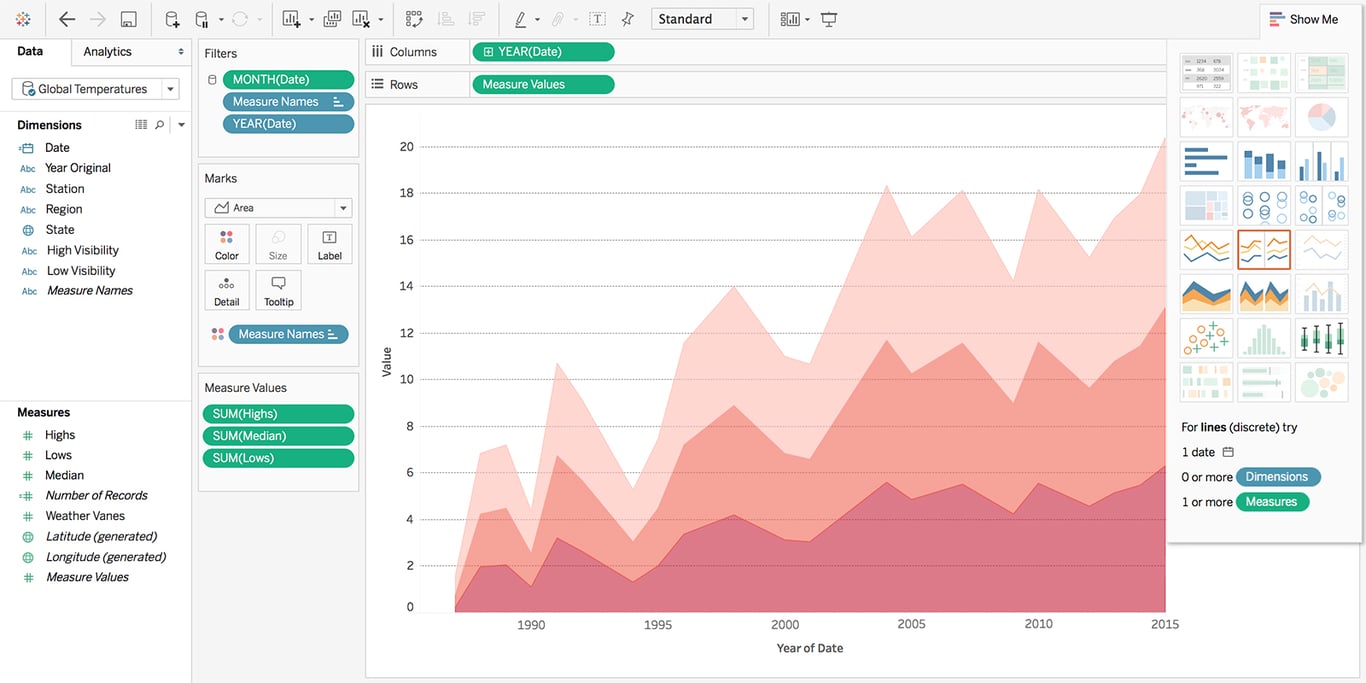
Tableau supports extensive data integration from multiple sources and provides live-updating dashboards that reflect current campaign performance. For teams that need to present advertising insights to executives or clients, Tableau’s visual depth is hard to match — though it comes with a steeper learning curve and a higher price tag than most alternatives.
8. Adobe Analytics
Adobe Analytics is an enterprise-grade reporting platform built for real-time analytics across web and mobile. It offers powerful segmentation and real-time visualization, with deep integration into the Adobe Experience Cloud ecosystem.
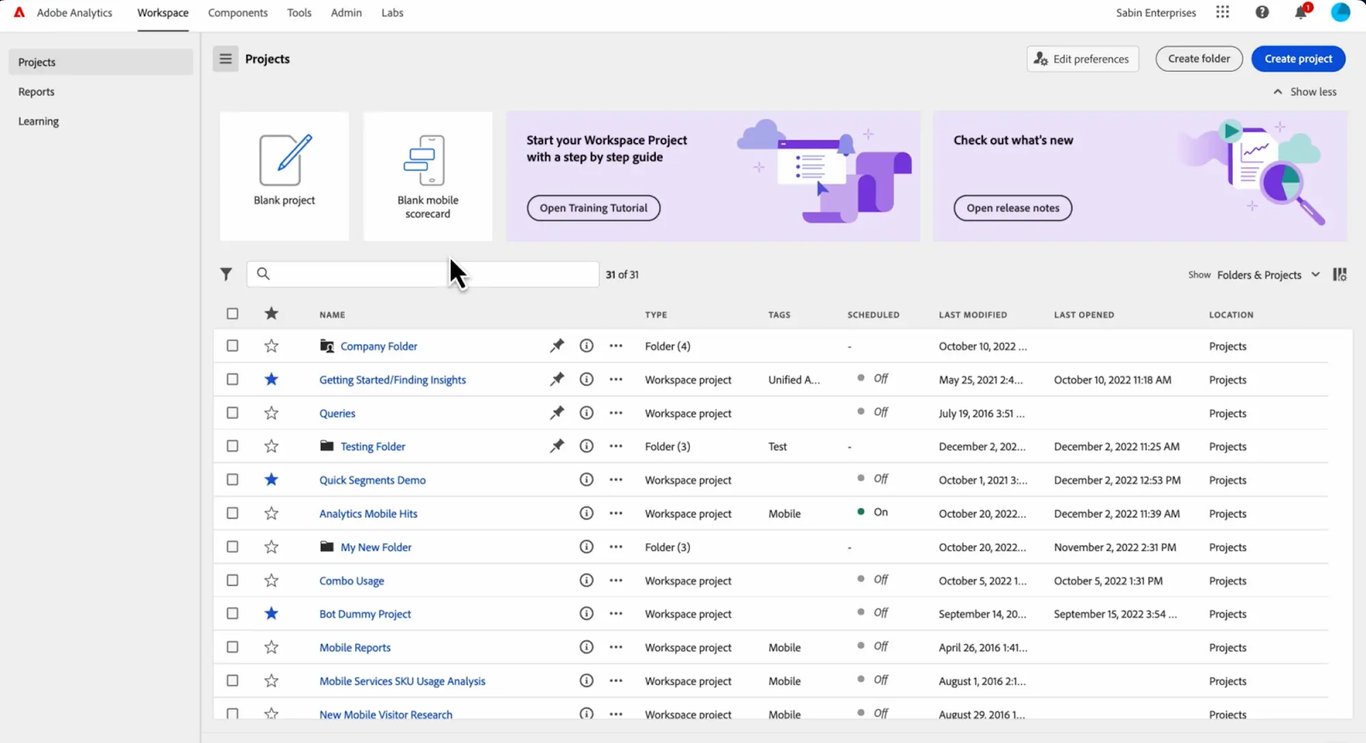
Adobe Analytics excels at tracking customer journeys and understanding how users interact across touchpoints. Its predictive analytics capabilities can surface leading indicators, helping teams adjust campaigns before performance visibly drops. It’s best suited to organizations already deeply invested in the Adobe stack.
9. Sisense
Sisense is a business intelligence platform that handles complex, multi-source data with an interface designed to be accessible for non-technical users. It’s known for its data blending capabilities — pulling disparate sources into a coherent analysis environment.
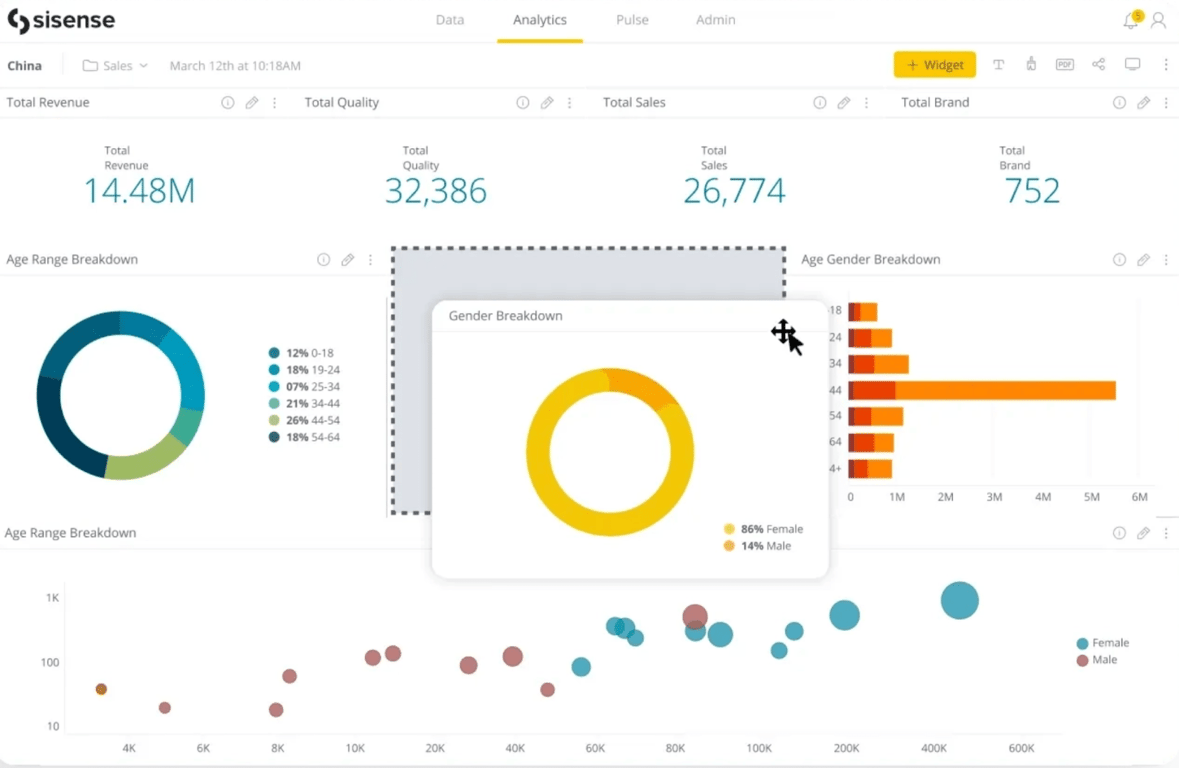
For advertising teams, Sisense helps track campaign performance, user engagement, and ROI across multiple channels. Organizations running advertising across many environments — paid search, display, social, and offline — and needing a single consolidated reporting view will find it particularly useful.
10. Salesforce Marketing Cloud
Salesforce Marketing Cloud provides a suite of reporting tools tightly integrated with Salesforce’s CRM data. Marketers can create and manage campaigns across email, social media, and mobile with a 360-degree view of the customer journey.
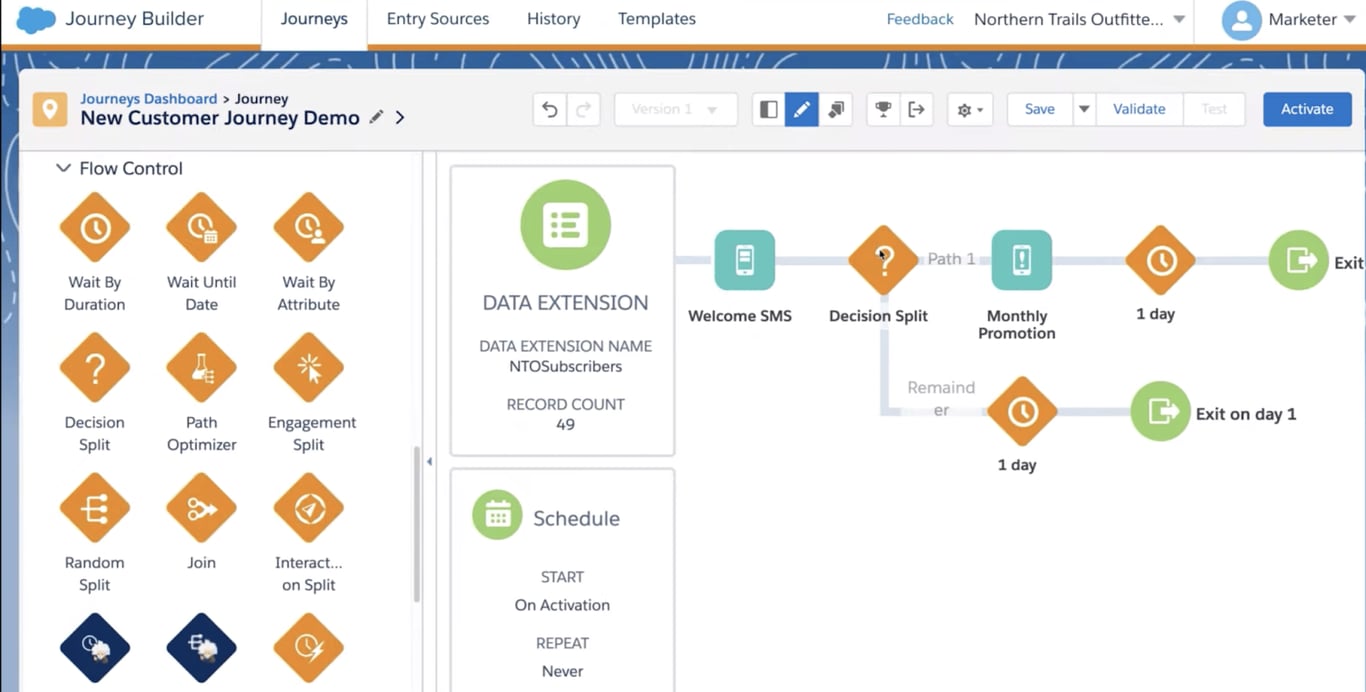
The platform’s advanced analytics help teams personalize interactions and optimize campaigns based on detailed behavioral data. It’s most powerful for organizations where CRM and marketing data are deeply intertwined and where Salesforce is already the system of record for customer relationships.
Conclusion
You shouldn’t spend your analyst hours manually pulling and reconciling ad data. Automate and simplify your advertising reporting using the right tool for your setup — one that connects to your data sources, surfaces the metrics your decision-makers need, and keeps your data where you can trust it.
Whether you’re a PPC manager trying to work faster, a CMO who needs reliable cross-channel numbers, or a data team looking to reduce repetitive requests — the right reporting setup pays for itself quickly in time saved and decisions improved. Try OWOX if you want your analysts to define the metrics once and let the whole team self-serve from there.
Turn your data into decisions.
Governed data marts give you the clean foundation ML needs to actually work.
- No AI hallucinations
- Analyst-governed definitions
- Every number traces to SQL
Frequently Asked Questions
Can advertising reporting tools integrate data from all marketing channels?
A lot of advanced advertising reporting tools, such as Google Analytics and Tableau, offer integration capabilities with multiple marketing channels. This allows marketers to pull in data from social media, search engines, email campaigns, and more, creating a comprehensive view of overall marketing performance.
What should you look for in an advertising reporting tool?
When choosing an advertising reporting tool, consider factors like data integration capabilities, real-time analytics, user-friendliness, and customization options. It’s also important to assess the tool's ability to handle the scale of data typical for your campaigns.
What is advertising reporting?
Advertising reporting involves the collection and analysis of data from marketing campaigns to evaluate their performance and effectiveness. This reporting helps marketers understand the return on investment (ROI), audience engagement, and conversion rates.
Why are advertising reporting tools important?
Advertising reporting tools streamline the process of gathering and visualizing data from various advertising channels. These tools provide real-time insights and analytics that help marketers measure campaign success against set objectives.
What does attribution mean in advertising?
The goal of attribution in advertising is to define how the value of a conversion is distributed across channels that move the user through the funnel.
How to evaluate the impact of media advertising on marketing in general?
To find out how media campaigns affect your sales funnel, you need to combine impression data with data on website visits and sales from your CRM.
You can do this with the help of OWOX BI or Google Ads Data Hub.