What is data freshness? How to measure it and how fresh a decision needs
Data freshness is how recent the data behind a number is. How to measure it per input, and how fresh each business decision really needs it.
Data freshness is how recent the data behind a number is: the gap between the last real-world event the data includes and the moment someone reads the number. A daily sales report that was rebuilt this morning but still ends on Friday is not fresh, however recently it ran.
Two questions follow. How do you measure it, and how fresh does it need to be? The first has a precise answer. The second depends on the decision, and on the weakest input behind it, because a number built from several sources is only as fresh as the stalest one.
Note: Originally published in January 2024. Fully updated in October 2026 with a run on demo data, a decision-by-decision freshness table and how freshness is shown on a Data Mart.
Freshness, latency and “last updated” are three different things
Freshness, latency and “last updated” are three different things
These three get used interchangeably, and the confusion is behind most stale-number incidents:
| Term | What it measures | Example |
|---|---|---|
| Data freshness | Age of the newest event in the data | Orders run to yesterday 23:59 |
| Latency | Time from an event to when it is queryable | An order takes 2 hours to reach the warehouse |
| Last updated | When something last wrote to the table | The table was written at 06:00 today |
“Last updated today” does not mean “covers today”. A load can run at 06:00 and bring nothing past last Thursday, because the source stopped sending. A backfill can rewrite a table today with figures from two years ago. Freshness is about the dates inside the data, not the time on the table.
How to measure data freshness
Measure freshness on the dates in the data, per source, against the date you expected:
SELECT
  'ad spend' AS source,
  MAX(date) AS latest_day,
  DATE_DIFF(CURRENT_DATE(), MAX(date), DAY) AS days_behind
FROM `owox-demo.ecommerce.ad_performance`
UNION ALL
SELECT
  'orders',
  MAX(order_date),
  DATE_DIFF(CURRENT_DATE(), MAX(order_date), DAY)
FROM `owox-demo.ecommerce.orders`
Three rules make the number trustworthy:
- Use the event date, not the load time.
MAX(loaded_at)tells you the pipe ran.MAX(event_date)tells you what the data covers. - Measure every input, not the report. A report that reads three sources has three freshness values. The report’s freshness is the oldest of them.
- State the expected lag. “One day behind” is on time for a daily load and three days late for an hourly one. Write down what each source should be, then compare.
CURRENT_DATE() in BigQuery is UTC unless you pass a time zone. Use the zone your business day is counted in.
OWOX Data Marts
See your first report built in real time. 15 minutes.
- Connect your data warehouse
- Pick your metrics
- Get a live Google Sheets report
In the time it takes to write a ticket. Then imagine never writing that ticket again.
Book a DemoWe'll use your actual use case
A ratio is only as fresh as its stalest input
A ratio is only as fresh as its stalest input
On 14 October 2026 we ran the query above on the [Demo] E-commerce data (a demo shop whose orders are generated daily and whose ad spend comes from ad platform connectors). Orders ran to 14 October. Ad spend stopped on 10 October, four days behind.
Then we computed ROAS, revenue from completed orders divided by ad spend, two ways:
| Window | Revenue | Spend | ROAS |
|---|---|---|---|
| “Last 7 days”, 8–14 October | $47,147 | $1,108 | 42.5 |
| Last 7 days both sources cover, 4–10 October | $55,956 | $4,048 | 13.8 |
The “last 7 days” ROAS is three times too high, and nothing in it is wrong except the window. Seven days of revenue are divided by three days of spend. No query fails and no table is empty. A dashboard set to “last 7 days” shows 42.5 to anyone who opens it.
One window could be a fluke, so we repeated it. For every 7-day window ending on a Tuesday from 7 July to 29 September 2026 (13 windows), we computed ROAS with complete spend, then with the last 1 to 4 days of spend missing:
| Days of spend missing | Average ROAS inflation | Range over 13 windows |
|---|---|---|
| 1 | +22% | +11% to +33% |
| 2 | +52% | +24% to +80% |
| 3 | +75% | +41% to +99% |
| 4 | +116% | +73% to +177% |
On this shop, every missing day of spend adds roughly a fifth to a third to a 7-day ROAS, and four missing days more than double it. The true ROAS over those windows averaged 17.6. A team that reads this dashboard on a Monday after a connector failed on Friday would see a number above 30 and might shift budget towards ads that did nothing different.
If spend were perfectly even, the inflation would be pure arithmetic: seven days of revenue over six, five, four or three days of spend, or +17%, +40%, +75% and +133%. The measured ranges are wider because real spend is not even across the week. The size of the error depends on how even spend is, so measure it on your own data with the same query shape. Which way it moves depends on which input is stale; the checks article covers both directions.
The fix is to compute ratios only over days every input covers. Cap the window at the oldest input’s latest day, and show that date next to the number:
WITH latest AS (
  SELECT LEAST(
    (SELECT MAX(date)
     FROM `owox-demo.ecommerce.ad_performance`),
    (SELECT MAX(order_date)
     FROM `owox-demo.ecommerce.orders`)
  ) AS covered_to
)
SELECT covered_to,
  DATE_SUB(covered_to, INTERVAL 6 DAY) AS covered_from
FROM latest
Use covered_from and covered_to as the report’s date range instead of “today minus 7”.
How fresh does a decision need its data?
How fresh does a decision need its data?
“Real-time” is rarely the right target. The right freshness depends on how often the decision is made and what a stale day costs:
| Decision | Made | Freshness it needs | A stale day costs |
|---|---|---|---|
| Pause a campaign that overspends | Several times a day | Hours | Spend you cannot get back |
| Daily budget pacing | Daily | Yesterday, complete | One day of over- or underspend |
| Weekly channel review | Weekly | Last full week, all sources | A wrong reallocation for a week |
| Monthly reporting to leadership | Monthly | Closed month, reconciled | Credibility, if the number changes later |
| Quarterly planning | Quarterly | Closed quarter | Little, if the data is complete |
Two things follow from the table. Completeness matters more than speed for most decisions: a weekly review needs every source to cover the full week, not the last hour. And ad platform data is not always final on day one. Conversions can still be attributed to a past day after it is loaded, so a “fresh” yesterday can still change. Google documents its own processing times for Google Analytics data in its help page on data freshness.
Ask one question per report: what is the oldest data this decision can tolerate? Then check each input against it.
Making freshness visible to the person reading the number
Making freshness visible to the person reading the number
Often nobody knows that ad spend is four days behind until a number looks wrong, and then the analyst goes looking for which load failed. The person reading the dashboard never finds out at all. Most stale-number incidents are not a pipeline failure; they are a number read without its date.
Three practices close that gap:
- Show “data through” next to every number. Not “last refreshed”, but the latest day all inputs cover.
- Check freshness before a report is delivered, not after someone notices. Data quality checks on every Data Mart shows a freshness check that fails on an empty table too, and how to get alerted.
- Write an expected lag per source. For hourly and real-time targets, data freshness SLAs covers how to set and monitor them.
How freshness is shown in OWOX Data Marts
How freshness is shown in OWOX Data Marts
In OWOX Data Marts, every Data Mart shows a Data Last Updated value: when the source tables behind it last changed in your warehouse. It appears on the Data Mart page with a Check now button, as a sortable column in the Data Marts list, on the Models canvas, and in every MCP query response, so an AI assistant answering from a Data Mart gets the time with the data. The documentation is explicit about what it means: a storage timestamp, and “updated today” does not mean “covers today”.
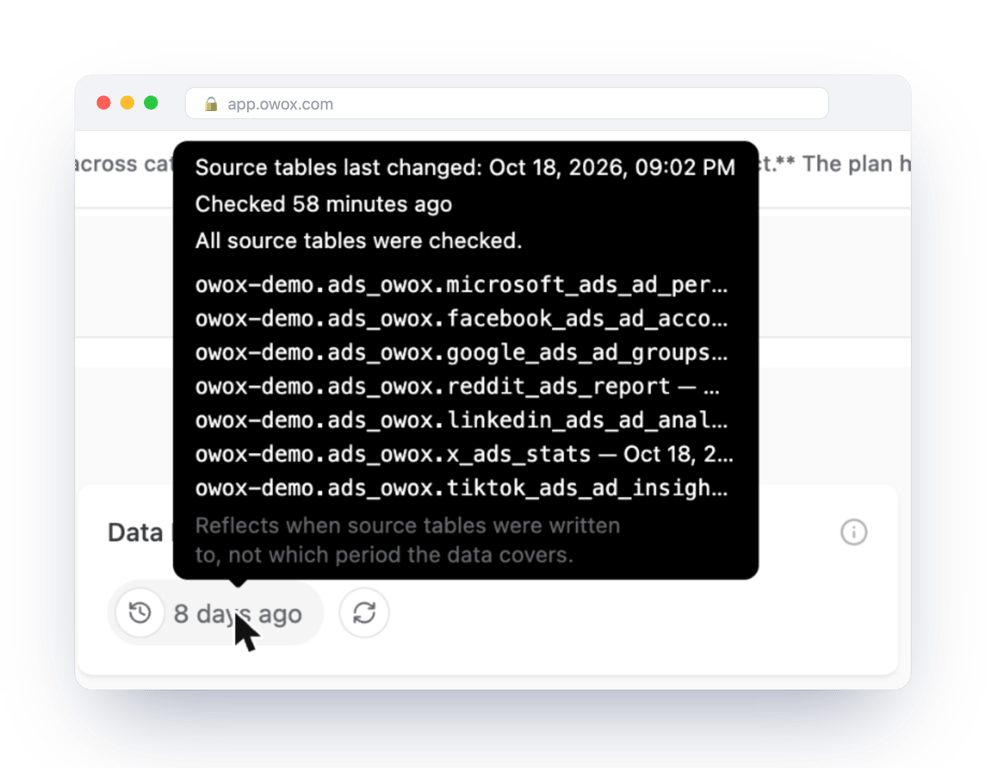
We asked the Unified Ad Spend Data Mart in [Demo] E-commerce for its latest date through the MCP server on 14 October 2026. The response carried the answer, 10 October, and a data_last_updated block: source tables last written on 11 October at 20:39 UTC, coverage complete, with the time for each of the seven ad platform tables behind it. The same response instructs the assistant to say “the source tables were last updated” and not to describe the data as fresh up to that time. That is the distinction this article is about, enforced on the AI side: written on the 11th, covering to the 10th.
Each scheduled report run measures it and records it in the run’s history, so the time is attached to the delivery a business user received in Sheets or elsewhere. For the “covers today” half, a quality freshness check on a timestamp field, or the threshold query above, tests the dates in the data.
Data Last Updated works on Google BigQuery, Snowflake, AWS Redshift, AWS Athena and Databricks, with storage-specific limits listed in the documentation. Snowflake, for instance, reports the hour of the last change and can trail by several hours.
You can try OWOX Data Marts on your own warehouse.
Turn your data into decisions.
Governed data marts give you the clean foundation ML needs to actually work.
- No AI hallucinations
- Analyst-governed definitions
- Every number traces to SQL
Frequently Asked Questions
How do you measure data freshness?
Take the latest event date in each source, not the load time, and compare it with the date you expected. Measure every input separately: a report that reads three sources has three freshness values, and the report is only as fresh as the oldest one.
What is the difference between data freshness and data latency?
Latency is how long an event takes to become queryable. Freshness is how old the newest event in the data is when someone reads it. Low latency does not guarantee freshness: if a source stops sending, a fast pipeline keeps loading nothing new.
Why does data freshness matter for decisions?
Because a stale input changes the number without any error. On our demo shop, a 'last 7 days' ROAS read 42.5 instead of 13.8 because ad spend stopped four days before orders did. Compute ratios only over the days every input covers, and show that date next to the number.
How fresh does data need to be for a business decision?
It depends on how often the decision is made and what a stale day costs. Pausing an overspending campaign needs data from the last hours. A weekly channel review needs the full last week from every source. Monthly and quarterly reporting need closed, reconciled periods more than speed.
What is data freshness?
Data freshness is how recent the data behind a number is: the gap between the last real-world event the data includes and the moment someone reads the number. A report rebuilt this morning that still ends on Friday is not fresh, however recently it ran.