Marketing analytics data model: what to ask your analyst for
When marketing's cost per new customer and finance's differ, the cause is usually not the data. It is how the tables are joined and which definition each team used. This guide shows both on one month of demo shop data, proposes a starting definition, lists the decisions that belong to the marketing leader, gives a one-page spec to hand to your analyst, and ends with a short note for the finance lead or CEO who asked.
“Why is your cost per new customer different from ours?” If finance or the CEO asked you that this month, here is the honest answer: both numbers can be correct, and the gap comes from two things nobody wrote down. One is how the spend, visit and order tables were put together. The other is which definition each team used.
A marketing analytics data model is where both get written down. It is the agreed structure behind your marketing numbers: which tables exist, what one row in each of them means, how they connect, and one written definition for every metric you report. It is not a dashboard, and it is not an attribution model.
This guide is for the marketing leader who approves the budget, not the person who writes the SQL. For the editable diagram of a B2B lead-gen funnel, see the marketing data model. If you are the person who asked the question, the last section is written for you.
What a marketing analytics data model is, and what it is not
What a marketing analytics data model is, and what it is not
A data model is half structure and half agreement between people.
Structure, and a definition for every number
The structure says which tables exist, what one row in each represents (analysts call this the table’s grain; this guide says level of detail), and how they join. The definitions say what counts as an order, what makes a customer new, which date an order belongs to, and whether a returned order still counts.
Your analyst can build the first half alone. The second half is yours, with finance. If marketing and finance have not agreed what “a new customer” means, no table design will reconcile the numbers.
Not a dashboard, and not your attribution model
A dashboard shows whatever query sits behind it. Two dashboards can read the same warehouse, use different definitions of spend, and both look authoritative. The model sits underneath and decides what a query is allowed to mean.
Nor does the model decide which ad gets credit for a sale. It records what happened: this campaign spent this much on this day, this visit came from that campaign, this order was placed in that visit. Attribution is a rule applied on top of those facts.
Why the same data gives marketing and finance different numbers
Why the same data gives marketing and finance different numbers
There are three usual reasons, and only the third is about opinions.
- The tables were joined at the wrong level of detail. Spend is recorded once per campaign per day. Visits are recorded once per visit. Orders, once per order. Put them side by side without bringing them to the same level first, and figures repeat. The total grows and nothing errors.
- The rows that do not match were dropped. Spend with no tracked visit, or orders with no visit behind them, fall out of some joins silently.
- Each team used a different definition. Cost per order or cost per new customer? Ad spend only, or with agency fees and salaries? Each choice is defensible, and each gives a different figure.
The first two are your analyst’s to fix once you ask. The third is a decision you make with finance. The next two sections show all three on real figures.
OWOX Data Marts
See your first report built in real time. 15 minutes.
- Connect your data warehouse
- Pick your metrics
- Get a live Google Sheets report
In the time it takes to write a ticket. Then imagine never writing that ticket again.
Book a DemoWe'll use your actual use case
One month of shop data, joined two ways
One month of shop data, joined two ways
The figures below come from the [Demo] E-commerce project in BigQuery, an online shop with ad spend from seven platforms, website sessions, customers and orders, for September 2026. The demo is small and clean: one currency, every order placed in a tracked session, campaign names already matched between the ad data and the visits. Real data is messier, so treat these as the mildest version of the problem.
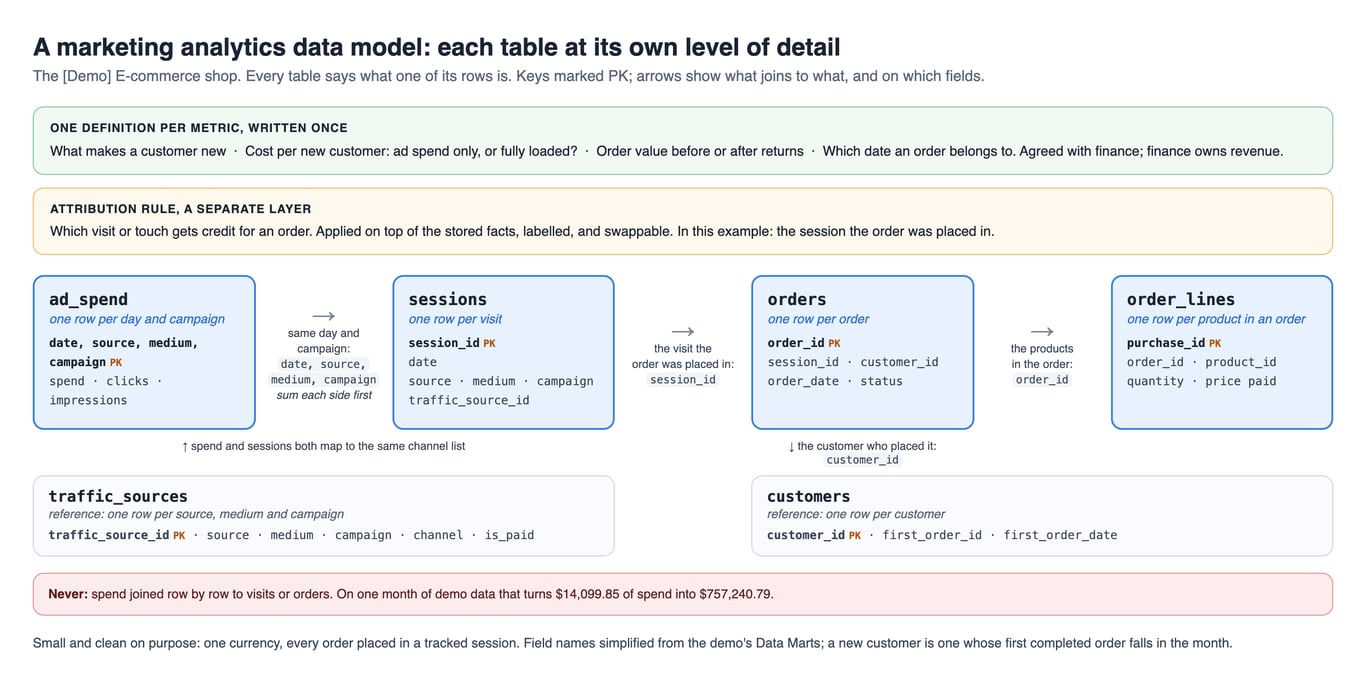
In the warehouse view this guide queries, the shop spent $14,099.85 on ads that month, across 450 rows: one row per campaign per day. It had 24,577 sessions and 537 completed orders. (On 11 October 2026 the demo’s Data Mart returned a different total for the same month, because of a typo in one line of its SQL; see “What the product answered” below.)
The join that looks right
The obvious query puts each spend row next to the sessions of the same campaign on the same day:
SELECT ROUND(SUM(a.spend), 2) AS spend
FROM `owox-demo.ecommerce.ad_performance` AS a
JOIN `owox-demo.ecommerce.sessions` AS s
  ON s.date = a.date
  AND s.source = a.source
  AND s.medium = a.medium
  AND s.campaign = a.campaign
WHERE a.date BETWEEN '2026-09-01'
  AND '2026-09-30'
It returns $757,240.79, about 54 times what the shop spent. Every spend row is repeated once for each session that campaign brought that day, so a day with 30 sessions counts its spend 30 times.
Nobody would believe $757,240.79. The danger is the same mistake on a smaller scale: a figure 8% too high instead of 54 times too high looks plausible and goes into the deck.
The same join also loses something. This query counts the spend rows and the ones with no session on the same day and campaign:
WITH spend AS (
  SELECT date, source, medium, campaign,
    spend
  FROM `owox-demo.ecommerce.ad_performance`
  WHERE date BETWEEN '2026-09-01'
    AND '2026-09-30'
),
visit_days AS (
  SELECT DISTINCT date, source,
    medium, campaign
  FROM `owox-demo.ecommerce.sessions`
  WHERE date BETWEEN '2026-09-01'
    AND '2026-09-30'
)
SELECT
  COUNT(*) AS spend_rows,
  COUNTIF(v.date IS NULL)
    AS rows_without_a_session,
  ROUND(SUM(IF(v.date IS NULL,
    s.spend, 0)), 2) AS spend_dropped
FROM spend AS s
LEFT JOIN visit_days AS v
  USING (date, source, medium, campaign)
Run on 11 October 2026, it returns 450 spend rows, 102 of them without a session, carrying $20.83 of spend. An inner join drops those 102 rows without a word. Small here, because the days with no visits are the days with almost no spend; in a real account with tracking gaps it is the spend nobody can find.
The same month, at one level of detail
The fix is to say what one row means before joining. Here that is one row per day, source, medium and campaign. Each side is summed to that level on its own, then the two are joined, keeping rows with no partner on either side. A customer counts as new in the month of their first completed order:
WITH daily_spend AS (
  SELECT date, source, medium, campaign,
    SUM(spend) AS spend
  FROM `owox-demo.ecommerce.ad_performance`
  WHERE date BETWEEN '2026-09-01'
    AND '2026-09-30'
  GROUP BY 1, 2, 3, 4
),
order_value AS (
  SELECT order_id,
    SUM(line_revenue) AS value
  FROM `owox-demo.ecommerce.purchases`
  GROUP BY 1
),
first_orders AS (
  -- each customer's first completed order
  SELECT customer_id,
    MIN_BY(order_id, order_date)
      AS first_order_id
  FROM `owox-demo.ecommerce.orders`
  WHERE status = 'Completed'
  GROUP BY 1
),
daily_visits AS (
  SELECT s.date, s.source,
    s.medium, s.campaign,
    COUNT(DISTINCT s.session_id)
      AS sessions,
    COUNT(DISTINCT IF(
      o.status = 'Completed',
      o.order_id, NULL))
      AS completed_orders,
    COUNT(DISTINCT f.first_order_id)
      AS new_customers,
    SUM(IF(o.status = 'Completed',
      v.value, 0)) AS completed_value
  FROM `owox-demo.ecommerce.sessions` AS s
  LEFT JOIN `owox-demo.ecommerce.orders` AS o
    USING (session_id)
  LEFT JOIN order_value AS v
    USING (order_id)
  LEFT JOIN first_orders AS f
    ON f.first_order_id = o.order_id
  WHERE s.date BETWEEN '2026-09-01'
    AND '2026-09-30'
  GROUP BY 1, 2, 3, 4
),
joined AS (
  SELECT
    CONCAT(source, ' / ', medium) AS channel,
    spend, sessions, completed_orders,
    new_customers, completed_value
  FROM daily_spend
  FULL OUTER JOIN daily_visits
    USING (date, source, medium, campaign)
)
SELECT
  IF(GROUPING(channel) = 1, 'Total',
    channel) AS row_label,
  ROUND(SUM(spend), 2) AS spend,
  SUM(sessions) AS sessions,
  SUM(completed_orders) AS completed_orders,
  SUM(new_customers) AS new_customers,
  ROUND(SUM(completed_value), 2)
    AS completed_value
FROM joined
GROUP BY ROLLUP(channel)
ORDER BY GROUPING(channel),
  spend DESC NULLS LAST, sessions DESC
Spend now totals $14,099.85 to the cent, and the channels with no spend stay in:
| Channel | Spend | Sessions | Completed orders | New customers | Completed order value |
|---|---|---|---|---|---|
| facebook / cpc | $4,005.88 | 4,059 | 55 | 3 | $19,560.16 |
| tiktok / cpc | $3,114.51 | 5,803 | 29 | 2 | $11,074.85 |
| bing / cpc | $2,840.03 | 1,399 | 34 | 2 | $12,410.92 |
| google / cpc | $2,386.70 | 785 | 17 | 2 | $9,189.17 |
| linkedin / cpc | $1,156.08 | 320 | 4 | 0 | $1,824.10 |
| reddit / cpc | $487.52 | 839 | 5 | 0 | $1,739.32 |
| twitter / cpc | $109.13 | 127 | 0 | 0 | $0.00 |
| google / organic | none | 5,279 | 148 | 8 | $81,629.84 |
| direct / (none) | none | 5,097 | 212 | 12 | $120,963.85 |
| email / newsletter | none | 869 | 33 | 0 | $18,124.62 |
| Total | $14,099.85 | 24,577 | 537 | 29 | $276,516.83 |
A new customer is someone whose first completed order falls in the month; everyone else who ordered is returning. In this shop, 508 of the 537 completed orders were not a customer’s first, an unusually high share of repeat orders that comes from how the demo was generated, not from a real shop.
Two more choices are built into this table, and both should be written down. Completed order value is not revenue. It is what customers paid for orders that were neither cancelled nor returned. Revenue is what finance recognises in the accounts, and finance owns that definition. And each order is credited to the session it was placed in, so “from paid clicks” below means the last visit before the order came from a paid click.
Four honest answers to “what does a customer cost us?”
Four honest answers to “what does a customer cost us?”
Take the table above and ask the question finance asked. Same spend, same month, four defensible figures:
| Definition | Spend | Divided by | Cost |
|---|---|---|---|
| Paid cost per order | $14,099.85 | 144 completed orders from paid clicks | $97.92 |
| Blended cost per order | $14,099.85 | all 537 completed orders | $26.26 |
| Paid cost per new customer | $14,099.85 | 9 new customers from paid clicks | $1,566.65 |
| Blended cost per new customer | $14,099.85 | all 29 new customers | $486.20 |
Nine new customers is far too few to plan on, and the demo’s repeat share is not typical. Read the rows as how the arithmetic moves, not as a benchmark. The argument in the meeting is not about data quality. It is about which sentence is written above the number.
Finance’s figure is usually higher than marketing’s for three reasons. It divides by new customers only, not by every order. It adds the costs that are not in the ad accounts: agency fees, affiliate and influencer costs, tools and salaries. And it follows accrual accounting: spend that ran in a month but is not invoiced yet, and retainers billed in arrears, are accrued to the month the work happened, which can move cost between months compared with what the ad accounts show. It is lower when it is blended, spend over every order or every new customer, including those who came from search, direct visits or email, which carry no ad spend at all.
The decisions that are yours, not your analyst’s
The decisions that are yours, not your analyst’s
None of these has an objectively correct answer. What matters is that one is written into the model, and the others are not available by accident.
A starting definition you can put forward: two figures, side by side, each with its name. For the last month finance has closed, divide each by the new customers whose first completed order that month came from a paid click (an attribution rule both sides agree to; it misses people who saw an ad and never clicked).
- Paid media cost per new customer: ad spend from the ad accounts.
- Fully loaded cost per new customer: the same, plus agency fees, affiliate costs (network invoices, net of reversed commissions), influencer fees, tools and salaries, each on its own named line. Finance sets the allocation of salaries and tools, by time share or headcount, and signs it off.
Finance owns cost, so finance chooses which of the two goes on the board slide. It is a starting point for the meeting; finance can change any part of it.
Then agree each of these with finance, in a sentence, before the analyst builds anything:
| Decision | The choice to make | Why it moves the number |
|---|---|---|
| Channel list | Which channels exist, and what each source and medium maps to | Two spellings of one channel split its spend and its orders |
| A new customer | First order, first payment, first order not returned, or for a subscription the first paid charge after a trial | Decides which month the customer, and their cost, lands in; a trial started in one month and converted in the next needs a stated rule for both |
| Cost per new customer | Ad spend only, or fully loaded with each extra cost on its own line | Same customers, a different numerator |
| Return on ad spend | Order value before or after cancellations and returns | Cancelled and returned orders still sit in the order table |
| Conversion rate | Over sessions, visitors or leads | Same orders, three different rates |
| Which date an order belongs to | The day of the visit the ad bought, or the day of the order | Moves orders between months near month end |
| Attribution rule | Which visit or touch gets the credit for an order | Moves orders between channels |
The channel list is the one to do first. It is a management decision, not a technical one, and it is short: if it does not fit on one slide, nobody will maintain it.
A definition only helps if every report takes it from the same place. It belongs in the model, next to the data, not in a spreadsheet tab or one analyst’s head, with an owner, a version and the date it took effect. A change applies from that date; a month finance has closed is never restated silently. A shorter guide to writing definitions down is in metric definitions without a semantic layer.
Attribution is its own layer
The demo table credits each order to the session it was placed in. That is one rule among several: first visit, last paid click, an even split across every touch. Each is different arithmetic over the same recorded facts.
So ask for the facts to be stored and the rule applied on top, labelled. Then two rules can sit side by side in one meeting. If attributed revenue is stored as a column, one rule is frozen into your history and changing it means recomputing everything. The way to keep it swappable is shown in the marketing data model; the choice between rules is in marketing attribution models.
The hardest join: an order to the visit it came from
The shop knows the order; the analytics tool knows the visit. Nothing connects them unless someone builds the link. The usual ways: the purchase event your site sends to analytics carries the shop’s order ID, or the checkout stores the analytics client and session IDs on the order. Without either, the analyst falls back on a match rule, such as the same person within a time window, and the rule has to be written down.
If your analytics is Google Analytics 4, its BigQuery export creates event tables, one per day; Google’s schema page lists no table of sessions (BigQuery Export schema). For analysing sessions outside Analytics, Google’s advice is to join the user ID or the pseudonymous user ID with the session ID to get a unique key for each session (About Analytics sessions). That rebuilt session is what the order is matched to.
The share of orders that can be matched is the ceiling on how much any attribution rule can tell you. This is the query to ask for:
SELECT
  COUNT(*) AS completed_orders,
  COUNTIF(s.session_id IS NOT NULL)
    AS matched_to_a_visit,
  ROUND(100 * COUNTIF(
    s.session_id IS NOT NULL)
    / COUNT(*), 1) AS match_rate_pct
FROM `owox-demo.ecommerce.orders` AS o
LEFT JOIN `owox-demo.ecommerce.sessions` AS s
  USING (session_id)
WHERE o.status = 'Completed'
  AND o.order_date BETWEEN '2026-09-01'
    AND '2026-09-30'
On the demo it returns 537 of 537, a match rate of 100%. That figure proves nothing about a real shop: the demo’s orders are generated from its sessions, so every order has one by construction. In a real shop, phone orders, blocked cookies, people who switch devices and long decisions all lower it. Ask for it as a figure, not a reassurance: “What share of last month’s completed orders joins to at least one visit, and what happened to the rest?” If nobody has measured it, that is the answer, and measuring it is the first thing to fund.
The one-page spec to hand your analyst
The one-page spec to hand your analyst
Short on purpose. It specifies outcomes and definitions; the table design is the analyst’s job.
Questions the model must answer
- What did we spend by channel and campaign, by day, in one currency?
- What did each channel produce in sessions, orders, new customers and order value, under a stated attribution rule?
- What does a new customer cost per channel, under the definition we agreed with finance?
- How do these figures reconcile to what finance reports, and where do they differ on purpose?
Level of detail and keys, stated for every table
- Ad spend: one row per day and campaign, keyed on the ad platform and its campaign ID. A mapping table connects each campaign ID to the UTM source, medium and campaign values its links carry, because names get renamed and IDs do not. (The demo joins on names, which works only because they are clean.)
- Sessions: one row per session, with source, medium and campaign taken from the UTM tags on the ad’s link, so they are only as consistent as those tags.
- Orders: one row per order, with its status, its customer and the session it was placed in, linked as described above.
- Order lines: one row per product in an order, with the price paid.
- Customers: one row per customer, with the date and ID of their first completed order, so “new” is decided once. Guest checkouts, several emails per person and wallet payments make “one customer” a matching rule the analyst writes down, not a given.
- A traffic source list that maps every source, medium and campaign to a channel, used by spend and sessions alike.
- Spend is never joined directly to sessions or orders below its own level of detail.
Definitions, in plain language next to the SQL
New customer, cost per new customer, order value (excluding VAT or sales tax; discounts and shipping as finance decides; returns reflected through the order’s status), return on ad spend, conversion rate, which date an order belongs to, the attribution rule. One line each, agreed by marketing and finance together, not by whoever builds it.
Requirements to state up front
- One time zone for every source’s dates, because ad platforms, analytics and the shop can each report days in a different one.
- One currency rule: which exchange rate, taken on which date, for spend charged in another currency.
- Platform-reported conversions kept as their own labelled figure, never added to or mixed with orders.
- Freshness: how current must spend be? Daily is usually enough for a weekly decision.
- History: how many months of visits are kept, because that sets the longest look-back you can ever analyse.
- Match rate: the share of orders linked to a visit, reported next to every attribution result.
- A closed month means closed by finance. Order statuses are frozen at close: a late or partial return, or a chargeback, posts to the month it happens, not back into the closed month, unless a written restatement rule says otherwise.
- Two total checks: first, spend in the model equals spend in the ad accounts for a closed month; then marketing cost ties to the general ledger for that month, which also holds platform credits, card currency charges, VAT and agency fees the ad accounts never see.
The bridge to finance’s figure, for one closed month
| Line | Amount |
|---|---|
| Marketing’s figure: paid media cost per new customer | [ ] |
| + Costs outside the ad accounts (agency, affiliates, influencers, tools, salaries) | [ ] |
| ± Accruals and dating (spend that ran but was not invoiced, retainers) | [ ] |
| ± New-customer definition (first order vs first payment or first paid charge) | [ ] |
| − Returns and chargebacks at close | [ ] |
| = Finance’s figure | [ ] |
| Unexplained | [ ] |
What you are not asking for
Not a dashboard. Not a specific attribution model. Not a tool. Those follow from the model; they do not replace it.
What your analyst will push back on
What your analyst will push back on
All three are fair.
- “We can’t match every order to a visit.” Usually true. Agree to ship with the match rate reported openly, and treat raising it as separate, funded work.
- “Keeping every visit is expensive.” Often true. A common compromise is full detail for a rolling window, longer than your customers take to decide, and daily totals beyond it.
- “Which attribution model do you want?” The right answer is “I want to be able to switch.” If the model stores visits and orders rather than attributed revenue, this stops being a decision you have to get right on day one.
Where OWOX Data Marts fits
OWOX Data Marts is one way to hold this model in your own warehouse (Google BigQuery, Snowflake, AWS Redshift, AWS Athena or Databricks), so the definitions outlive any one BI tool. It does not write your analyst’s SQL or decide your definitions. Each table becomes a Data Mart with a description and an owner, the joins are declared once as relationships, and together they form your model. Reports send a Data Mart to Google Sheets on a schedule, to Microsoft Excel through an add-in you refresh from the workbook, or to Data Studio.
What the product answered when we asked it for the same month
The demo shop is also a project in OWOX Data Marts, published as the E-Commerce data model of 12 Data Marts. On 11 October 2026 we asked its Unified Ad Spend Data Mart for September spend by channel, through the query_data_mart tool of the OWOX MCP server, the interface an AI assistant uses (the rows it returns go to the assistant’s provider), with the channel name taken from the joined Traffic Sources Data Mart:
{
  "data_mart_id":
    "c36e7a4e-e6c0-49ca-99f2-d8440d475363",
  "fields": ["source", "medium",
    "traffic_sources_e_commerce__channel_grouping",
    "spend"],
  "aggregations": [
    {"field": "spend", "function": "SUM"}],
  "filters": [{"field": "date",
    "operator": "between",
    "value": {"from": "2026-09-01",
      "to": "2026-09-30"}}],
  "sort": [{"field": "spend",
    "direction": "desc"}],
  "limit": 20
}| Source | Channel (joined) | Data Mart, as returned on 11 October 2026 | Warehouse view, the SQL above |
|---|---|---|---|
| blank | $4,875.15 | $487.52 | |
| Paid Marketing | $4,005.88 | $4,005.88 | |
| tiktok | Paid Marketing | $3,114.51 | $3,114.51 |
| bing | Paid Marketing | $2,840.03 | $2,840.03 |
| Paid Marketing | $2,386.70 | $2,386.70 | |
| blank | $1,156.08 | $1,156.08 | |
| blank | $109.13 | $109.13 | |
| Total | $18,487.48 | $14,099.85 |
The table is a snapshot of 11 October 2026, and the total was not ours. Six platforms agreed to the cent. Reddit differed by exactly ten times, $4,875.15 against $487.52.
The next day the gap was traced to one line. Reddit reports spend in millionths of a currency unit, so the SQL has to divide it by 1,000,000. The warehouse view does. The demo Data Mart’s SQL divided by 100,000: a divisor with five zeros where there should be six. Both read the same source table, so nothing else differed. The warehouse view is right: Reddit spend for September was $487.52 and the month’s total $14,099.85, the figures used everywhere else in this guide. Once that line is corrected, the same call should return $14,099.85, not the $18,487.48 shown above.
It is a typo in a demo project, not in anyone’s production data, and it was found only because two copies of the same logic were compared. Either copy on its own looked plausible. That is the argument of this guide in one line of SQL: keep one definition, and check its total against the ad account.
Two smaller things the trace shows. The join did not multiply or drop anything: with spend as the starting table, all seven platforms stayed in. And three platforms came back with a blank channel, $6,140.36 of spend in that snapshot ($1,752.73 with Reddit at its correct figure), because their campaign values have no partner in the traffic source list. Kept and visibly unlabelled is better than silently dropped, but it is still spend nobody has assigned to a channel.
How the product builds joins, and why the starting table decides which unmatched rows survive, is in the documentation: joinable Data Marts and Design a Data Model. For other kinds of business there is the library of data models.
How to tell whether it worked
Three tests, none of which needs you to read code:
- The same definitions behind every answer, and a calculation you can open. Every figure in a spreadsheet or dashboard names its written definition, and anyone can open the query behind it.
- Spend in the model equals spend in the ad accounts for a closed month, to the cent, and marketing cost ties to the general ledger.
- Marketing’s figure and finance’s are reconciled to each other for a closed month, and where they differ, each difference has a name in the bridge. That is the sign the definitions are written down rather than accidental.
For the finance lead or CEO who asked
For the finance lead or CEO who asked
Forwarding this? Replace the figures in square brackets with your own.
You asked why marketing’s cost per new customer differs from yours. Here is why the two figures differ.
The figures count different things. For [September], our two figures are, side by side:
- Paid media cost per new customer: ad spend of [$14,099.85] over [9] new customers whose last visit before ordering came from a paid click, [$1,566.65] each.
- Fully loaded cost per new customer: the same customers, with agency fees, affiliate and influencer costs, tools and salaries added on named lines, [$x] each.
Yours may also differ because finance accrues spend that ran but is not invoiced yet to the month it ran. That is accrual accounting, and the model should follow it. You own cost, so you choose which figure goes on the board slide.
Order value is not revenue. Our figures count what customers paid for orders that were not cancelled or returned, excluding VAT or sales tax, with discounts and shipping treated the way you decide. Revenue is what finance recognises in the accounts, and finance owns that definition. Ours should reconcile to it, with the difference explained in a sentence.
What we are fixing. Our analyst is setting up the data so that spend, visits and orders are combined at the same level of detail, which stops figures being counted twice. Then each number we report gets one written definition, agreed with you, and we bring you a bridge from our figure to yours for one closed month, tied to the general ledger.
What only you can do. Give us one meeting with finance to agree the definitions: what makes a customer new, whether cost includes agency fees, tools and salaries, and which date an order belongs to. Finance decides revenue; marketing names its own figures and shows how they reconcile to yours, on a closed month. Where we cannot agree, [the CEO] decides, and after the meeting [our analyst] keeps the written definitions and changes them only when we both agree.
What it costs. Nothing to buy for the first step. It takes the analyst’s time to set the data up and one meeting of finance’s and marketing’s time.
What to expect. When the figures are first lined up, part of the gap will not be explained yet. Whatever is left is the first thing we investigate.
One question for the next meeting: “Which cost per new customer is this, and where is it written down?”
Turn your data into decisions.
Governed data marts give you the clean foundation ML needs to actually work.
- No AI hallucinations
- Analyst-governed definitions
- Every number traces to SQL
Frequently Asked Questions
What is a marketing analytics data model?
It is the agreed structure behind your marketing numbers: which tables exist (ad spend, sessions, orders, order lines and a channel list), what one row in each stands for, how they join, and one written definition for every metric you report. It is not a dashboard and not an attribution model.
Why do marketing and finance report different cost per order?
Usually for three reasons: spend, visits and orders were joined at different levels of detail, so figures repeat; rows with no match were dropped by the join; or each team used a different definition, such as paid orders against all orders. The first two are fixed in the model, the third is agreed with finance.
What does grain mean in a marketing data model?
The grain is what one row of a table stands for. Ad spend is usually one row per day and campaign, sessions one row per visit, orders one row per order. Tables at different grains are each summed to a shared level, such as day and campaign, before they are joined, or spend is repeated once per visit.
Should attributed revenue be stored in the data model?
No. Store the facts (spend, visits, orders and which visit each order came from) and apply the attribution rule on top, labelled. A stored attributed-revenue column freezes one rule into your history, so changing the rule later means recomputing everything.
Who decides the metric definitions in a marketing data model?
The business does, with finance; the analyst implements each definition once, next to the data. Finance owns the definition of revenue. Marketing names its own figures, such as completed order value or cost per paid order, and shows how they reconcile to finance's.
Does OWOX Data Marts stop a join from counting spend twice?
For declared relationships, yes: according to the OWOX documentation, the join SQL is generated with proper aggregation, so joining a one-to-many Data Mart never multiplies the rows of the main one, and the query can be previewed. Your analyst still writes the SQL of each Data Mart and decides which table a report starts from.