Marketing data model: a free lead-gen funnel template
Every marketing team wants the same answer: which spend produced which revenue. The reason it stays hard is that the answer depends on how you assign credit, and most schemas bake one credit rule into the data itself. Once “attributed revenue” is a stored column, you are locked into whatever rule was in force the day it was written.
This template does the opposite. It models marketing touches at their natural grain — one row per touch — and keeps the credit rule out of the schema entirely.
First-touch, last-touch, linear, position-based: each becomes a query you run against the same touch table, not a migration you run against your warehouse.
It’s one of nine in our data model template gallery;
this one is built for B2B marketing and lead-gen funnels.
If the question you were asked is why marketing’s cost per new customer differs from finance’s, start with what to ask your analyst for in a marketing analytics data model.
What a B2B marketing data model is
What a B2B marketing data model is
A marketing model is the set of tables and relationships that connect spend, people, and revenue so you can trace a closed deal back to the campaigns that earned it. In B2B lead-gen the path is long and non-linear: an ad click, a webinar, three emails, a demo request, then a sales cycle that closes months later. A good model has to hold all of that without collapsing it into a single “source” field.
That is where it differs from a simple report. A spreadsheet of “leads by channel” throws away everything except the one channel it decided mattered. A proper dimensional model keeps every touch, every campaign, and every stage transition as its own record, then lets you join them however the question demands. If you are new to the shape of these models, start with our guide to data modeling and our explainer on understanding star schema.
The B2B marketing template, mart by mart
The B2B marketing template, mart by mart
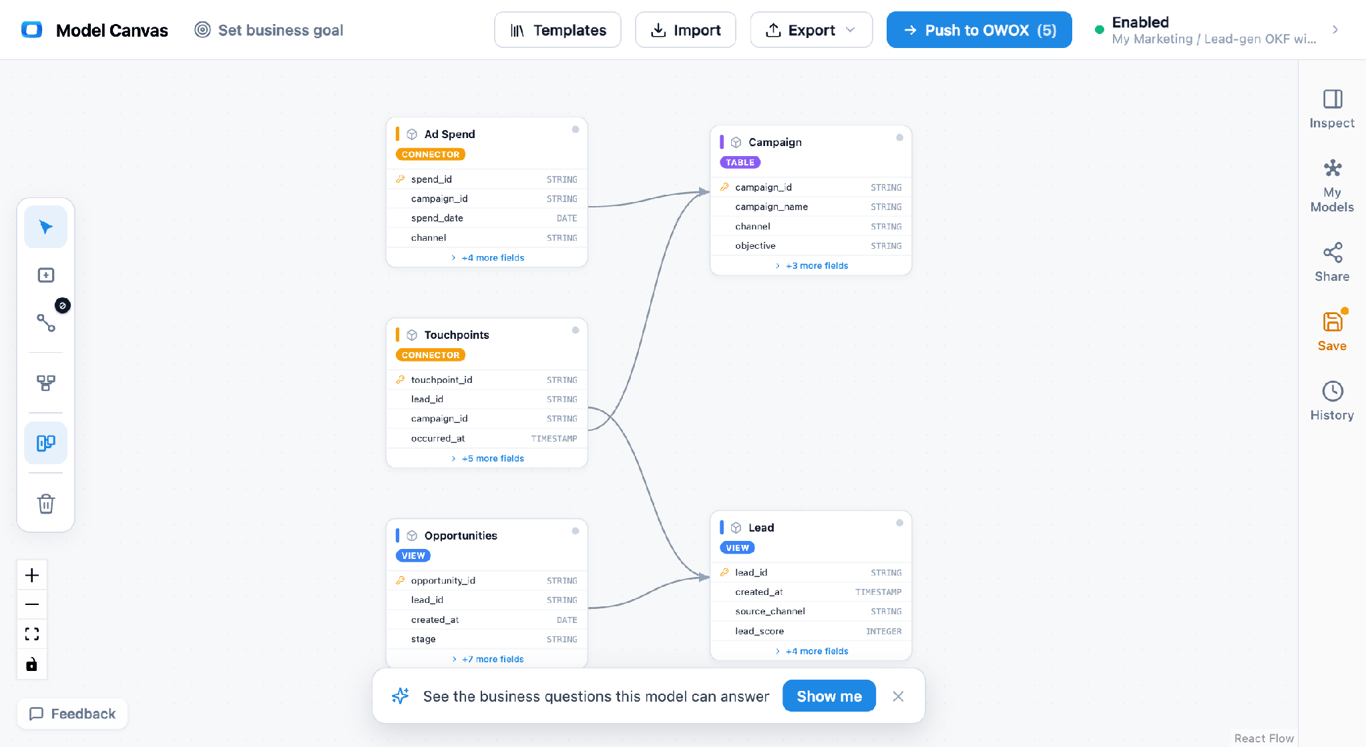
Entity relationship diagram of a B2B marketing data model: a central Touchpoints fact joined to Lead and Campaign dimensions, with Ad Spend and Opportunities facts hanging off Campaign and Lead. Open the B2B marketing model in the canvas →
• Campaign (dimension) — one row per campaign. Columns: campaign_id (PK), campaign_name, channel, medium, start_date, end_date. This is the spine every spend and touch record hangs off.
• Ad Spend (fact) — one row per campaign per day. Columns: spend_id (PK), campaign_id (FK → Campaign), date, cost, impressions, clicks. This is where budget lives, at a daily grain so you can align cost with the touches it bought.
• Lead (dimension) — one row per person. Columns: lead_id (PK), email, source, created_date, mql_date, company. The source here is the first-known origin; it is a convenience field, not the attribution answer.
• Touchpoints (fact) — the central fact. One row per marketing touch: an ad click, an email open, a form fill. Columns: touch_id (PK), lead_id (FK → Lead), campaign_id (FK → Campaign), touch_type, touch_timestamp, channel. Every interaction a lead has with marketing lands here, in order.
• Opportunities (fact) — one row per opportunity. Columns: opportunity_id (PK), lead_id (FK → Lead), stage (MQL → SQL → Won), amount, created_date, close_date. This is where revenue enters the model.
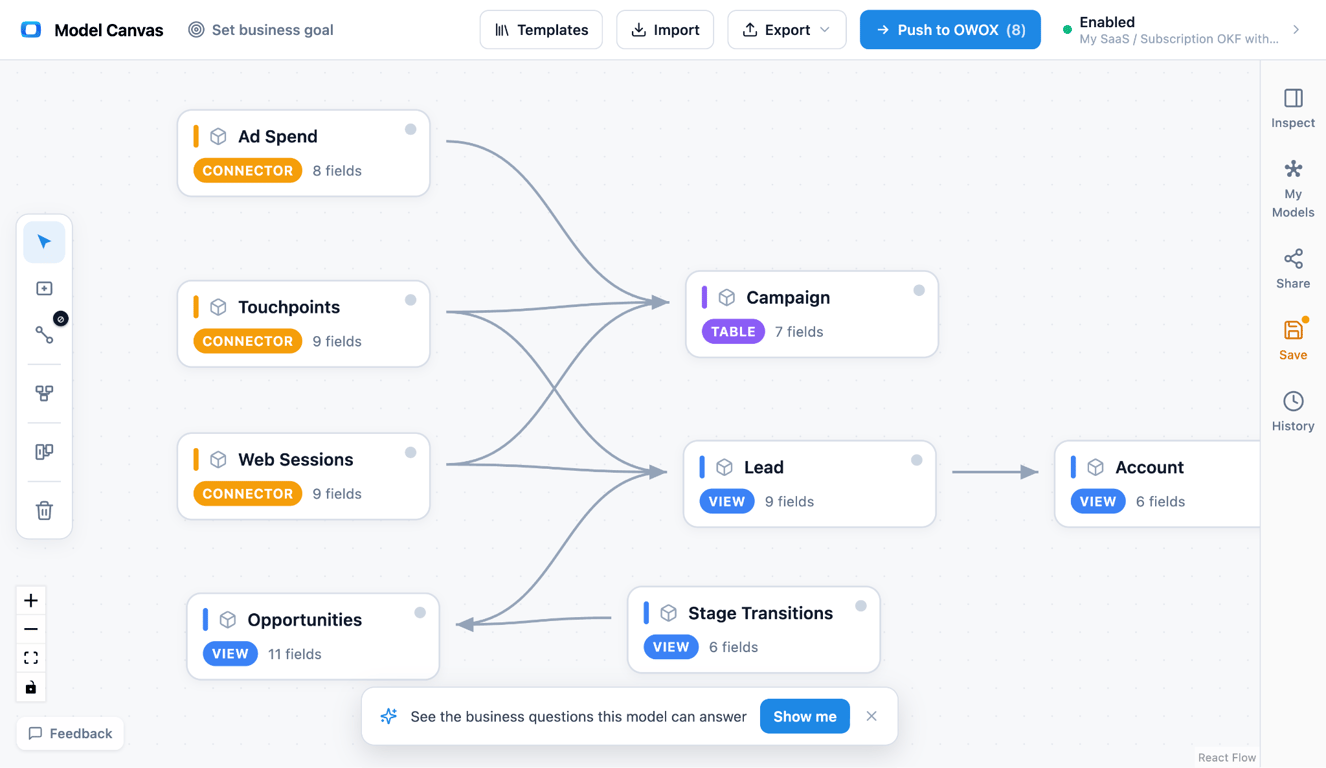
The joins make it a star: Ad Spend → Campaign, Touchpoints → Campaign, Touchpoints → Lead, and Opportunities → Lead. Campaign and Lead are the shared dimensions; Touchpoints sits in the middle as the fact that ties spend to people, and Opportunities ties people to money. For more on why this layout scales, see our approach to data marts.
OWOX Data Marts
See your first report built in real time. 15 minutes.
- Connect your data warehouse
- Pick your metrics
- Get a live Google Sheets report
In the time it takes to write a ticket. Then imagine never writing that ticket again.
Book a DemoWe'll use your actual use case
The touch grain is the whole point
The touch grain is the whole point
The single most important decision in this model is the grain of the Touchpoints fact: one row per touch. Not one row per lead, not one row per “attributed conversion” — one row for every individual interaction, timestamped and linked to both the lead and the campaign that produced it.
That grain is what makes attribution a query instead of a schema decision. Because every touch is preserved in order, first-touch is “the earliest touch for this lead,” last-touch is “the latest touch before the opportunity,” and linear is “split the opportunity amount evenly across all touches.” Position-based, time-decay, or a custom model — all of them are just different GROUP BY and weighting expressions over the same rows. You never rewrite the data; you rewrite the query. Nothing about credit is stored, so nothing about credit can go stale.
This is a classic transaction-grain fact table, and getting the grain right is what keeps it honest. For the underlying theory, see the three types of fact tables and our deeper walkthrough of dimensional data modeling.
What this model answers
• Which channel drove the most closed revenue last quarter? Touchpoints → Campaign for the channel, Touchpoints → Lead → Opportunities filtered to Won, credited by your chosen model.
• What is our cost per MQL by campaign? Ad Spend → Campaign for cost, counted against Lead rows where mql_date falls in the window.
• How does first-touch attribution compare to last-touch for the same deals? Run both credit rules over the same Touchpoints rows and diff the result — no data changes.
• What is the average number of touches before an opportunity reaches SQL? Count Touchpoints per Lead up to the Opportunities stage transition.
• Which campaigns generate leads that never convert? Touchpoints → Campaign joined to Lead, with no matching Won row in Opportunities.
This model vs attribution baked into the schema
This model vs attribution baked into the schema
The naive approach stores an attributed_campaign and attributed_revenue column on each lead or deal, computed once by whatever rule was live at write time. It reports fast — until someone asks for a different attribution model, and the only honest answer is a backfill.
| Aspect | Attribution baked in (rigid last-click) | This template (touches at grain) |
|---|---|---|
| Credit rule | Hard-coded when the row is written | Chosen at query time |
| Switching models | Requires reprocessing history | Change the GROUP BY, rerun |
| Multi-touch views | Not possible — one campaign per deal | Native — every touch is kept |
| Auditability | Trust the stored number | Recompute from raw touches anytime |
| New channels | Schema change to fit the credit field | Just more rows in Touchpoints |
How to open and customize the template
How to open and customize the template
(1) Open the template in the canvas using the link above — it loads with all five marts and their joins already drawn.
(2) Reshape it to your funnel: rename channel values, add a region to Campaign, or add a lead_score to Lead. Add columns without breaking the joins.
(3) Set grain and keys deliberately. Keep Touchpoints at one row per touch, keep every PK unique, and keep the FKs pointing at Campaign and Lead. The grain is the contract — protect it.
(4) Export the finished model and push it into OWOX Data Marts to run it against your real warehouse.
Want to sketch variations first? Our roundup of free database diagram design tools covers the options.
Export to OKF: a portable B2B marketing model
Export to OKF: a portable B2B marketing model
The model exports to OKF, an open, plain-text format that describes every mart, column, key, and join. That means this template is not trapped in one tool — you can version it in Git, review changes in a pull request, and hand it to a teammate who rebuilds it exactly, joins and grain intact. Learn more about what OKF is.
Because the attribution logic lives in your queries rather than the schema, the OKF file stays small and stable: it describes the touch grain and the relationships, and every credit rule you ever run is downstream of it. That is what makes it portable across warehouses and teams. Open the B2B marketing model to see the export for yourself.
Ask this model a question
The template above is a diagram you can edit. The same business is also published as a ready Marketing Leadgen Data Model of 8 Data Marts with their relationships, which can be imported into OWOX Data Marts. Once it is in your project, a business user can ask it a question in Claude or ChatGPT through the OWOX MCP server.
Data Model: Marketing Leadgen (8 Data Marts)
Prompt: “Which campaigns sourced the most closed-won revenue, and what did each cost in ad spend?”
The reason to ask the Data Model and not the warehouse is what the assistant gets to read.
| Asked of raw tables | Asked of the Data Model | |
|---|---|---|
| What the assistant sees | Every table in the warehouse | The published Data Marts and their declared joins |
| What it does | It joins leads to opportunities row by row, so a deal with several contacts at one account is counted once per lead and pipeline is overstated | It reads the Opportunities Data Mart, which is keyed to the account and carries the sourcing campaign, and relates it to Ad Spend through Campaign |
| What you get | A plausible number with no way to check it | The number, and the query that produced it |
MCP is only the way the question arrives. What makes the answer safe is the Data Mart behind it: SQL an analyst wrote and published, which the assistant reads and does not write. A question the Data Marts do not cover is not approximated. It goes back to the data owner. More on how that works in governed MCP analytics.
Turn your data into decisions.
Governed data marts give you the clean foundation ML needs to actually work.
- No AI hallucinations
- Analyst-governed definitions
- Every number traces to SQL
Frequently Asked Questions
Is the OKF export tied to a specific warehouse?
No. OKF is a plain-text description of marts, keys, and joins, independent of any database. You can rebuild the same model on BigQuery, Snowflake, or elsewhere, and version it in Git like code.
What columns do I need to calculate cost per lead?
You need `cost` from Ad Spend, `campaign_id` to join to Campaign, and Lead rows with `created_date` or `mql_date`. Sum cost per campaign and divide by the leads it produced in the window.
How is this different from last-click attribution in my ad platform?
Ad platforms report last-click credit computed inside their own walls, one channel per conversion. This model keeps every touch across every channel, so you can reproduce last-click and also run first-touch, linear, or a custom model side by side.
Can I connect this model to my real marketing data?
Yes. Customize the marts in the canvas, export the model, and push it into OWOX Data Marts to run it against your warehouse, where Ad Spend, Lead, Touchpoints, and Opportunities map to your actual sources.
What is the grain of the Touchpoints table?
One row per individual marketing touch — a single ad click, email open, or form fill — timestamped and linked to both a lead and a campaign. Keeping this grain is what makes flexible attribution possible.
How does this template handle attribution?
It stores every marketing touch as its own row and keeps no credit rule in the schema. First-touch, last-touch, linear, and position-based attribution are all queries over the same Touchpoints table, so switching models never means reprocessing data.
What is a marketing data model?
It is the set of tables and relationships that link marketing spend, leads, touches, and revenue so you can trace closed deals back to the campaigns that earned them. In B2B it centers on a touch-grain fact table joined to campaign and lead dimensions.