Do you need a semantic layer? Data model vs Data Mart vs the layer
Not as a first step: you do not have to finish a semantic layer before your reports can agree. A data model, a Data Mart and a semantic layer are three different things, needed in that order, and only the last is a product you buy. This guide separates the three, gives you something to do this week, and says plainly when a semantic layer product is the right choice.
“Do we need a semantic layer, or do a data model and a Data Mart come first?” The question usually comes from a founder or a finance lead, after a meeting where two reports showed two different revenue figures and a consultant’s slide said “semantic layer first”. It lands on the analyst, who has to answer it and will live with whatever the answer commits the team to.
Not as a first step. “Semantic layer first” is dead: you do not have to finish a semantic layer before your reports can agree. What comes first is a data model and one Data Mart for the number you argue about. The semantic layer as a product is alive, it comes last, and for some teams it is the right choice. This guide is about reports and dashboards. Whether an AI agent needs a semantic layer is a different question, and this guide does not answer it.
If you are the person who asked, go to the last section, “What to send back to the person who asked”. It is written for your analyst to send you, in plain words, and it names the one thing only you can do.
This guide is written by OWOX. We make OWOX Data Marts, which builds a data model out of Data Marts and is not a semantic layer product, so we have a commercial reason to tell you to skip one. The body says when a semantic layer product is the right choice.
The short answer
Start with the data model and one Data Mart; add a semantic layer only if you outgrow them. The reason is plain: numbers disagree because nobody decided what the number means, and no product makes that decision. Once it is made, it has to be written in one place that every report reads. A semantic layer product is one such place. A view in your data warehouse is another: a saved query that behaves like a table, which your warehouse already supports.
The product itself is not going away. Among 459 data practitioners surveyed by dbt Labs in late 2024, 27% intended to increase investment in semantic layer tooling in the next 12 months (dbt Labs, 2025). That survey does not describe a team of one or two analysts.
If you already run a semantic layer and your reports read from it, keep it and add nothing, ours included.
Semantic layer vs data model vs Data Mart
Semantic layer vs data model vs Data Mart
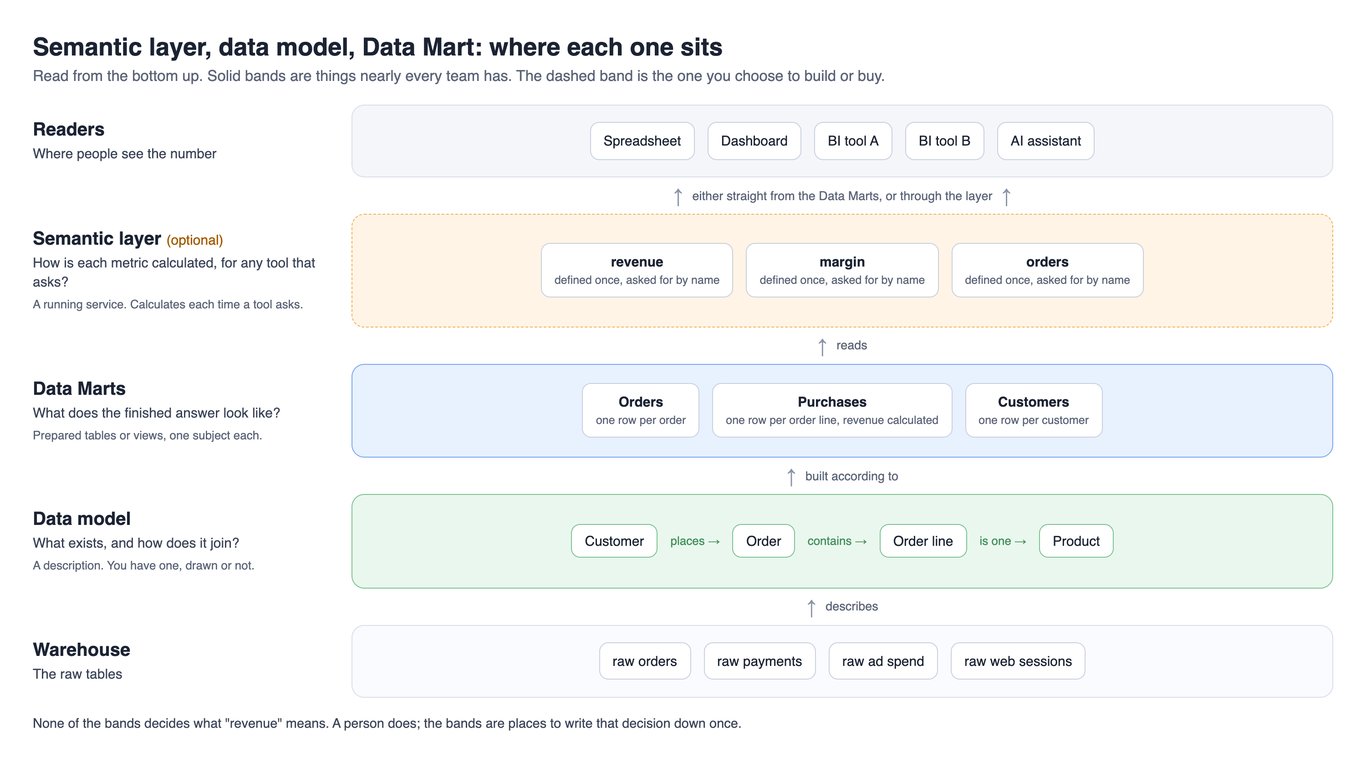
The three terms get compared as if they were rival products. They answer three different questions, and most teams end up with all three in some form.
A data model says what the business tracks and how those things connect: customers, orders, products, and the keys that join them. IBM describes data modeling as creating a visual representation of an information system “to communicate connections between data points and structures” (IBM).
A Data Mart is data prepared for one subject or one team. IBM’s definition: “a subset of a data warehouse focused on a particular line of business, department or subject area” (IBM). In practice it is a table or a view that already holds the answer: one row per order line, with revenue calculated.
A semantic layer is a service between the warehouse and the tools that read it. Each metric is defined there once, and every tool asks for it by name; the layer writes the query. dbt Labs says its Semantic Layer works by “centralizing metric definitions” so that teams share them “regardless of their tool of choice” (dbt documentation). Cube says a semantic layer “defines metrics, dimensions, joins, grain, and access policies once”, where grain means what one row stands for (Cube). LookML is Looker’s way of doing it: Google describes it as the language used in Looker “to create semantic data models” (Google Cloud).
| Data model | Data Mart | Semantic layer | |
|---|---|---|---|
| The question it answers | What exists, and how does it join? | What does the finished answer look like? | How is each metric calculated, for any tool that asks? |
| What it is | A description | A table or view | A running service with its own definition files |
| When the number is calculated | It is not | When the table or view is built or read | Each time a tool asks |
| Do you have one already? | Yes, drawn or not | Probably: any reporting view counts | Only if you built or bought one |
All pages quoted in this guide were read on 10 and 11 October 2026.
OWOX Data Marts
See your first report built in real time. 15 minutes.
- Connect your data warehouse
- Pick your metrics
- Get a live Google Sheets report
In the time it takes to write a ticket. Then imagine never writing that ticket again.
Book a DemoWe'll use your actual use case
Why the numbers disagree: one table, two revenues
Why the numbers disagree: one table, two revenues
The smallest form of the disagreement is two sums over one table. In our demo store, every order line at its sale price adds up to one revenue, and the same lines with cancelled and returned orders counted as zero add up to another, about 15% lower. Both are correct. The worked example, with its query, is in what a semantic data model is.
No layer, model or Data Mart can tell you which of the two is revenue. A person with authority decides, and then every tool has to be made to read that one decision. What that decision needs, one written definition for each number, one named owner and one place every report reads it from, is laid out in everyone in the meeting has a different number. Further down we run that second part on our own demo and print what came back.
What to do this week, with what you already have
What to do this week, with what you already have
None of this needs a new tool.
- Pick the one number people argue about most. One, not twenty.
- Find every place that calculates it. The SQL behind the reporting table, each dashboard’s own formula, each spreadsheet. Write the list down. Its length is the size of your problem.
- Write the definition on half a page. What the number counts, what it leaves out, what one row is, and who decides when it changes. Have the person who asked the question sign it. This step depends on other people, and it is usually the slow one.
- Put the rule in one place. A view in the warehouse is enough: one query that applies the rule, with a name people recognise. If you use dbt, a dbt model that builds that table counts as the same thing. Either is a Data Mart in the general sense of the term, before any product is involved.
- Point every report at that view and delete the other formulas, so the list from step 2 shrinks to one line.
- Test it. Change the rule on purpose and count how many files you had to open. The target is one.
Do this for one number, note what each step cost you, and estimate the rest from that. None of it is thrown away if you later buy a semantic layer: dbt Labs, for one, has teams “define metrics on top of existing models” (dbt documentation). If the list in step 2 keeps growing back, you have learned that you need something more, and you know why.
What happened when we ran the steps on our own demo
What happened when we ran the steps on our own demo
We ran steps 2, 5 and 6 on 11 October 2026 against [Demo] E-commerce, our own demo project. Everything was read-only: queries in Google BigQuery on the owox-demo.ecommerce dataset, and field lists and sums read through the OWOX Data Marts connector. It is demo data and it grows every day, so the totals are true for that date only.
Step 2, find every place that calculates revenue. We expected one and found four.
- The
purchasesview, with two fields and a written rule on each. Item revenue: $8,868,616.14. Item net revenue, completed orders only: $7,527,223.87. - A Data Mart called “eCommerce Report”, with its own
REVENUEfield and no description. Its total is 15,174. Three more Data Marts carry the same title; we opened one. - A Data Mart called “e-Commerce Growth Demo”, with its own
revenuefield in whole numbers and no description. Its total is about 16.3 million. - The “Shopify Orders” Data Mart, which carries the shop platform’s own two figures: total price $2,971,067.49 and subtotal $2,681,620.41.
Places 2 to 4 sit on other sample datasets, so their totals are not meant to match the first. The finding is the count, and that only one of the four says what it counts. A fifth meaning hides in the ad spend query: the sales value each ad platform claims for itself.
The two sums in place 1 come from this query:
SELECT
  ROUND(SUM(line_revenue), 2)
    AS item_revenue,
  ROUND(SUM(line_net_revenue), 2)
    AS item_net_revenue
FROM
  `owox-demo.ecommerce.purchases`
Step 5, count what reads the one definition. On 11 October, 25 reports read the Purchases Data Mart: 22 in Google Sheets, one in Slack, one Excel workbook and one dashboard source. The count changes as reports are added. 17 of them select a revenue field, and none of the 17 holds a formula of its own. Six more export sale price and quantity with no revenue field. Anyone who multiplies those columns in the sheet has made a new formula, and we cannot see inside the sheets.
Step 6, change the rule and count. This step is simulated. The change: stop counting returned orders as item revenue. The view is read-only for us, so we did not edit it. A named subquery stands in for the edited view:
WITH purchases_changed AS (
  SELECT
    p.sale_price,
    p.quantity,
    IF(o.status = 'Returned',
       0, p.line_revenue)
      AS line_revenue
  FROM
    `owox-demo.ecommerce.purchases` p
  JOIN
    `owox-demo.ecommerce.orders` o
    USING (order_id)
)
SELECT
  ROUND(SUM(line_revenue), 2)
    AS reads_the_view,
  ROUND(SUM(sale_price * quantity), 2)
    AS own_formula
FROM purchases_changed| Before the change | After the change | |
|---|---|---|
| A report that reads the view | $8,868,616.14 | $8,435,391.53 |
| A report with its own formula | $8,868,616.14 | $8,868,616.14 |
| Definitions edited, rule in one view | 1, for all 17 reports | |
| Definitions edited, rule in each report | 17 |
The $433,224.61 between the two rows is the returned orders. The second row follows from how the query is built: a formula that never reads the view cannot change when the view does. We did not watch a real report go stale. What the simulation shows is the size of the gap and that nothing in the query fails.
What this run does not show: how long the work takes a person, because we did not time one, and how it goes in a company where the four places belong to four teams.
How OWOX Data Marts does the same job
How OWOX Data Marts does the same job
In OWOX Data Marts, a Data Mart is defined on a SQL query, an existing table or an existing view in your warehouse. Each output field gets a business name and a description, and joins to other Data Marts are declared on keys (Joinable Data Marts).
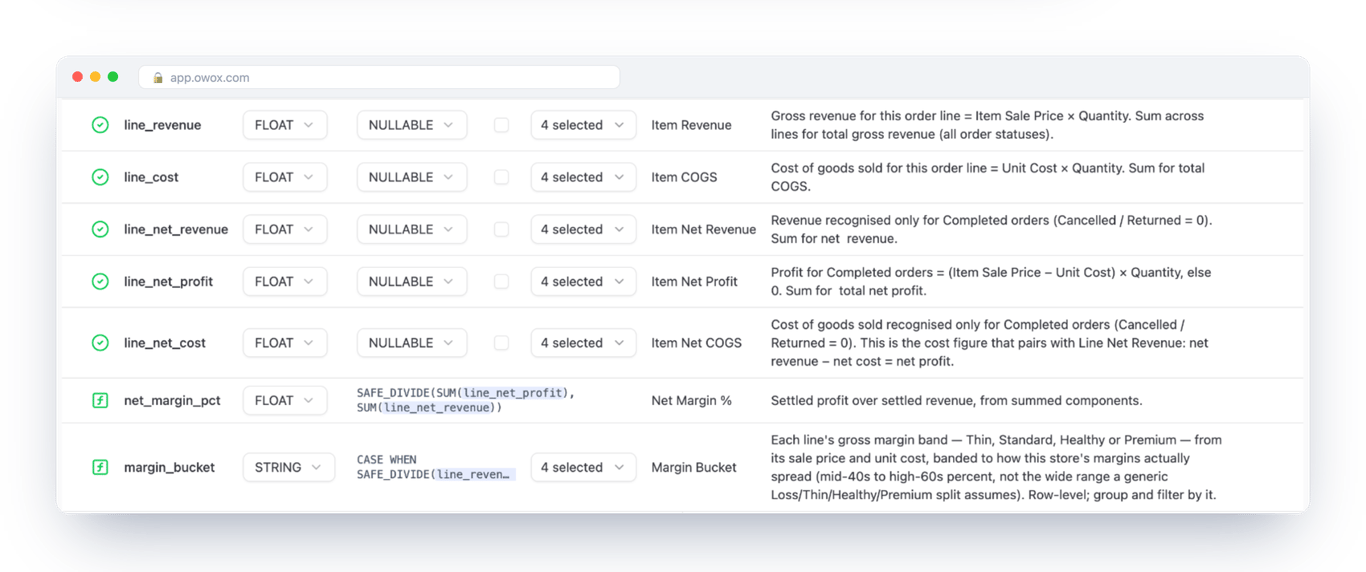
Together the Data Marts and their relationships form the model. Reports on a Data Mart go to Google Sheets, Microsoft Excel, Data Studio, Slack, Microsoft Teams, Google Chat or email (destinations).
What it does not do:
- It does not decide the definition. Step 3 is still yours.
- It does not write the SQL. The analyst defines every Data Mart.
- It does not join across warehouses. The documentation says both Data Marts in a relationship “must live on the same storage”.
- It does not cover what nobody defined. A metric that is in no Data Mart is not there to report on.
More on one Data Mart’s fields: governed metrics with output schemas.
When a semantic layer product is the right choice
When a semantic layer product is the right choice
A semantic layer earns its keep when the same metric has to be calculated on request, in many shapes, for many readers. These are the signs:
- Several BI tools must agree. For example, a dashboard tool, a finance reporting tool and a spreadsheet each showing revenue to different people, each with its own formula. That is the problem a semantic layer was designed for. In our judgement, one BI tool plus a finance spreadsheet rebuilt from exports, the most common setup, does not reach this sign on its own: the fix is to feed the spreadsheet from the same definition (step 5).
- People slice metrics in ways you cannot list in advance. A layer calculates at whatever level the question asks. A view answers at the level it was built for.
- Someone owns it as their job. The layer has its own definition files, and they have to follow every change in the business. A simple check: is there a person whose job description would include it? This is our judgement, not a measured threshold: with an analytics engineering team it is routine work, and for one analyst it is a second job.
AI assistants answering from your data are a fourth case with their own evidence, such as a dbt Labs benchmark of April 2026 on 11 questions (dbt Labs). This guide leaves that question there.
One thing we could not confirm is how long it takes. You will see “6 to 12 months” quoted for a semantic layer rollout. We could not find a primary source for that range, so this guide gives no duration. We checked the pages that repeat it and the public page of the guide they cite, and did not open the gated PDF. The one figure we could open on a vendor’s own page points the other way: Strategy (the company formerly called MicroStrategy) offers, in its 2026 buyer’s guide, “a 6–8 week proof of value blueprint” (Strategy). That is a trial, not a rollout. Ask any vendor for a named reference customer of your size instead.
If you already have dbt, LookML or a Power BI semantic model
If you already have dbt, LookML or a Power BI semantic model
Then you already have most of what the consultants describe. Here is where a Data Mart would sit and what it would repeat.
Where it sits. On top of what you have. A Data Mart can point at the table or view your existing project builds, so no SQL is rewritten and your project stays the place where logic lives.
What it adds. A route from that table to the people who do not open a BI tool, such as finance rebuilding revenue in Excel from exports: reports into Google Sheets on a schedule, into Microsoft Excel through an add-in refreshed from the workbook, and into chat, and a connection for assistants. That connection is part of OWOX Data Marts Cloud, and the rows behind an answer are sent to the company that runs the assistant (documentation).
What it duplicates. Field descriptions, if your project already documents columns. Join declarations, if your layer already has them. Calculated fields, which are metrics by another name. Data quality checks, if you already run tests. Define a ratio in both places and you maintain two copies, which is the problem you set out to fix.
When to keep what you have and stop. If your BI tool reads your semantic layer and the people who need numbers are served by it, you do not need us for this problem.
What to send back to the person who asked
What to send back to the person who asked
The short version: we do not need to build a semantic layer first. Our reports disagree because “revenue” is calculated in more than one place, and the fix is to agree one definition and make every report read it. I will do that for one number this week and come back with what it took.
If we already run one (LookML, dbt metrics or a Power BI model), the short version is different: we already have the place for definitions. Our numbers disagree because finance rebuilds revenue in spreadsheets from exports, outside it. The fix is the same signed definition, with the dashboards and finance’s spreadsheet reading it from one place.
The longer version:
- A semantic layer, in plain words, is software between our reporting database (data warehouse) and our reports that calculates each number from one stored definition whenever a report asks. It suits companies with several reporting tools and a person whose job is to look after it.
- This week I will take the number we argue about most, list every place that calculates it, and write each version on half a page, side by side: sales’ revenue next to finance’s.
- I need you to read that half page and sign it, or tell me who can. You will be choosing between the versions, and that is the one step I cannot do for you.
- What the first number costs: one saved query in the data warehouse, one half page you sign, and my time to point each report at it. No new software and no outside project. I will tell you by Friday how many hours the first number took, so you can set it against the project in the consultants’ quote or the vendor’s deck.
- The worst case of waiting: one definition in one place turns out not to be enough for us. That would show while we work through the first few numbers, and nothing is lost, because a semantic layer would be built on the same signed definitions.
Turn your data into decisions.
Governed data marts give you the clean foundation ML needs to actually work.
- No AI hallucinations
- Analyst-governed definitions
- Every number traces to SQL
Frequently Asked Questions
What is the difference between a semantic layer and a data model?
A data model is a description of what the business tracks and how those things join: customers, orders, products and their keys. A semantic layer is a running service between the warehouse and the reporting tools that calculates each metric from one definition whenever a tool asks (dbt documentation). Every team has a data model, drawn or not. A semantic layer exists only if someone built or bought one, and it needs a sound data model underneath.
What is the difference between a semantic layer and a Data Mart?
A Data Mart holds the finished answer. IBM defines it as "a subset of a data warehouse focused on a particular line of business, department or subject area" (IBM); in practice it is a table or a view. A semantic layer holds the formula and calculates on request for any tool that asks. A Data Mart answers at the level it was built for, and a semantic layer can answer at any level its definitions cover. Many teams have both, with the layer reading from the Data Marts.
Do I need a semantic layer before my reports can agree?
No. Reports disagree because one metric is calculated in several places under different rules. The fix starts with one agreed definition written in one place, and that place can be a view in your warehouse. A semantic layer product becomes the right choice later, when several BI tools must share the same metrics (dbt Labs describes its layer as keeping definitions consistent "regardless of their tool of choice", dbt documentation), when people slice them in ways you cannot list in advance, and when someone can own the layer as part of their job. If you already have one and your reports read from it, keep using it.
Is a semantic layer the same as a semantic model?
No. A semantic layer is the service, and a semantic model is an object inside a product. In dbt, semantic models and metrics are defined in YAML files that MetricFlow reads to build queries (dbt documentation). In Power BI, semantic models "represent a source of data that's ready for reporting and visualization" (Microsoft Learn). The terms are separated in what a semantic data model is.
How long does it take to implement a semantic layer?
We could not find a primary source that measures it. Figures such as "6 to 12 months" are widely repeated, but we did not find where they were measured, so the article gives no duration. The one figure we could open on a vendor's own page is for a trial, not a rollout: Strategy (the company formerly called MicroStrategy) offers "a 6–8 week proof of value blueprint" in its 2026 buyer's guide (Strategy). Time one metric of your own, from agreed definition to working report, and estimate the rest from that.
Can a Data Mart in OWOX Data Marts sit on top of dbt models?
Yes. A Data Mart in OWOX Data Marts can be defined on an existing table or an existing view in your warehouse, so it can point at the table a dbt model builds and no SQL is rewritten. It adds field descriptions, declared joins, and reports to spreadsheets and chat. If your project already documents columns and defines metrics, keep those rules there and do not define them a second time in the Data Mart.