Text-to-SQL accuracy: what a benchmark score tells you about your own warehouse
An accuracy score for an AI tool that writes SQL is a measurement of one system on someone else's questions and someone else's data. This guide explains what such a score counts, reports a 25-question test we ran on our own demo warehouse on two setups with every miss shown, and gives the questions, the scoring query and the reference queries so you can run the same test on your data.

“The vendor says it’s 90% accurate. Is that good enough for our numbers?” If that question landed on you this week, whatever the number was, the honest reply is another question: 90% of what, on whose data, counted how?
If you are the person who asked, the last section is written for you: a reply your analyst could send you, in plain words. The rest is for the analyst who has to answer.
Public rankings quoted below were read on 11 October 2026 and other sources on 10 October. Rankings move, so check the linked page before you repeat one.
The short answer
An accuracy score describes one system answering someone else’s questions on someone else’s data. It is a real measurement, not a property of the AI model and not a forecast for your company.
Three terms, once. Text-to-SQL: an AI model turns a question into a SQL query and runs it. Benchmark: a public set of test questions with known answers. Leaderboard: the public ranking on a benchmark.
So the only test that says anything about your numbers is one run on your questions, against queries you would sign. We ran one on our own demo data. A model writing SQL from table and column names got 56 of 66 answerable runs right. Seven of the ten misses were plausible wrong numbers with no warning; the other three came back empty. The full result, with its limits, is two sections down. The wider question is in can you trust AI with your business numbers?
What a score of 90% would mean, if it held
What a score of 90% would mean, if it held
If your leadership asks twenty questions a week, 90% would mean two come back wrong, and nothing on the screen marks which two.
Most published scores are execution accuracy: the share of test questions where the SQL the system wrote returns the same rows as a reference query, the correct SQL written by a person (BIRD paper).
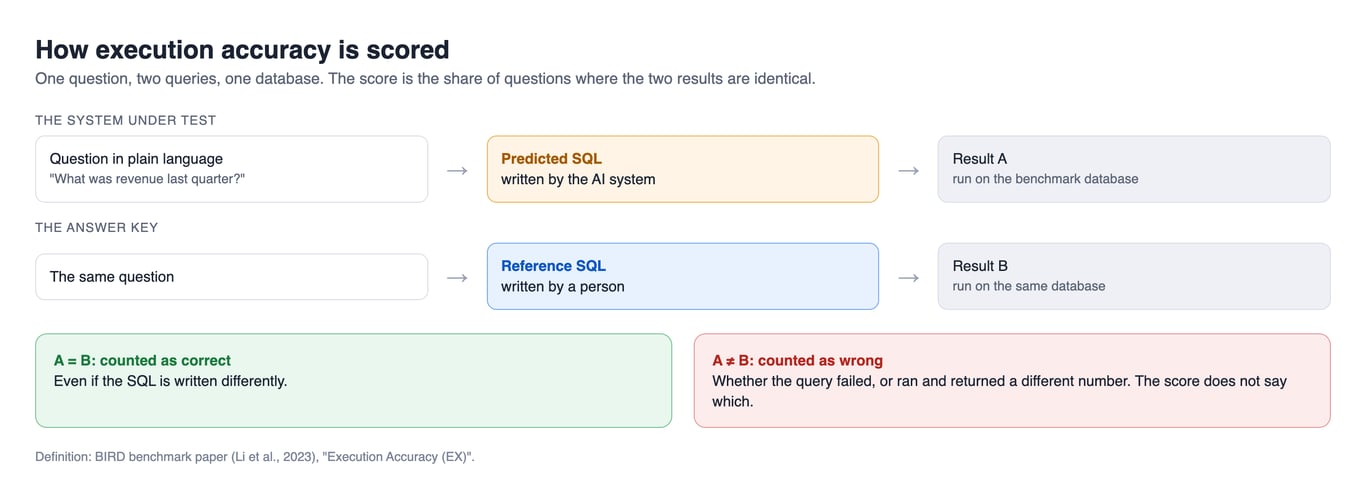
A failed query and a query that returned a different number both count as a miss, and the score does not say which. An error gets noticed. A wrong number gets pasted into a deck.
OWOX Data Marts
See your first report built in real time. 15 minutes.
- Connect your data warehouse
- Pick your metrics
- Get a live Google Sheets report
In the time it takes to write a ticket. Then imagine never writing that ticket again.
Book a DemoWe'll use your actual use case
We ran the test on our own demo warehouse
We ran the test on our own demo warehouse
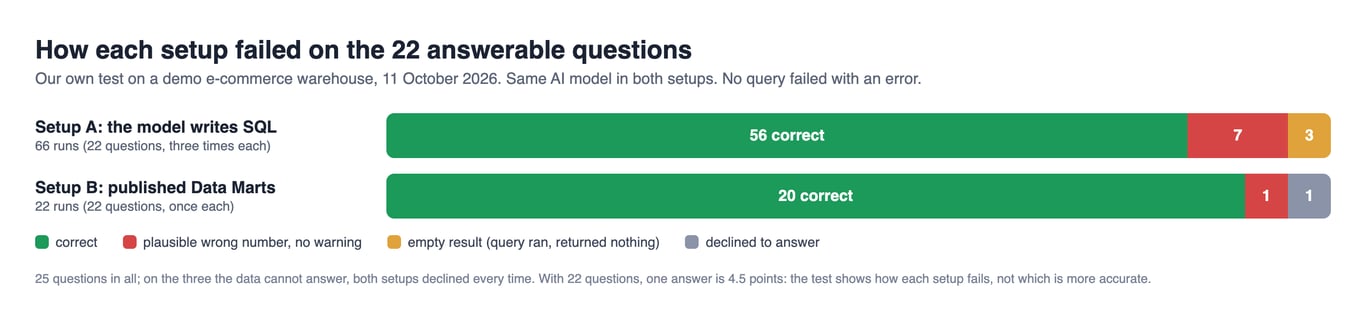
On 11 October 2026 we wrote 25 business questions about our demo e-commerce warehouse in BigQuery (12 tables) and a reference query for each of the 22 the data can answer. Three questions have no answer in the data, on purpose. Then we put the same questions to two setups, both using the same AI model, Claude Sonnet 5.5 (model id claude-sonnet-5-5).
- Setup A, the model writes SQL. It got the table names, column names and types, no descriptions, and had to return one query or say the tables cannot answer. Each question went to a fresh session three times: 75 runs.
- Setup B, published Data Marts. The model asked through the OWOX MCP server, the connection that lets an assistant such as Claude or ChatGPT query datasets an analyst has defined and described. It cannot write SQL there. Each question went to a fresh session once: 25 runs, 23 query calls.
A warehouse here is the database where a company keeps its data for analysis. The match rule was set before the runs: the same set of rows as the reference, numbers rounded to two decimals, column names and row order ignored.
| Outcome on the 22 answerable questions | Setup A (66 runs) | Setup B (22 runs) |
|---|---|---|
| Correct | 56 | 20 |
| Wrong number, plausible and unflagged | 7 | 1 |
| Wrong result, empty | 3 | 0 |
| Error | 0 | 0 |
| Declined | 0 | 1 |
On the three questions the data cannot answer, both setups declined every time: nine runs of nine in A, three of three in B.
What the misses looked like
Setup A missed ten times, and no query failed. Seven misses were a plausible wrong figure with nothing to flag it: the model summed gross revenue (line_revenue, every order) where the company’s revenue is net (line_net_revenue, completed orders only). Asked which category earned most in Q3 2026, it answered Electronics with $670,408.76 in all three runs; the reference is $573,984.92. The other three (question 18 in runs one and two, question 22 in run three) filtered on status = 'completed' in lower case while the data says Completed. Those queries ran and returned an empty value, which a reader would notice.
Setup B missed twice, in two different ways. Asked which channel brought in the most revenue, it led with gross revenue of $417,505.07 where the reference is net, $360,288.68; it gave net in a note, but the headline was wrong. Asked how many different customers ordered, it declined: the Data Mart did not allow a distinct count on the customer id, and it said so instead of estimating.
The same question, asked three times
Six of the 22 answerable questions in setup A were scored differently from one run to the next; only one was wrong all three times. “Revenue by month in 2025” came back net twice and gross once.
One result went against our expectation. “What was our revenue in Q3 2026?” was right in all three runs of setup A: a column called line_net_revenue was hint enough. The same model then chose gross on five other revenue questions. The definition was in the schema and was applied on some runs, not others.
How strong this evidence is
Not very, and in specific ways.
- It is 25 questions on demo data. One answerable question is four and a half points, so the gap between 56 of 66 and 20 of 22 does not show that either setup is more accurate.
- One model, one day. Setup A ran inside a general-purpose coding assistant, not a bare model or a text-to-SQL product.
- Setup A could not look at the data. It wrote SQL from column names and types alone, with no way to run a query or see a value. That is why the lower-case status filter slipped through; a system that can execute and inspect values would likely catch it.
- Setup B ran once per question, so it says nothing about its run-to-run variation, and it was scored on the rows it reported, not on the SQL in Run History.
- We wrote the questions, the references and the Data Marts. The demo schema is small and tidily named; a real warehouse is neither.
What the test does show is what a rate hides: how each setup fails. One returned seven unflagged wrong numbers and three empty results. The other returned one unflagged wrong number and one refusal.
Every question and every run
✓ correct, ✗ plausible wrong number, ∅ empty result, – declined. Setup A shows runs one to three.
| # | Question | A | B |
|---|---|---|---|
| 1 | What was our revenue in Q3 2026? | ✓ ✓ ✓ | ✓ |
| 2 | What was gross booked revenue in Q3 2026, counting every order whatever its status? | ✓ ✓ ✓ | ✓ |
| 3 | How many orders were placed in Q3 2026? | ✓ ✓ ✓ | ✓ |
| 4 | How many of the orders placed in Q3 2026 were completed? | ✓ ✓ ✓ | ✓ |
| 5 | What share of the orders placed in Q3 2026 was cancelled or returned? | ✓ ✓ ✓ | ✓ |
| 6 | What was our profit in Q3 2026? | ✓ ✓ ✓ | ✓ |
| 7 | What was our revenue by month in 2025? | ✓ ✓ ✗ | ✓ |
| 8 | Which product category had the highest revenue in Q3 2026, and how much? | ✗ ✗ ✗ | ✓ |
| 9 | What was our net margin in Q3 2026, profit as a percentage of revenue? | ✓ ✓ ✓ | ✓ |
| 10 | How many sessions did we have in Q3 2026? | ✓ ✓ ✓ | ✓ |
| 11 | What was the session conversion rate in Q3 2026, sessions that ended in an order as a share of all sessions? | ✓ ✓ ✓ | ✓ |
| 12 | How many sessions did we have on each device category in Q3 2026? | ✓ ✓ ✓ | ✓ |
| 13 | Which channel grouping brought in the most revenue in Q3 2026, by the channel of the session the order was placed in? | ✓ ✓ ✓ | ✗ |
| 14 | What were our top five countries by revenue in Q3 2026, by the country the order was placed from? | ✓ ✓ ✗ | ✓ |
| 15 | How many customers registered in Q3 2026? | ✓ ✓ ✓ | ✓ |
| 16 | How many different customers placed at least one order in Q3 2026? | ✓ ✓ ✓ | – |
| 17 | What was our revenue by customer segment in Q3 2026? | ✓ ✗ ✓ | ✓ |
| 18 | What was our average order value in Q3 2026, revenue per completed order? | ∅ ∅ ✓ | ✓ |
| 19 | How did our revenue in Q3 2026 compare with Q2 2026? | ✓ ✓ ✗ | ✓ |
| 20 | In which month from January to September 2026 were the most orders placed, and how many? | ✓ ✓ ✓ | ✓ |
| 21 | How many orders placed in Q3 2026 came from sessions in the Paid Marketing channel grouping? | ✓ ✓ ✓ | ✓ |
| 22 | How many units did we sell in Q3 2026 on completed orders? | ✓ ✓ ∅ | ✓ |
| 23 | How many employees did we have at the end of Q3 2026? | – – – | – |
| 24 | How much did we pay in shipping costs in Q3 2026? | – – – | – |
| 25 | What was our customer satisfaction (NPS) score in Q3 2026? | – – – | – |
Why a score does not carry over to your warehouse
Why a score does not carry over to your warehouse
Three more reasons, from the benchmarks themselves.
The same system, a harder database
The authors of the Spider 2.0 benchmark ran one system, DAIL-SQL with GPT-4o, on three benchmarks. It scored 86.6% on Spider 1.0, then 57.4% on BIRD, then 5.68% on Spider 2.0-lite (Spider 2.0 paper, Table 4). Spider 1.0 averages 27 columns per database; Spider 2.0-lite, built from enterprise use cases, averages 804.
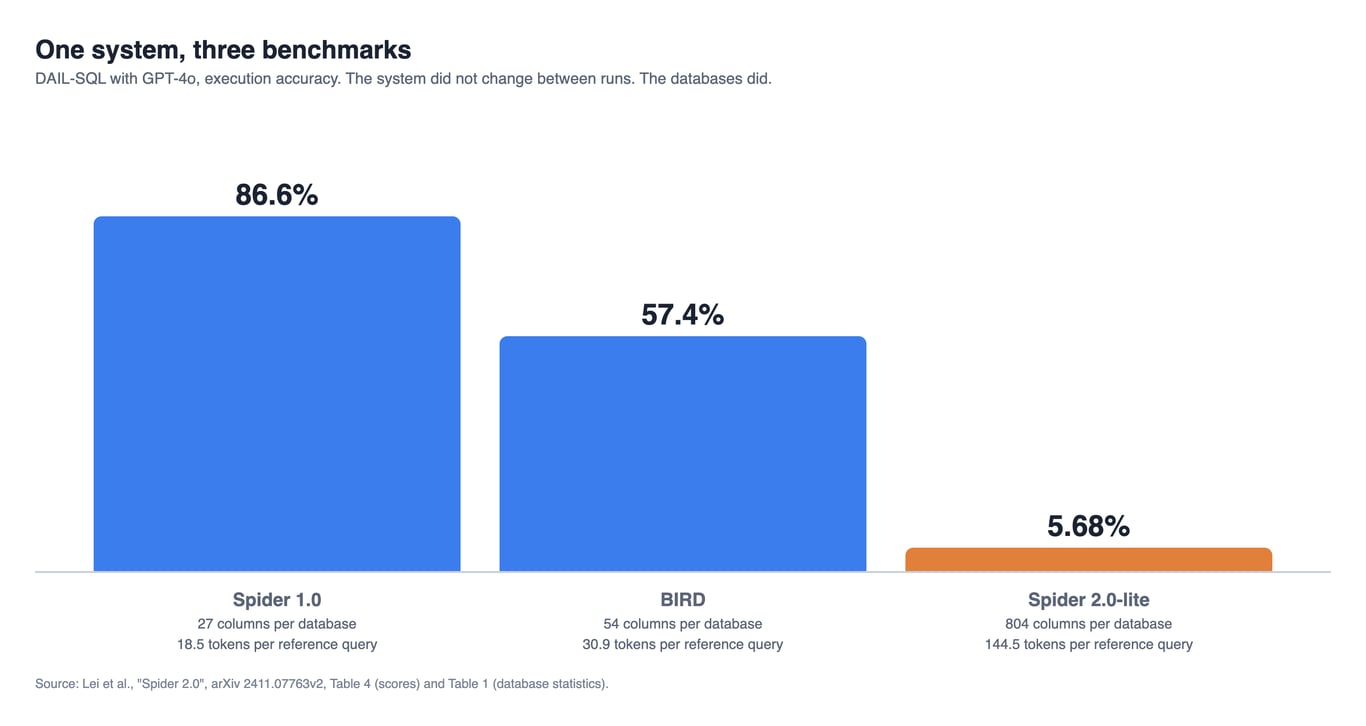
Nothing about the system changed between the three runs. The databases did. Your warehouse is a fourth database that nobody has scored.
A score belongs to one system on one date
That 5.68% was published in November 2024. On 11 October 2026 the top entry on the Spider 2.0-lite leaderboard scores 76.23%, and the top entry on Spider 2.0-Snow, the version of the test hosted on Snowflake, scores 96.70% (leaderboards). All three numbers are true; two facts sit between them.
The questions never changed. Each subset is 547 problems. The leaderboard page says scores may shift “while the questions remain fixed”, and its news entry for 24 December 2024 reads: “we have decided to release all examples and gold answers for self-evaluation”. Gold answers are the expected results. A team can check its system against them as often as it likes, so a high score promises less about questions nobody has seen.
The spread on that one test is the real finding. Five entries shown on the Spider 2.0-Snow leaderboard use the same AI model, GPT-4o, and score from 0.00% to 12.98% depending on what was built around it. Two built on o1-preview score 23.58% and 31.26%.
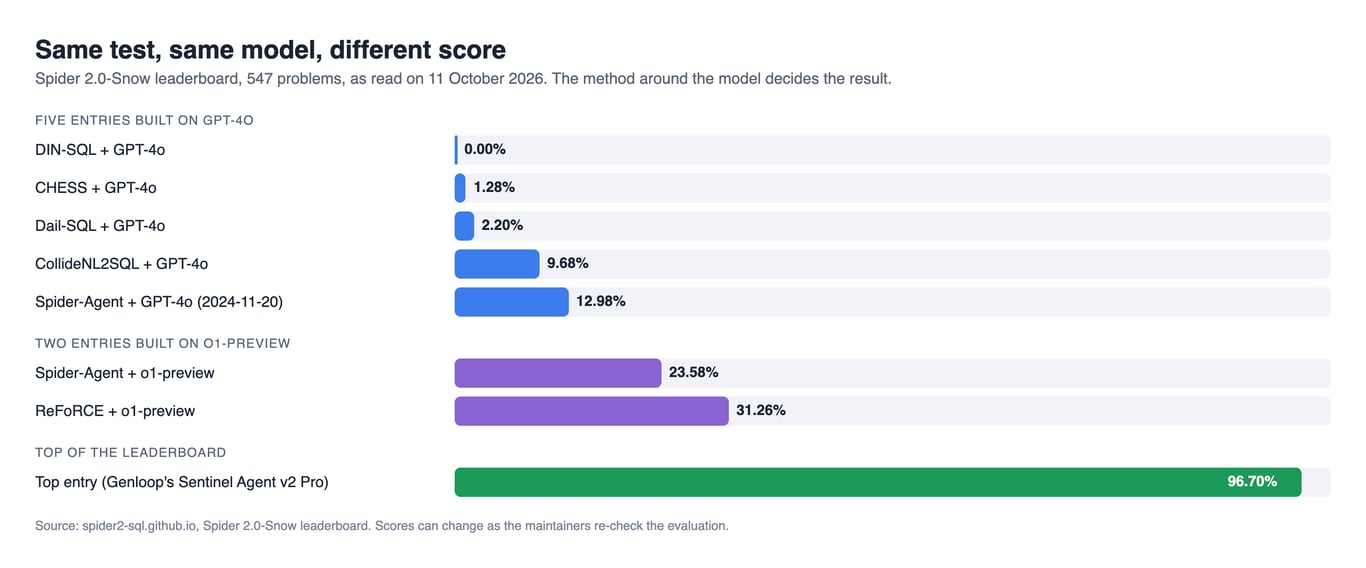
So neither “under 6%” nor “over 96%” describes text-to-SQL in general. Each describes one system, on one date, on one set of questions.
The answer key has errors
In January 2026 researchers at the University of Illinois reported annotation errors in 52.8% of BIRD Mini-Dev, a 500-question subset of BIRD, and in 62.8% of the 121 Spider 2.0-Snow problems whose reference SQL is public; after they corrected 100 BIRD examples, re-scored systems moved by as many as nine places (Jin et al.). Why a model lands on a plausible wrong reading at all is covered in AI analytics hallucination.
Questions to ask about the score
Questions to ask about the score
This article cannot know where your number came from. These seven questions find out; they are about the score, not about which product to choose.
- Which test, and which part of it? A good answer names a benchmark and subset, or shows you the vendor’s own questions.
- When was it measured? A good answer has a date and a product version.
- Was it the product we would use, or a research setup around the same AI model? A good answer is the product as sold.
- Was the system given hints? Some tests supply written hints or the correct tables in advance. A good answer says whether they were used.
- How was “correct” decided? A good answer is “same result as a reference query”, with the misses split into errors and wrong numbers.
- Can we see the SQL behind each answer? A good answer is yes, for every answer, afterwards too.
- Can our analyst run about 25 of our own questions before we commit? The only good answer is yes.
How to run the same test on your data
How to run the same test on your data
It is the benchmarks’ method at a size one person can run, and what we did above. With 25 questions each answer is four percentage points, so the test cannot tell 90% from 94%. It shows gross failure and the way the tool fails.
Decide the pass mark before you start
Agree three things with whoever asked.
- What counts as a match: exact, equal after rounding, or within a stated tolerance.
- What result would make you stop, such as how many wrong numbers you would accept. The threshold is yours to set; we do not supply one.
- What continues afterwards: keep the question set and the query log, and re-run whenever the tool, the AI model or a definition changes.
What fits in an hour, and what the full test takes
In the first hour: send the vendor the seven questions, mark 20 to 30 real requests from last quarter in the asker’s wording, and pick the three numbers your leadership argues about most. A number whose definition is not agreed waits on finance.
The full test is what we ran: a reference query you would defend for every question your data can answer, which is the real work; three questions it cannot answer; each question asked three times in separate chats; and every run put in one of four columns. On repeats, Uber’s engineers say they do not over-index on run-to-run changes of about 5% in most of their evaluation metrics (Uber, September 2024).
| Outcome | What happened | What it costs you |
|---|---|---|
| Correct | Matches your reference under the rule you set | Nothing |
| Wrong number | Ran, returned a different result | The most: nobody notices |
| Error | The query failed | A retry |
| Declined | The system said it could not answer | A request to the analyst |
Report the share of wrong numbers as its own line: a system that is right 85% of the time and declines the rest is safer than one that is right 90% and silently wrong on the other 10%. If the assistant sits on top of a semantic layer you already run, meaning metric definitions it must query through, run the test through that layer, not against raw tables.
A simplified scoring query
The comparison for question 8, with the query the model wrote in run one of setup A. It runs as written on our demo warehouse; swap in your reference and the SQL your system executed.
WITH reference AS (  -- the query we would sign
  SELECT c.category_name, ROUND(SUM(p.line_net_revenue), 2) AS revenue
  FROM `owox-demo.ecommerce.purchases` AS p
  JOIN `owox-demo.ecommerce.orders` AS o USING (order_id)
  JOIN `owox-demo.ecommerce.products` AS pr USING (product_id)
  JOIN `owox-demo.ecommerce.product_category` AS c USING (category_id)
  WHERE o.order_date BETWEEN '2026-07-01' AND '2026-09-30'
  GROUP BY 1 ORDER BY revenue DESC LIMIT 1
),
candidate AS (       -- the model's query, run 1, unchanged inside the brackets
  SELECT category_name, ROUND(revenue, 2) AS revenue FROM (
    SELECT
      pc.category_name AS category_name,
      SUM(pu.line_revenue) AS revenue
    FROM `owox-demo.ecommerce.purchases` AS pu
    JOIN `owox-demo.ecommerce.orders` AS o
      ON pu.order_id = o.order_id
    JOIN `owox-demo.ecommerce.products` AS p
      ON pu.product_id = p.product_id
    JOIN `owox-demo.ecommerce.product_category` AS pc
      ON p.category_id = pc.category_id
    WHERE o.order_date BETWEEN DATE '2026-07-01' AND DATE '2026-09-30'
    GROUP BY pc.category_name
    ORDER BY revenue DESC
    LIMIT 1
  )
)
SELECT
  (SELECT revenue FROM reference) AS reference_revenue,
  (SELECT revenue FROM candidate) AS candidate_revenue,
  NOT EXISTS (SELECT * FROM reference EXCEPT DISTINCT SELECT * FROM candidate)
    AND NOT EXISTS (SELECT * FROM candidate EXCEPT DISTINCT SELECT * FROM reference)
AS same_result| reference_revenue | candidate_revenue | same_result |
|---|---|---|
| 573984.92 | 670408.76 | false |
The gap is $96,423.84, 16.8% of the reference. The query checks only that two queries return the same set of distinct rows: EXCEPT DISTINCT ignores duplicates and row order, and the ROUND hides small floating-point differences, a match rule we chose. If the tool does not show its SQL, compare the reported rows and record that you could not see the query.
The 22 reference queries
The answer key for the test above, as run. Questions 23 to 25 have none.
-- 1. What was our revenue in Q3 2026?
SELECT SUM(p.line_net_revenue) AS revenue FROM `owox-demo.ecommerce.purchases` p JOIN `owox-demo.ecommerce.orders` o USING (order_id) WHERE o.order_date BETWEEN '2026-07-01' AND '2026-09-30'

-- 2. What was gross booked revenue in Q3 2026, counting every order whatever its status?
SELECT SUM(p.line_revenue) AS gross_revenue FROM `owox-demo.ecommerce.purchases` p JOIN `owox-demo.ecommerce.orders` o USING (order_id) WHERE o.order_date BETWEEN '2026-07-01' AND '2026-09-30'

-- 3. How many orders were placed in Q3 2026?
SELECT COUNT(*) AS orders FROM `owox-demo.ecommerce.orders` o WHERE o.order_date BETWEEN '2026-07-01' AND '2026-09-30'

-- 4. How many of the orders placed in Q3 2026 were completed?
SELECT COUNT(*) AS completed_orders FROM `owox-demo.ecommerce.orders` o WHERE o.order_date BETWEEN '2026-07-01' AND '2026-09-30' AND o.status = 'Completed'

-- 5. What share of the orders placed in Q3 2026 was cancelled or returned?
SELECT 100 * COUNTIF(o.status IN ('Cancelled','Returned')) / COUNT(*) AS share_pct FROM `owox-demo.ecommerce.orders` o WHERE o.order_date BETWEEN '2026-07-01' AND '2026-09-30'

-- 6. What was our profit in Q3 2026?
SELECT SUM(p.line_net_profit) AS profit FROM `owox-demo.ecommerce.purchases` p JOIN `owox-demo.ecommerce.orders` o USING (order_id) WHERE o.order_date BETWEEN '2026-07-01' AND '2026-09-30'

-- 7. What was our revenue by month in 2025?
SELECT DATE_TRUNC(o.order_date, MONTH) AS month, SUM(p.line_net_revenue) AS revenue FROM `owox-demo.ecommerce.purchases` p JOIN `owox-demo.ecommerce.orders` o USING (order_id) WHERE o.order_date BETWEEN '2025-01-01' AND '2025-12-31' GROUP BY 1

-- 8. Which product category had the highest revenue in Q3 2026, and how much?
SELECT c.category_name, SUM(p.line_net_revenue) AS revenue FROM `owox-demo.ecommerce.purchases` p JOIN `owox-demo.ecommerce.orders` o USING (order_id) JOIN `owox-demo.ecommerce.products` pr USING (product_id) JOIN `owox-demo.ecommerce.product_category` c USING (category_id) WHERE o.order_date BETWEEN '2026-07-01' AND '2026-09-30' GROUP BY 1 ORDER BY revenue DESC LIMIT 1

-- 9. What was our net margin in Q3 2026, profit as a percentage of revenue?
SELECT 100 * SUM(p.line_net_profit) / SUM(p.line_net_revenue) AS margin_pct FROM `owox-demo.ecommerce.purchases` p JOIN `owox-demo.ecommerce.orders` o USING (order_id) WHERE o.order_date BETWEEN '2026-07-01' AND '2026-09-30'

-- 10. How many sessions did we have in Q3 2026?
SELECT COUNT(*) AS sessions FROM `owox-demo.ecommerce.sessions` s WHERE s.date BETWEEN '2026-07-01' AND '2026-09-30'

-- 11. What was the session conversion rate in Q3 2026, sessions that ended in an order as a share of all sessions?
SELECT 100 * COUNTIF(s.is_conversion) / COUNT(*) AS conversion_rate_pct FROM `owox-demo.ecommerce.sessions` s WHERE s.date BETWEEN '2026-07-01' AND '2026-09-30'

-- 12. How many sessions did we have on each device category in Q3 2026?
SELECT s.device_category, COUNT(*) AS sessions FROM `owox-demo.ecommerce.sessions` s WHERE s.date BETWEEN '2026-07-01' AND '2026-09-30' GROUP BY 1

-- 13. Which channel grouping brought in the most revenue in Q3 2026, by the channel of the session the order was placed in?
SELECT t.channel_grouping, SUM(p.line_net_revenue) AS revenue FROM `owox-demo.ecommerce.purchases` p JOIN `owox-demo.ecommerce.orders` o USING (order_id) JOIN `owox-demo.ecommerce.sessions` s USING (session_id) JOIN `owox-demo.ecommerce.traffic_sources` t USING (traffic_source_id) WHERE o.order_date BETWEEN '2026-07-01' AND '2026-09-30' GROUP BY 1 ORDER BY revenue DESC LIMIT 1

-- 14. What were our top five countries by revenue in Q3 2026, by the country the order was placed from?
SELECT c.country, SUM(p.line_net_revenue) AS revenue FROM `owox-demo.ecommerce.purchases` p JOIN `owox-demo.ecommerce.orders` o USING (order_id) JOIN `owox-demo.ecommerce.sessions` s USING (session_id) JOIN `owox-demo.ecommerce.countries` c ON c.country_id = s.country_id WHERE o.order_date BETWEEN '2026-07-01' AND '2026-09-30' GROUP BY 1 ORDER BY revenue DESC LIMIT 5

-- 15. How many customers registered in Q3 2026?
SELECT COUNT(*) AS customers FROM `owox-demo.ecommerce.customers` WHERE registration_date BETWEEN '2026-07-01' AND '2026-09-30'

-- 16. How many different customers placed at least one order in Q3 2026?
SELECT COUNT(DISTINCT o.customer_id) AS customers FROM `owox-demo.ecommerce.orders` o WHERE o.order_date BETWEEN '2026-07-01' AND '2026-09-30'

-- 17. What was our revenue by customer segment in Q3 2026?
SELECT cu.customer_segment, SUM(p.line_net_revenue) AS revenue FROM `owox-demo.ecommerce.purchases` p JOIN `owox-demo.ecommerce.orders` o USING (order_id) JOIN `owox-demo.ecommerce.customers` cu USING (customer_id) WHERE o.order_date BETWEEN '2026-07-01' AND '2026-09-30' GROUP BY 1

-- 18. What was our average order value in Q3 2026, revenue per completed order?
SELECT SUM(p.line_net_revenue) / COUNT(DISTINCT IF(o.status = 'Completed', o.order_id, NULL)) AS aov FROM `owox-demo.ecommerce.purchases` p JOIN `owox-demo.ecommerce.orders` o USING (order_id) WHERE o.order_date BETWEEN '2026-07-01' AND '2026-09-30'

-- 19. How did our revenue in Q3 2026 compare with Q2 2026?
SELECT DATE_TRUNC(o.order_date, QUARTER) AS quarter, SUM(p.line_net_revenue) AS revenue FROM `owox-demo.ecommerce.purchases` p JOIN `owox-demo.ecommerce.orders` o USING (order_id) WHERE o.order_date BETWEEN '2026-04-01' AND '2026-09-30' GROUP BY 1

-- 20. In which month from January to September 2026 were the most orders placed, and how many?
SELECT DATE_TRUNC(o.order_date, MONTH) AS month, COUNT(*) AS orders FROM `owox-demo.ecommerce.orders` o WHERE o.order_date BETWEEN '2026-01-01' AND '2026-09-30' GROUP BY 1 ORDER BY orders DESC LIMIT 1

-- 21. How many orders placed in Q3 2026 came from sessions in the Paid Marketing channel grouping?
SELECT COUNT(*) AS orders FROM `owox-demo.ecommerce.orders` o JOIN `owox-demo.ecommerce.sessions` s USING (session_id) JOIN `owox-demo.ecommerce.traffic_sources` t USING (traffic_source_id) WHERE o.order_date BETWEEN '2026-07-01' AND '2026-09-30' AND t.channel_grouping = 'Paid Marketing'

-- 22. How many units did we sell in Q3 2026 on completed orders?
SELECT SUM(p.quantity) AS units FROM `owox-demo.ecommerce.purchases` p JOIN `owox-demo.ecommerce.orders` o USING (order_id) WHERE o.order_date BETWEEN '2026-07-01' AND '2026-09-30' AND o.status = 'Completed'
What moves the number
The clearest public evidence is small: in April 2026 dbt Labs re-ran its own test of 11 questions on a 15-table schema, each asked 20 times, with two AI models (dbt Labs).
| Setup | Claude Sonnet 4.6 | GPT-5.3 Codex |
|---|---|---|
| The model writes SQL on the original schema | 64.5% | 64.5% |
| dbt’s Semantic Layer on the original schema | 72.7% | 72.7% |
| The model writes SQL after three models were added | 90.0% | 84.1% |
| dbt’s Semantic Layer after three models were added | 98.2% | 100.0% |
On those 11 questions, three prepared models moved both approaches more than switching AI models did; on the original schema the Semantic Layer answered every question it had definitions for and returned an error on the rest, hence 72.7%. That is a direction, not a size. The sturdier finding matches ours: in dbt’s words, when the model writes SQL freely “failure looks like a plausible but incorrect answer”; through the Semantic Layer it looks like an error message.
Which setup fits which team
If the people asking can read SQL and treat the answer as a draft, a model writing SQL on prepared tables is the right choice. If you already run a semantic layer and keep it current, use it.
The third setup, B in our test, is the one we build. In OWOX Data Marts a Data Mart is a dataset an analyst defines with SQL, a table or a view, with described fields and declared joins. The OWOX MCP server is part of OWOX Data Marts Cloud, and its tools “cannot run arbitrary SQL”, only “structured queries built from the fields, filters, and aggregations” a Data Mart exposes (OWOX documentation, read 10 October 2026).
What a structured request rules out, and what it does not
The request the assistant sent for question 8 in setup B, as it reported it. It names fields and a function, with no SQL.
{
  "data_mart_id": "0212efac-2c7d-4bcb-aaf2-055229de4b75",
  "fields": [
    "products_e_commerce_product_category_e_commerce__category_name",
    "line_net_revenue"
  ],
  "aggregations": [
    { "field": "line_net_revenue", "function": "SUM" }
  ],
  "filters": [
    { "field": "orders_e_commerce__order_date",
      "operator": "between",
      "value": { "from": "2026-07-01", "to": "2026-09-30" } }
  ],
  "sort": [
    { "field": "line_net_revenue", "direction": "desc" }
  ],
  "limit": 5
}
It rules out the assistant inventing a join or rewriting how net revenue is calculated: OWOX builds the SQL from the Data Mart’s definitions and records it in Run History, the log of every query.
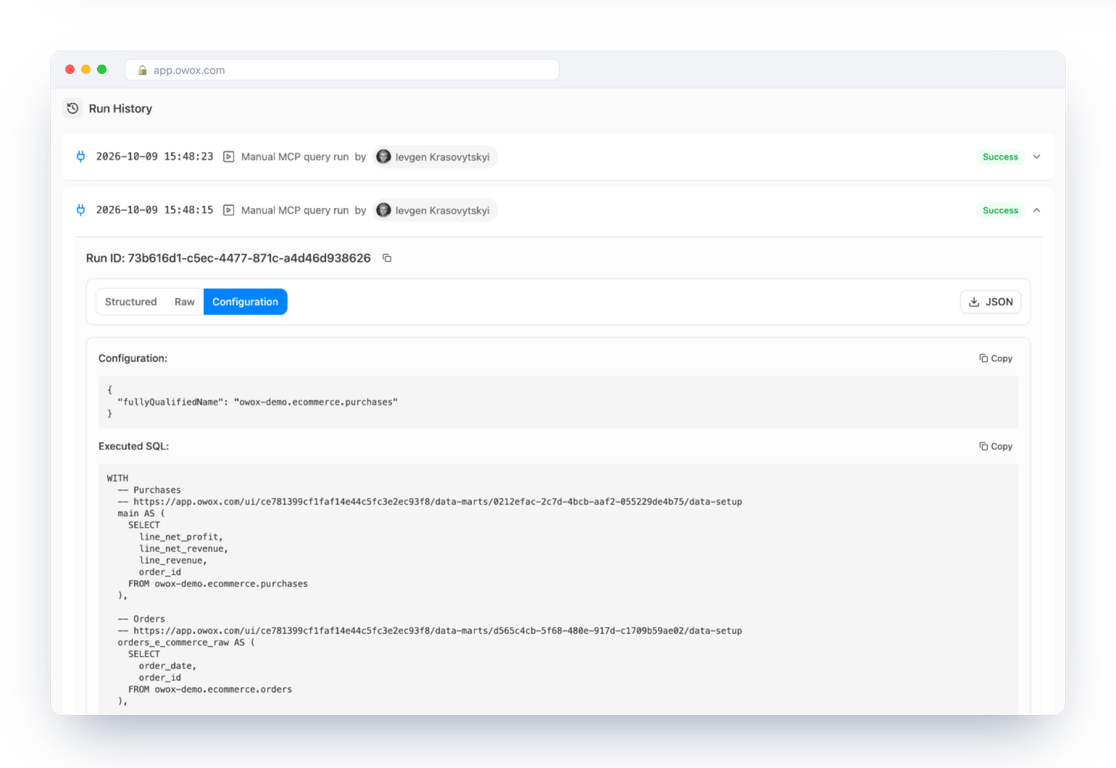
It does not rule out the assistant choosing the wrong field, or not querying at all. Both have happened to us: in the test above it led with gross revenue on question 13, and on 9 October 2026 it answered a revenue question from its chat memory with no query, leaving no entry in Run History (the full run).
So we do not claim this setup is more accurate in general, and we have not published an accuracy score for it; 20 of 22 on our own demo data is not one. The claim is narrower: the same definitions behind every answer, and a query you can open. Three limits belong next to it: result rows go to the AI provider behind the assistant; a question outside the published Data Marts gets no number; and the analyst still writes the SQL behind each one.
Reference: the benchmarks behind most scores
Reference: the benchmarks behind most scores
Skip this unless a vendor names one of them. Follow the links for today’s scores.
| Benchmark | Released | What it contains | Columns per database | Best published score |
|---|---|---|---|---|
| Spider 1.0 | 2018 | 10,181 questions on 200 small databases | 27.1 | 91.2%, leaderboard closed in February 2024 |
| BIRD | 2023 | 12,751 questions on 95 larger databases, with written hints | 54.2 | 82.95%, entry of 26 September 2026; human baseline 92.96% |
| Spider 2.0 | 2024 | 632 tasks in all; the lite and Snow subsets have 547 each | 743.5 overall, 803.6 in lite | 96.70% on Snow and 76.23% on lite, 11 October 2026 |
| BEAVER | 2024 | 9,128 question and SQL pairs from private data warehouses: 254 collected from real query logs, 8,874 synthesized from them and checked by experts | not reported there | 11.4% for the best system in the paper’s Table 4; the abstract quotes 10.8% for GPT-5.2 (paper revised 13 May 2026) |
Sizes and scores are from each benchmark’s paper and leaderboard: Spider 1.0 (leaderboard), BIRD (leaderboard), Spider 2.0 (leaderboard), BEAVER. Columns per database are from Table 2 of the Spider 2.0 paper.
What to send back to the person who asked
What to send back to the person who asked
A reply from the analyst, ready to send. “I” is the analyst; “the score” is whatever number the vendor gave.
- I can’t yet say whether the score is good enough, because I don’t know what it was measured on. Scores like this usually come from public tests on practice data; I have asked the vendor which, and on what date.
- Why it matters: in a November 2024 study by the team behind a public test called Spider 2.0, one tool scored 86.6% on an older, easier test and 5.68% on the new one, built to look like a real company’s data. As of 11 October 2026 the best tool on one version of the new test scores 96.70%, but its questions have not changed and its answers have been public since December 2024. Neither number tells us how a tool will do on ours.
- Whatever the score, some answers will be wrong, and a wrong answer looks exactly like a right one. When the authors of this guide tried 25 questions on their own demo data on 11 October 2026, an AI writing its own calculations got 56 of 66 tries right. Seven of the ten misses were believable wrong numbers with no warning, and three came back blank. One overstated a category’s revenue by $96,423.84.
- I have also asked whether the score is for the product we would use, whether the tool was given hints, how a right answer was counted, whether we can see the calculation behind every answer, and whether I can try around 25 of our own questions first.
- I will check the tool against those questions, using calculations I trust. A check that size cannot tell 90% from 94%; it can show whether the tool fails with an error or with a confident wrong number.
- Before I start, let’s agree how close an answer has to be to count as right, and what result would make us say no. Where we have not agreed what a number means, I need that decision first.
- Until you have seen the results against what we agreed, please treat any number from the tool as a draft.
Turn your data into decisions.
Governed data marts give you the clean foundation ML needs to actually work.
- No AI hallucinations
- Analyst-governed definitions
- Every number traces to SQL
Frequently Asked Questions
What is a good accuracy for text-to-SQL?
There is no single good number, because a score only describes the test it was measured on. On 10 October 2026 the best published scores were 91.2% on Spider 1.0, 82.95% on BIRD and 96.70% on the Snowflake subset of Spider 2.0; these leaderboards move, so check the pages for today's figures. None of them predicts your own data. The figure to ask for is one measured on your own questions, with the share of wrong numbers reported separately from errors.
What is execution accuracy in text-to-SQL?
Execution accuracy is the share of test questions where the SQL the system wrote returns the same result as a reference query written by a person, when both are run on the same database. The definition is in the BIRD benchmark paper. It does not distinguish a query that failed from a query that ran and returned a different number.
What is the difference between Spider, BIRD and Spider 2.0?
They are public test sets of growing difficulty. Spider 1.0 (2018) has 10,181 questions on 200 small databases. BIRD (2023) has 12,751 questions on 95 larger databases with messy values. Spider 2.0 (2024) has 632 tasks on databases that often exceed 1,000 columns and sit in BigQuery and Snowflake. In the Spider 2.0 paper (Table 4), one system, DAIL-SQL with GPT-4o, scored 86.6% on Spider 1.0, 57.4% on BIRD and 5.68% on Spider 2.0-lite.
Why is text-to-SQL less accurate on a real warehouse than on a benchmark?
A benchmark question comes with a documented database and often with written hints. A real warehouse has more tables, names that only the team understands, and definitions such as net revenue that are written nowhere the model can read. In the Spider 2.0 paper, 27.6% of 300 sampled failures were the system picking the wrong table or column. The query still runs and returns a number that nobody flagged as wrong.
How do I test text-to-SQL accuracy on my own data?
Collect 20 to 30 questions people really asked, in their wording, and write the reference SQL you would sign for each. Decide beforehand what counts as a match and what result would make you stop. Ask each question several times in separate chats, because results vary from run to run: Uber's engineers report about 5% run-to-run change in most of their evaluation metrics (Uber), and in our own 25-question run on a demo warehouse on 11 October 2026, six of the 22 answerable questions were scored differently across three runs. Compare the result of the executed SQL with your reference, and sort every run into correct, wrong number, error or declined. A test this size shows how a tool fails; it cannot tell 90% from 94%.
Does a semantic layer or a Data Mart make AI answers more accurate?
Prepared definitions helped more than a different model in the one public test we can cite. In dbt Labs' April 2026 benchmark, 11 questions asked 20 times each, text-to-SQL scored 64.5% on a raw schema and up to 90.0% once three models were added, and the dbt Semantic Layer reached 98.2% to 100% on that modeled project. With published Data Marts in OWOX Data Marts the assistant does not write SQL at all (documentation); it can still choose the wrong field, so test it on your own questions as well.