What is ROAS in marketing? Formula, examples and what counts as good
ROAS is revenue from ads divided by ad cost. The formula, a worked example, blended and platform ROAS, what counts as good, and how ROAS differs from ROI.

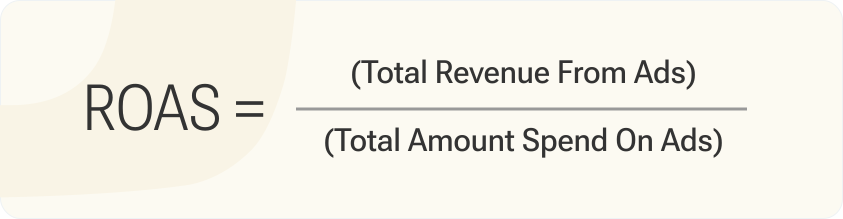
ROAS stands for return on ad spend. In marketing it is the revenue an advertising campaign brought in, divided by what the campaign cost:
ROAS = revenue from ads / ad cost
Spend $1,000 on ads and get $5,000 in revenue, and ROAS is 5, often written 5:1 or 500%. It answers one question: what did each dollar of advertising bring back?
Two things to know before you rely on it. ROAS is calculated on revenue, not profit, so a ROAS above 1 does not mean the campaign made money. And the figure an ad platform shows is the platform’s own count of the sales it claims, which is rarely the number your store recorded. Both points are covered below.
Why is ROAS important?
Treat ROAS like your compass in the vast sea of digital marketing. It helps you navigate your ad campaigns, pinpointing which ones are making a splash and which are sinking your budget.
For getting the most out of ad spend
Smart ad spend starts with seeing cost and revenue side by side. Cost sits in each ad platform; revenue sits in your store or CRM. Until the two are joined by campaign, ROAS is whatever each platform says it is.
Evaluating campaign performance
Evaluating campaign performance is like being a detective. You’re looking for clues in your data to solve the mystery of what’s working and what’s not. You’ll want to examine your ROAS, but don’t stop there. Look at other metrics like click-through rates and conversion rates. And remember, context is key. What’s happening in the market? How are your competitors doing? These puzzle pieces can help you evaluate your campaign performance and make smarter decisions. Evaluating campaign performance involves a thorough analysis of your data. Let’s consider a scenario where you’ve launched a social media ad campaign on a platform like Facebook or Instagram. Here’s how you might evaluate its performance:
- ROAS: Suppose you’ve spent $2,000 on your social media ad campaign, and it has generated $10,000 in sales. Your ROAS would be 5:1, indicating a strong return on your investment.
- Engagement Rate: This is the total engagement (likes, shares, comments) divided by the total number of impressions. If your engagement rate is low, it might suggest that your ad content isn’t resonating with your audience.
- Conversion Rate: This is the number of conversions (actions like sign-ups, purchases, downloads) divided by the total number of clicks. If your conversion rate is low despite a high click-through rate, it might indicate an issue with your landing page or the checkout process.
- Market Context: Always consider the broader market context. Are there seasonal trends affecting your industry? What are your competitors doing? Are there any external factors, like a major news event, that could be impacting your campaign’s performance?
Budget allocation and forecasting
Budget allocation and forecasting in marketing is a critical process that involves planning your resources effectively. For instance, consider you have a total marketing budget of $10,000 for the next quarter. Here’s how you might proceed:
-
Start with a Revenue Goal: Let’s say you have a revenue goal of $10,000 for the month. You would want to start with the question: How much marketing spend would I need to get there?. Understanding your LTV:CAC ratio can also help inform these decisions
-
Check historical Channel Performances: There are 2 things you need to consider when you look at historical channel performances:
- Channel ROAS: When reviewing historical channel performances, it’s crucial to consider the Return on Ad Spend (ROAS) for each channel. This can give you insight into which channels are most effective at driving revenue relative to the cost of advertising.
- Campaign limits: Typically, a particular channel would not allow infinite growth. Infact, as we scale spends in a particular channel, we do observe a drop in ROAS. In other words, the efficiency of the additional channel budget is lower.
3. Arrive at a Channel Mix based on your historical analysis: Let’s assume that you are considering 3 channels: Google Search Ads, Google Display Ads & Facebook Ads.
Your historical ROAS for each are as follows:
- Google Search Ads: 5
- Google Display Ads: 0.5
- Facebook Ads: 2
You may intuitively want to drop Display and Facebook and try to reach your revenue goal using search Ads alone. In such a case, you would consider that your marketing budget needs to be $2,000 (Since your revenue goal is $10,000 & the channel ROAS is 5).
It does not always work though. It is realistically possible that search ads, may not have the reach that you need to meet your revenue goals.
In such a case, you would either end up with unspent budget (and unmet revenue goal) or end up spending on less efficient additional keywords - bringing down your ROAS and in the process crossing over your marketing budget to meet your revenue goal.
It is thus very important to understand realistically the limitations of a particular channel and then work with a channel mix that gives you the best outcome.
As a rule of thumb, always expect that the ROAS would go down as your budget goes up.
How to calculate return on ad spend (ROAS)
How to calculate return on ad spend (ROAS)
Calculating ROAS is easy. Simply divide your revenue generated by ads by your cost of ads. Voila! You’ve got your ROAS. What is challenging however, is getting the right data. For example, companies often struggle in mapping revenue to an ad campaign. Let’s delve through the process of getting the right data to calculate ROAS accurately.
Determine revenue generated from ads
Accurately tracking the revenue generated by your ads is a crucial part of evaluating your marketing efforts. Here’s a step-by-step guide on how to do it:
- Identify Revenue Sources: Determine where your revenue is coming from. This could be direct sales from an e-commerce site, leads that convert into sales, or even ad revenue if you’re monetizing a blog or YouTube channel.
- Set Up Tracking: Implement tracking mechanisms to accurately capture this data. This could involve setting up Google Analytics to track website sales, using a CRM to track lead conversions, or using an ad platform’s built-in analytics to track ad revenue.
- Assign Value to Leads: If you’re tracking leads, assign a monetary value to each lead based on their likelihood to convert and their potential lifetime value. This will allow you to estimate the revenue generated by each lead.
- Monitor Regularly: Regularly check your tracking tools to ensure they’re accurately capturing data. If you notice any discrepancies or issues, address them immediately to ensure your data remains accurate.
If revenue is tracked in more than one place, decide which source is the record. Usually that is the store or the CRM, because it knows about cancellations and returns and an ad platform does not.
Calculate advertising cost
Next, tally up your advertising costs. This isn’t just the cost of the ad itself. You’ll also want to include the labor cost for creating the ad, vendor costs, and affiliate commissions. Now, you might be wondering how to effectively manage and analyze all this data.
When running campaigns across multiple platforms like Meta Ads (formerly Facebook Ads) and Google, each platform provides cost and revenue details for the campaigns they host. While each of these platforms provides valuable insights into cost and revenue data for their respective campaigns, the challenge lies in synthesizing this information to gain a comprehensive understanding of your overall marketing performance.
One way to do that is to load the cost data from every ad platform into your warehouse, next to the revenue data. OWOX Data Marts ad cost data from the platforms into your warehouse, and your analyst writes the query that joins it to revenue. That query, published as a Data Mart, becomes the one definition of ROAS every report reads.
Divide revenue by advertising cost
Now, let’s put theory into practice with some simple math. Imagine you’re trying to calculate your Return on Ad Spend (ROAS) from your advertising efforts. Here’s how you’d do it:
- First, determine the revenue you’ve earned through your ads. Let’s say you’ve made $5,000.
- Next, figure out the total cost of your advertising. For this example, we’ll say you’ve spent $1,000.
- Now, divide the revenue by the cost. In this case, $5,000 divided by $1,000 equals 5.
So, your ROAS is 5:1. This means that for every dollar you’ve spent on advertising, you’ve earned five dollars back. This simple calculation gives you a clear picture of the return you’re getting for every dollar spent on advertising.
Platform-specific ROAS
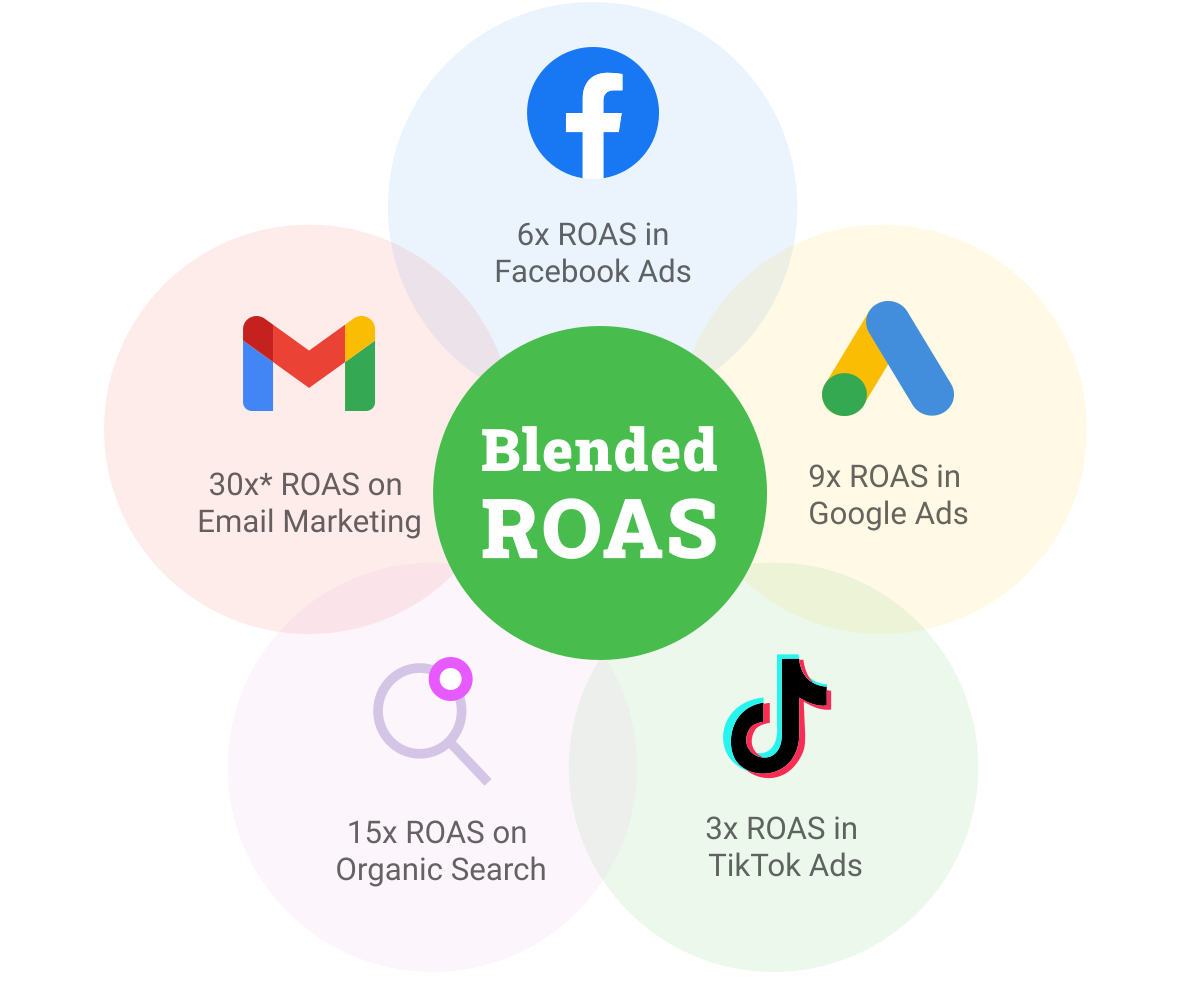
Remember to calculate your ROAS for each advertising platform. This can help you identify which platforms are giving you the best bang for your buck. Maybe your Facebook ads are outperforming your Google ads, or vice versa. Knowing this can help you allocate your ad spend more effectively.
But there are certain different scenarios as well where platform specific ROAS alone is not sufficient. For instance, a customer might first see an ad on Facebook, then later search for your product on Google, click on a search ad, and finally make a purchase. In such a scenario, both Facebook and Google played a role in influencing the purchase decision. However, Platform-specific ROAS usually works with last click attribution, therefore it attributes the revenue to the search ad only. As a result we may not realistically understand how the channels are performing. How do we tackle this? Let’s check out an alternative approach- Blended ROAS.
Blended ROAS
Blended ROAS takes into account the cost of all your advertising channels and gives you a holistic view of your ad performance. This can be particularly useful if you’re running multi-channel campaigns. To understand how different channels contribute to conversions, explore marketing attribution models. The formula for this is Blended ROAS = Total Revenue from Advertising / Total Cost of Advertising.
Interpret and analyze ROAS
Interpreting and analyzing ROAS isn’t just about crunching numbers. It’s about understanding the story behind those numbers. A falling ROAS can mean higher cost per click, a lower conversion rate, or smaller orders. Check which input moved before you change the campaign.
OWOX Data Marts
See your first report built in real time. 15 minutes.
- Connect your data warehouse
- Pick your metrics
- Get a live Google Sheets report
In the time it takes to write a ticket. Then imagine never writing that ticket again.
Book a DemoWe'll use your actual use case
What ROAS is considered good?
So, what’s a good ROAS? Well, it’s a bit like asking, “What’s a good car?” It depends on your needs and circumstances. Generally, a ROAS of 3 or more is considered good. This means for every dollar spent on advertising; you’re generating three dollars in revenue. Judge it against your margin, though: at a 30% margin, a ROAS of 3 brings back $0.90 of margin per dollar of ads, which is a loss. But remember, what’s desirable can vary significantly depending on your industry, type of business, and size of the business. And like a car, your ROAS isn’t set in stone. You can always tune it up and improve it over time.
What is the difference between ROAS and ROI?
What is the difference between ROAS and ROI?
ROAS and ROI might seem like twins, but they’re more like cousins. While ROI measures the total return of overall investment, ROAS only calculates your return concerning a specific ad campaign. Think of ROI as the big picture and ROAS as a close-up of your ad campaigns. So, while ROI takes into account the cost of an entire project or campaign, ROAS only considers the cost of advertising. Both are important, but they give you different insights. So, make sure to calculate both to get a complete understanding of your marketing performance.
Here are some examples of what is included when calculating ROI:
- Investment Cost: This is the amount of money spent to invest. In the context of a marketing campaign, for example, it would include costs such as:
- Ad spend
- Agency fees
- Creative costs (e.g., design, content creation)
- Technology costs (e.g., marketing automation tools, CRM system)
- Return: This is the money made from the investment. In the context of a marketing campaign, it could include:
- Direct sales revenue from the campaign
- Indirect revenue, such as the value of leads generated, customer retention, and lifetime value
- Let’s make a comparison between ROI and ROAS (Return on Ad Spend) for a more in-depth understanding:
Formula
- ROI (Return on Investment)
- (Return − Investment Cost) / Investment Cost
- ROAS (Return on Ad Spend)
- Revenue from Ad / Cost of Ad
Components
- ROI (Return on Investment)
- Considers all costs associated with a campaign and all returns (direct and indirect).
- ROAS (Return on Ad Spend)
- Primarily considers the cost of the ad and direct revenue from the ad.
Purpose
- ROI (Return on Investment)
- Provides a comprehensive understanding of the profitability of a campaign.
- ROAS (Return on Ad Spend)
- Useful for understanding the effectiveness of individual ads in generating revenue.
How to improve your ROAS?
Want to boost your ROAS? It’s all about setting clear goals, targeting the right audience, optimizing your ad campaigns, and analyzing your performance. Let’s break it down. You can also check our guide to calculating ROI for the broader picture.
Define your goals and key metrics
Start by defining your goals. Are you looking to increase sales, generate leads, or improve brand awareness? Then, decide on the key metrics you’ll use to measure your success. This could be conversion rate, cost per acquisition, or click-through rate. Remember, what gets measured gets managed.
Target the right audience
Next, make sure you’re targeting the right audience. Who are they? What are their needs and preferences? How do they behave online? By understanding your target demographic, you can create ads that resonate with them and drive better results.
Optimize your ad campaigns
Now, it’s time to optimize your ad campaigns. This could involve tweaking your ad copy and creative, improving your landing page, refining your keywords, targeting, and adjusting your bidding strategy. Remember, even minor alterations can significantly influence your ROAS.
Monitor and analyze performance
Keep a close eye on your performance. Look for trends, patterns, and areas for improvement. Are certain ads performing better than others? Are you seeing a high click-through rate but a low conversion rate? By consistently monitoring and analyzing your performance, you can enhance your Return on Advertising Spend (ROAS) through data-driven decision-making.
Iterate and scale
Finally, don’t be afraid to iterate and scale. Try different approaches, measure their impact, and refine your strategy based on what works. Remember, improving your ROAS is a journey, not a destination. So, keep experimenting, learning, and growing.
Why platform ROAS and your own ROAS disagree
Why platform ROAS and your own ROAS disagree
Each ad platform reports ROAS from the conversions it attributes to itself. Add the platforms up and they usually claim more sales than the business made, because two platforms can claim the same order and neither sees a cancellation.
On the OWOX e-commerce demo dataset, the search platforms claimed 255 conversions in one quarter. The store recorded 198 orders from those campaigns and kept 170 after cancellations and returns. The worked example is in how to calculate marketing ROI.
So keep two figures apart. Platform ROAS is useful inside one platform, to compare campaigns with each other. Your own ROAS, calculated from recorded revenue, is the one to report. And when the question is whether advertising as a whole pays off, use the marketing efficiency ratio, which divides all revenue by all marketing spend.
Turn your data into decisions.
Governed data marts give you the clean foundation ML needs to actually work.
- No AI hallucinations
- Analyst-governed definitions
- Every number traces to SQL
Frequently Asked Questions
What is a good ROAS?
The ideal ROAS (return on advertising spend) can differ based on your industry, business type, and size. However, a ROAS of at least 3 is generally deemed good. This translates to every dollar spent on advertising resulting in three dollars of revenue.
What Is the Difference Between ROAS and ROI?
ROI measures the total return on investment, while ROAS calculates the return for specific ad campaigns. Both are crucial for understanding marketing performance.
How is ROAS calculated?
To calculate ROAS, divide ad revenue by cost. This shows the return per advertising dollar and gauges ad effectiveness.
What does ROAS mean?
ROAS is an acronym for Return on Ad Spend. This metric gauges the revenue generated for every dollar spent on advertising. Measuring and optimizing ROAS is an effective method to assess the performance of your ad campaigns and determine how much value you're getting from your investment.