
How to Calculate LTV with CRM and ERP
Discover scalable ways to calculate LTV with CRM and ERP data. Segment by channel, campaign, or cohort for accurate ROI reporting.

How do you calculate LTV without rewriting SQL every quarter or patching numbers across spreadsheets? Many teams start with CRM and ERP data to get a basic LTV number. But that number alone doesn’t explain which channels bring valuable customers, which cohorts churn faster, or which campaigns actually pay off.
.png)
This guide shows you how to go beyond static LTV calculations. You’ll learn how to segment LTV by channel, campaign, or cohort, apply the right formula for your business model (e-commerce or SaaS), and govern it all using SQL and OWOX Data Marts, so every team sees the same trusted number.
Why Calculating LTV Is More Complex Than It Seems
Analysts often start by combining CRM (customer data) and ERP (transaction records) to calculate LTV. While this works for a high-level number, it fails to answer key marketing questions:
- Which channel brings the most valuable customers?
- Which cohorts churn faster?
- Which campaigns generate long-term ROI?
This results in patched SQL queries, conflicting spreadsheet reports, and inconsistent numbers across Marketing, Finance, and BI.
CRM and ERP Alone Aren’t Enough

CRM systems store valuable customer details, and ERP platforms track purchases and revenue. But when used alone, they can’t answer which campaigns led to high-value customers or which channels drive retention. To truly understand LTV, you need to integrate CRM, ERP, and acquisition data into one model.
Inconsistent Logic Across Teams
Each team looks at LTV differently. Finance might exclude refunds, while Marketing uses a fixed customer lifespan, and BI defines churn another way. These small differences add up, causing dashboards to show different numbers. When teams don’t agree on the formula, no one fully trusts the data.
How to Structure LTV Calculations by Business Model
LTV isn’t calculated the same way across all businesses. The right formula depends on your model, e-commerce, SaaS, or subscriptions. Below are key ways to structure LTV using the right cohorts, formulas, and segmentation for meaningful, consistent insights.
Cohort-Based LTV: Acquisition vs. Behavioral
To gain meaningful LTV insights, you need to select the appropriate cohort lens. Each approach answers different business questions:
- Acquisition cohort: Group users by signup date or first-touch campaign. Best for tracking marketing ROI and growth.
- Behavioral cohort: Group by key actions like activation or feature use. Useful for analyzing retention and product impact.
Pick one primary lens per dashboard, document it in your Data Mart, and stick to it.
Applying the E-Commerce LTV Formula
For transactional businesses like e-commerce and retail, LTV reflects purchase behavior over time.

This formula helps you understand how often customers buy, how much they spend, and how long they stay active. It works well for tracking repeat purchases, comparing cohorts, and spotting high-value segments over time.
Using the SaaS LTV Formula
For subscription-based businesses, LTV should reflect recurring revenue and customer churn.
LTV = ARPU ÷ Churn Rate
This model highlights the impact of churn on long-term value. Even slight improvements in retention can significantly increase LTV, making it a critical metric for SaaS companies focused on customer lifetime profitability.
Segment LTV by Channel and Cohort
By segmenting LTV by channel, campaign, cohort, or demographics, analysts can pinpoint which audiences bring the most value. This makes LTV insights far more actionable, enabling smarter budget allocation, better targeting, and improved retention strategies across the funnel.
Link LTV to CAC and Payback
By joining your LTV Data Mart with a governed CAC model by channel, campaign, or cohort, you can calculate payback periods and LTV:CAC ratios. This is where budget optimization becomes possible. Without a shared definition, payback analysis breaks down across teams, leading to misaligned spend decisions.
Building a Scalable Framework for LTV Reporting
To make LTV reporting consistent and repeatable, teams need a clear framework. The sections below outline how to build that framework step by step.
Define LTV Logic Once in SQL
Define your LTV logic directly in SQL, on top of your core warehouse tables, to ensure consistency. This gives all teams a shared, consistent foundation for analysis.
Start with tables like:
- Orders – to calculate Average Order Value (AOV)
- Transactions – for total spend and frequency
- Subscriptions – to track churn and customer lifespan
Locking these definitions in one place prevents formula drift and ensures every team works from the same trusted LTV logic.
Enrich LTV Analytics
CRM and ERP provide customer and transaction data, but they don't give you the whole picture. To understand which channels bring your most valuable customers, enrich your LTV model with analytics and ad data.
Add:
- Source / Medium from analytics platforms
- Campaign IDs from ad tools
- UTM parameters for cohort tagging
This unlocks CAC-to-LTV analysis, letting you track ROI by campaign and make smarter acquisition decisions.
Standardize Assumptions Across Teams
Different teams often use different assumptions when calculating LTV, whether to include refunds, how to treat discounts, or how to define churn. These small inconsistencies lead to conflicting reports and loss of trust across departments.
The solution is to lock these assumptions into a governed LTV model and document them clearly. When Marketing, BI, and Finance align on the same rules, they work from one consistent, trusted metric, ensuring every decision is backed by the same logic.
Lock Assumptions in One Place (Refunds, VAT, Churn, Lifespan)
LTV drift often happens because key assumptions aren’t documented or agreed upon. Questions like
- “Do we include refunds?”
- “How do we treat VAT or discounts?”
- “What’s the lifespan cap,12 or 24 months?”
These can cause major inconsistencies.
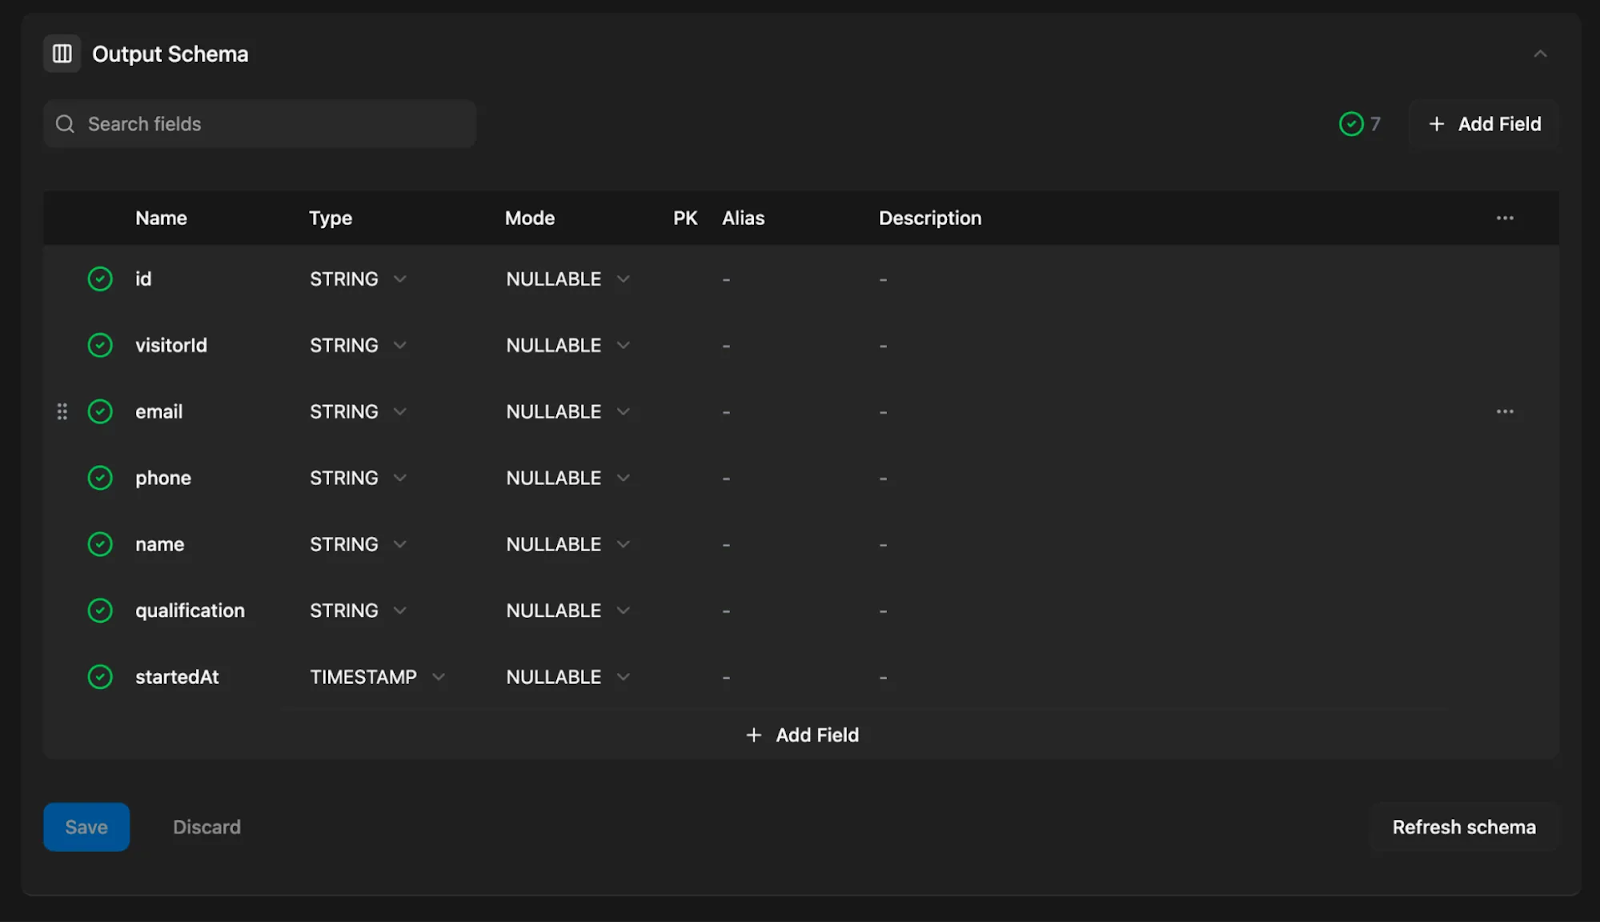
Store all these policy decisions in your LTV Data Mart using clear aliases and field descriptions. This way, Finance, Marketing, and BI all follow the same rulebook, ensuring transparency, alignment, and fewer arguments during reviews.
Data Quality Prerequisites for Reliable LTV Joins
Before calculating LTV, your data must be clean, consistent, and trustworthy. Skipping these checks leads to misleading metrics and wasted analysis time. Make sure the following prerequisites are handled in the warehouse layer that feeds your LTV Data Mart:
- Unify person/account IDs across CRM and ERP
- Normalize currency to a base currency with a reliable FX source and date
- Align time zones to ensure accurate timestamps
- Deduplicate customer and order records
- Exclude test/sandbox data from calculations
- Establish event ordering (e.g., booked → invoiced → collected)
Clean inputs lead to reliable lifetime value insights.
Automate and Share Consistently
Even the most accurate LTV logic won’t matter if the data is outdated. Stale reports lead to lost trust and bad decisions. Automate your LTV Data Mart refreshes on a fixed schedule, daily, weekly, or monthly, so your metrics always reflect the latest data.
Once refreshed, share governed outputs directly to tools like Google Sheets or Looker Studio. This ensures teams receive fresh, consistent LTV numbers without needing analysts to manually rerun SQL.
How OWOX Data Marts Makes LTV Reporting Scalable and Trusted
To keep LTV reporting accurate, scalable, and easy to maintain, analysts need more than just SQL; they need a governed system. OWOX Data Marts provides the tools to define, manage, and deliver LTV logic.
Define Your LTV Logic Directly in SQL
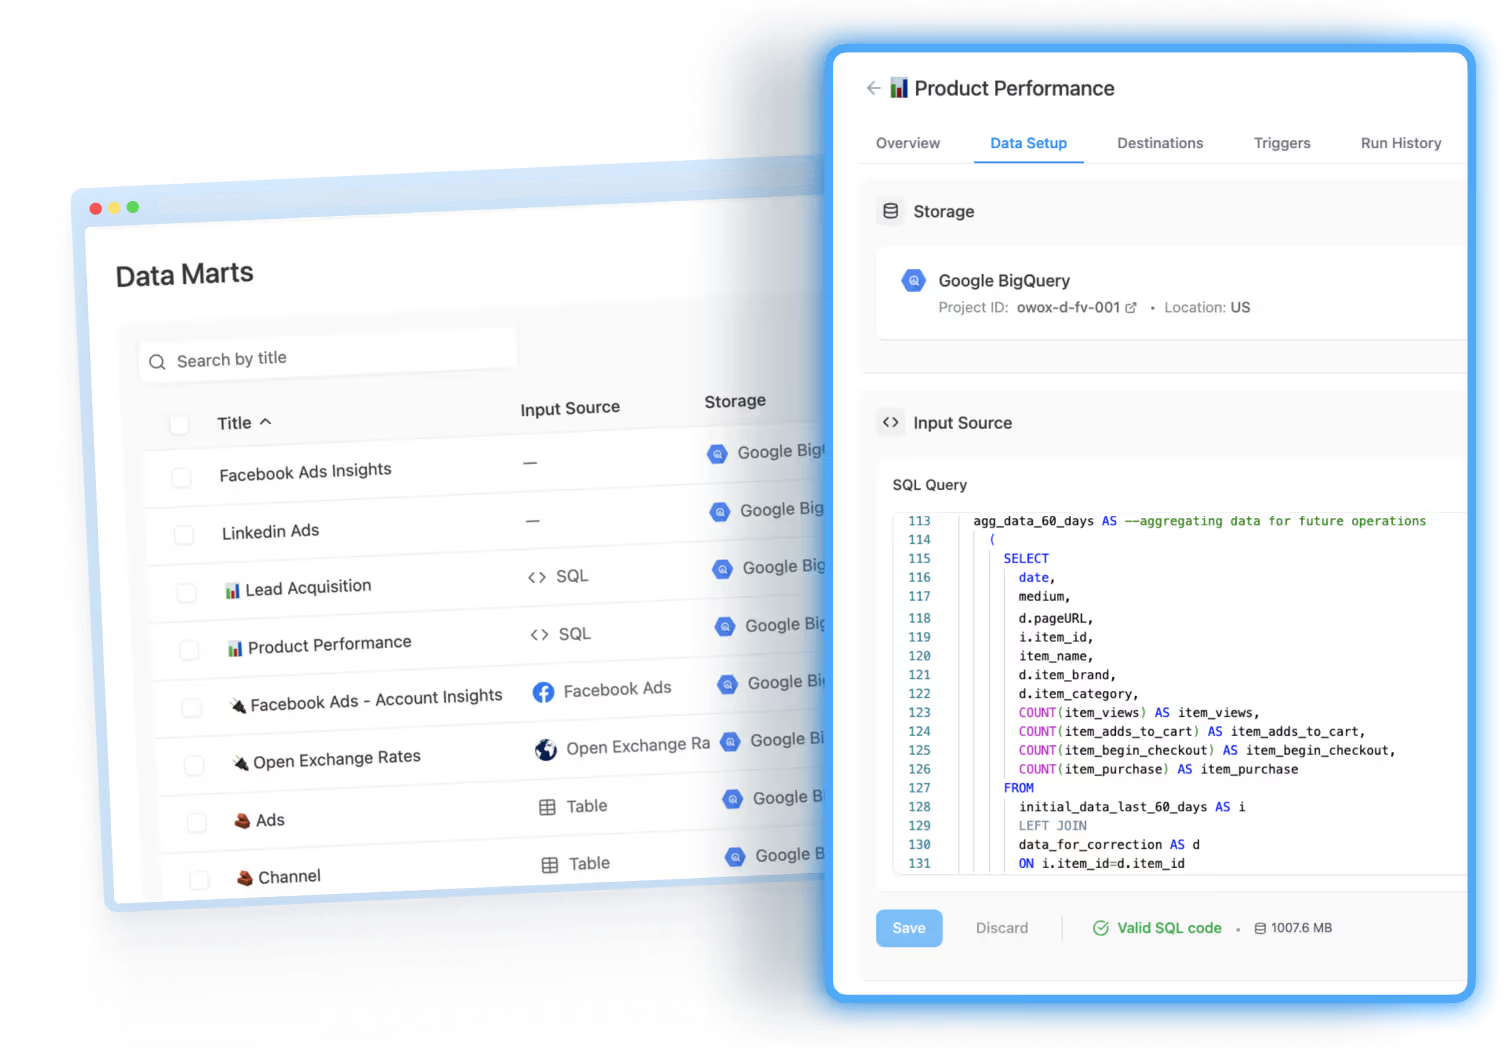
With OWOX Data Marts, you can define your LTV logic directly in SQL using your existing BigQuery tables, orders, transactions, customers, and subscriptions. This SQL-first approach gives analysts full control over how LTV is calculated, tailored to the business model, whether it’s e-commerce or SaaS.

Instead of relying on spreadsheets or inflexible templates, you write clean, transparent SQL that becomes the foundation of your LTV reporting. It’s easy to review, adjust, and maintain, ensuring your logic is always aligned with your goals and data sources.
Save and Reuse Queries in a Central Library
Instead of rewriting the same SQL logic every time someone requests an LTV update, OWOX lets you save your LTV calculation as a governed Data Mart. This becomes part of a centralized library, where queries are discoverable, searchable, and reusable.
Analysts no longer need to dig through old tabs or rebuild from scratch. Business users access consistent results every time, regardless of whether they're using Google Sheets or Looker Studio. This reduces rework, avoids duplication, and promotes a single source of truth across teams.
Version and Audit Your LTV SQL
OWOX Data Marts makes it easy to version and audit your LTV logic as it evolves. Each change to your SQL can be saved with version tags and clear notes, like “v1.3: switched to net revenue” or “v1.4: lifespan capped at 18 months.”
Paired with automatic refresh logs, this gives full visibility into when the data was last updated and what changed. During finance or performance reviews, stakeholders can track how metrics have evolved over time, increasing confidence in the numbers and accountability in decision-making.
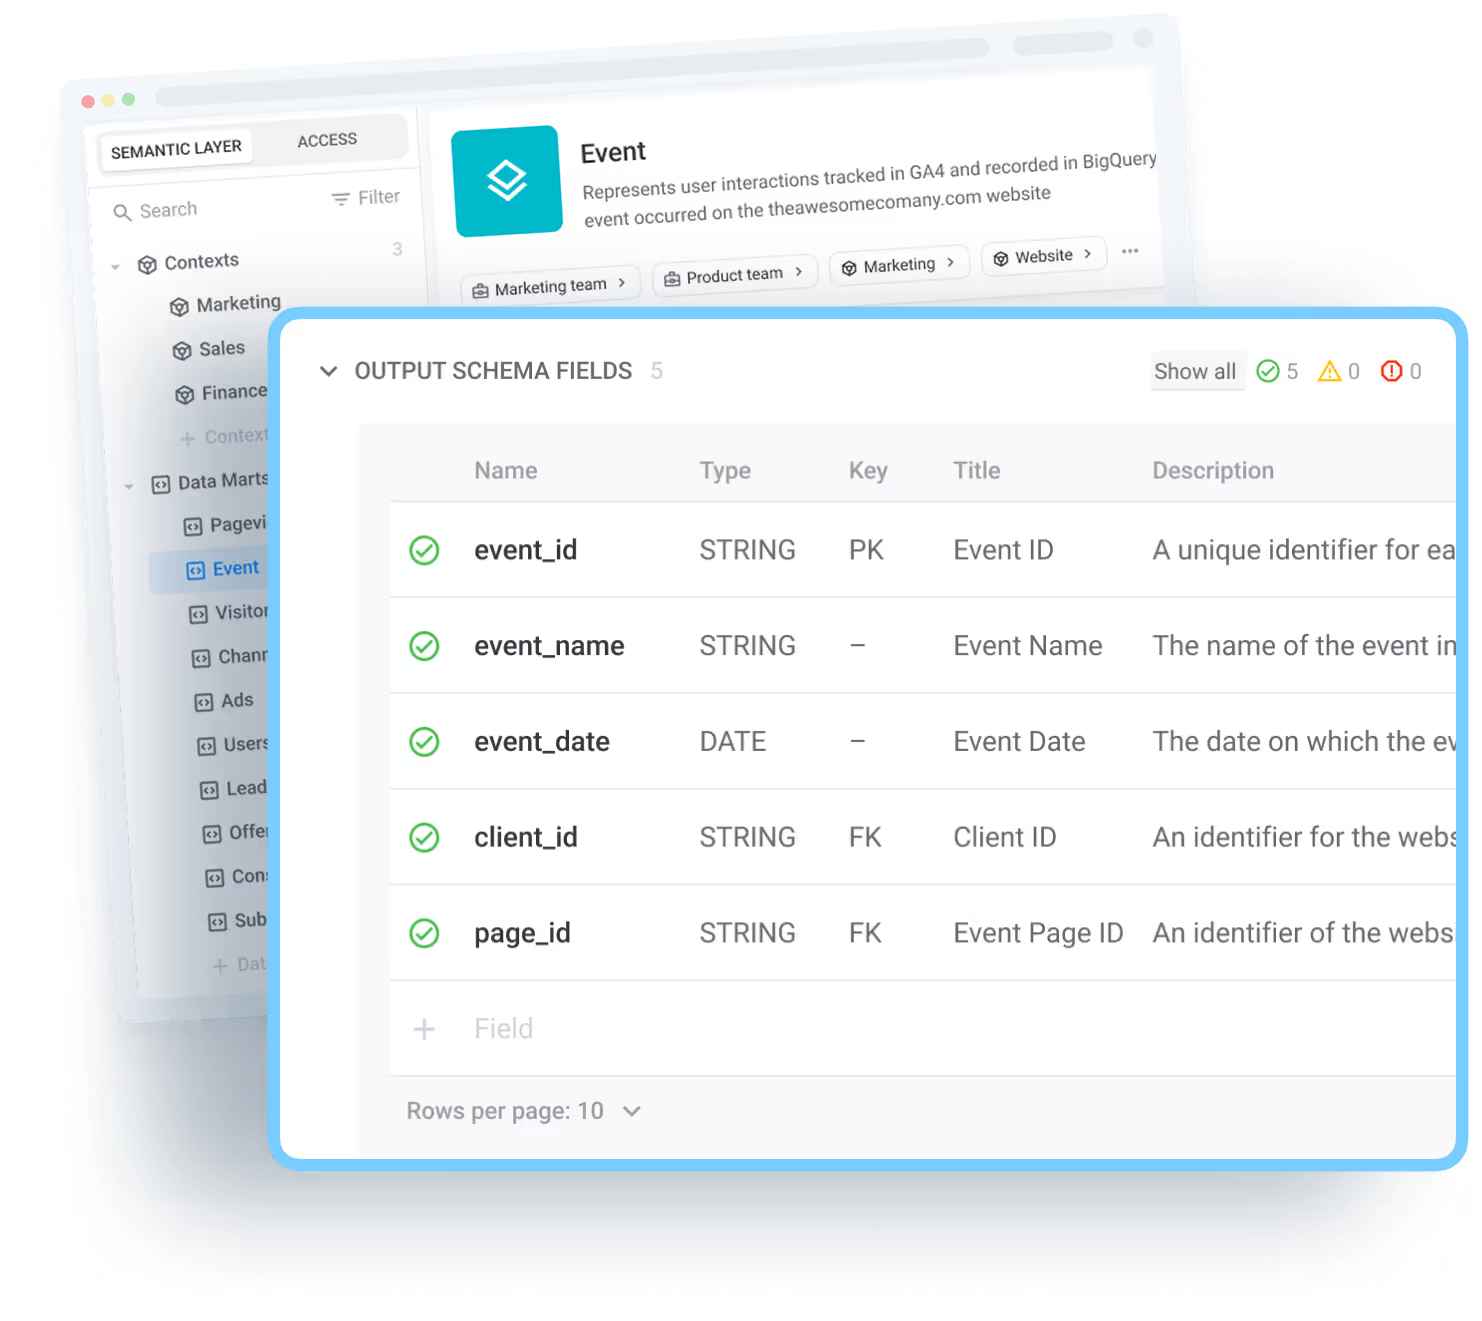
Ensure Governance and Consistency Across Teams
Conflicting LTV definitions across departments often lead to confusion, mistrust, and reporting errors. With OWOX Data Marts, you can lock your SQL logic into a governed Data Mart, ensuring every team, Marketing, Finance, and BI, works from the same consistent formula.
This governance layer eliminates version drift between spreadsheets, dashboards, or ad hoc queries. By defining and storing metrics in a central, reusable location, everyone relies on a single source of truth.
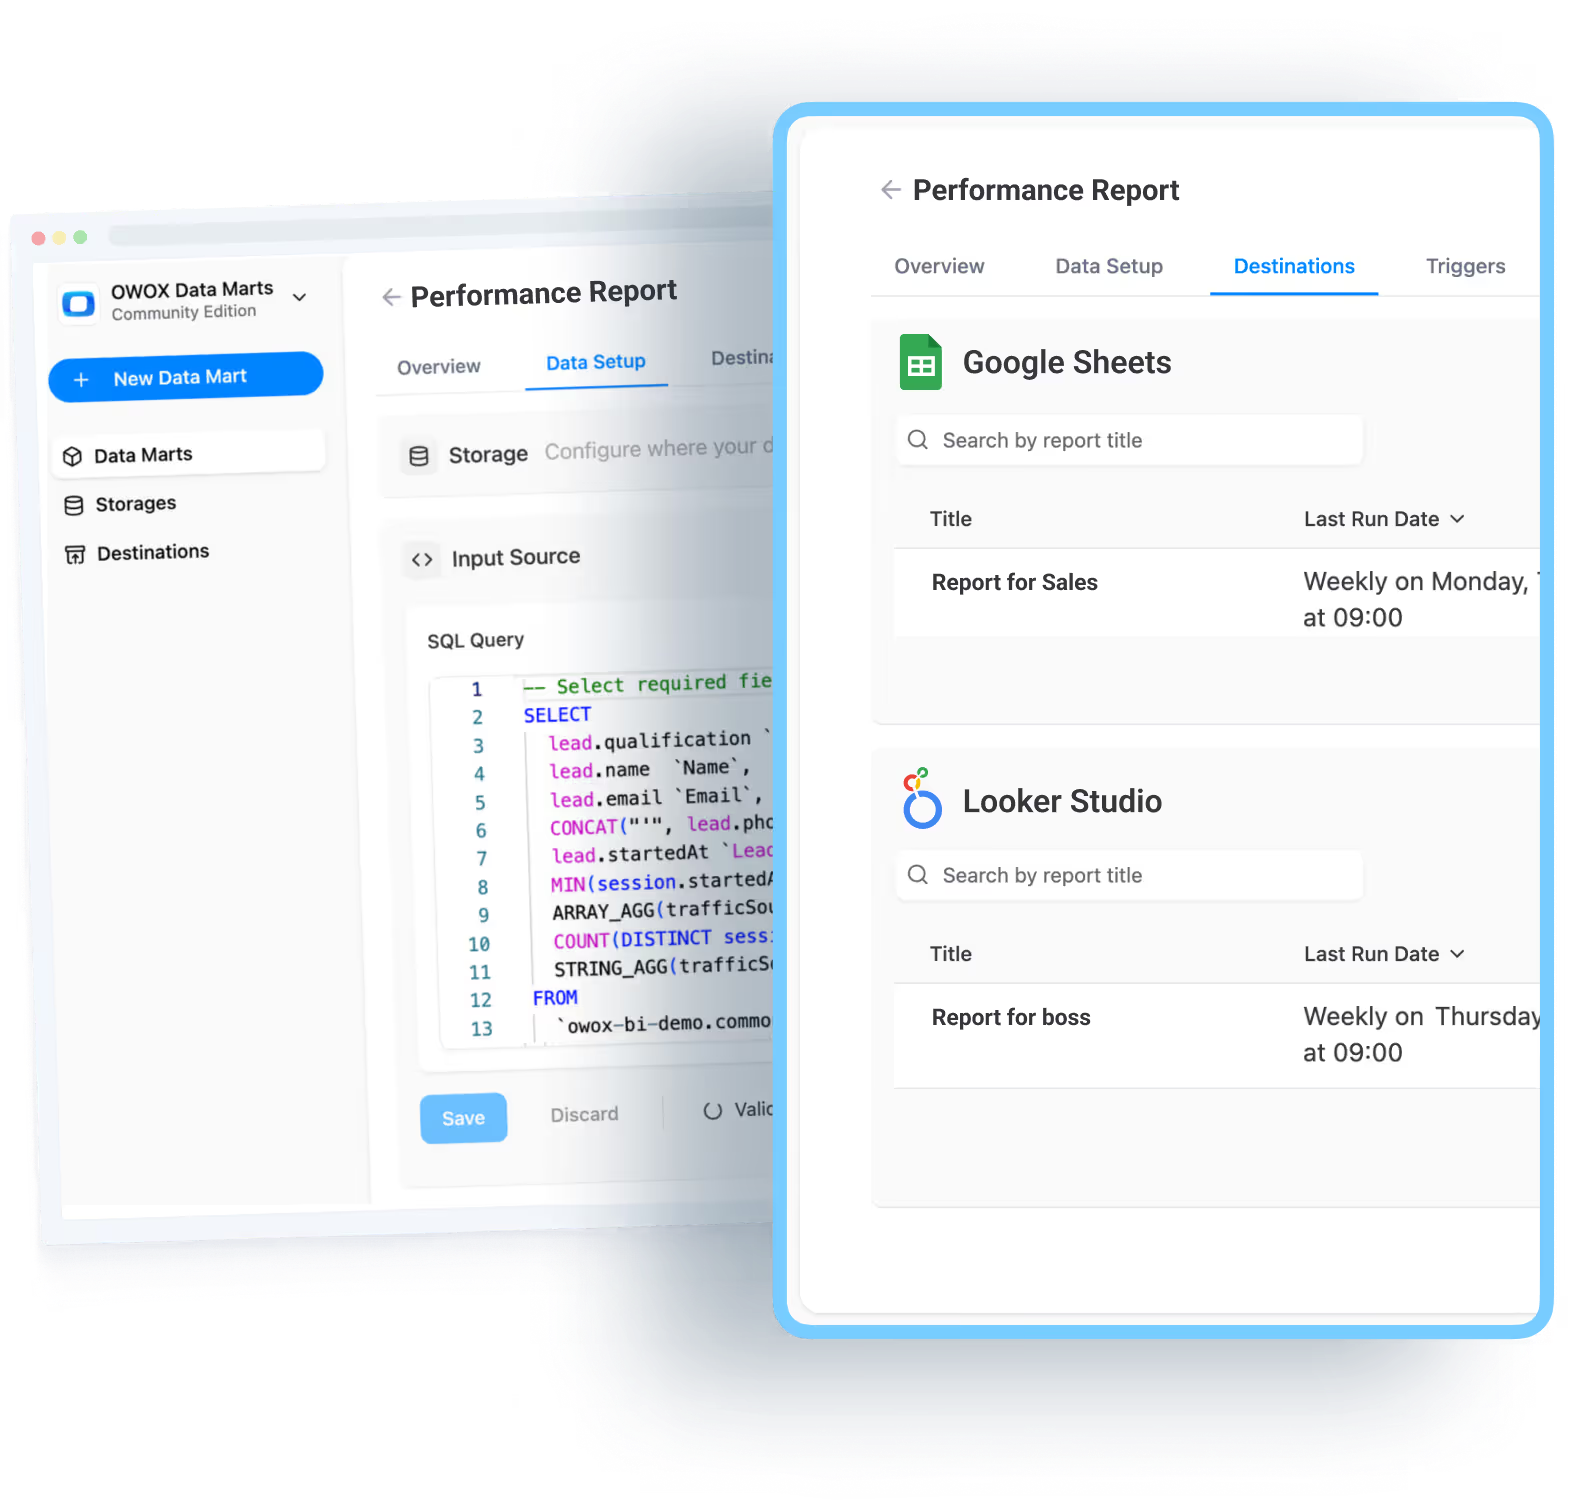
Deliver LTV Results Where Business Users Work
Once your LTV Data Mart is defined in OWOX, you can deliver the results directly to the tools business users already use, Google Sheets, or Looker Studio.
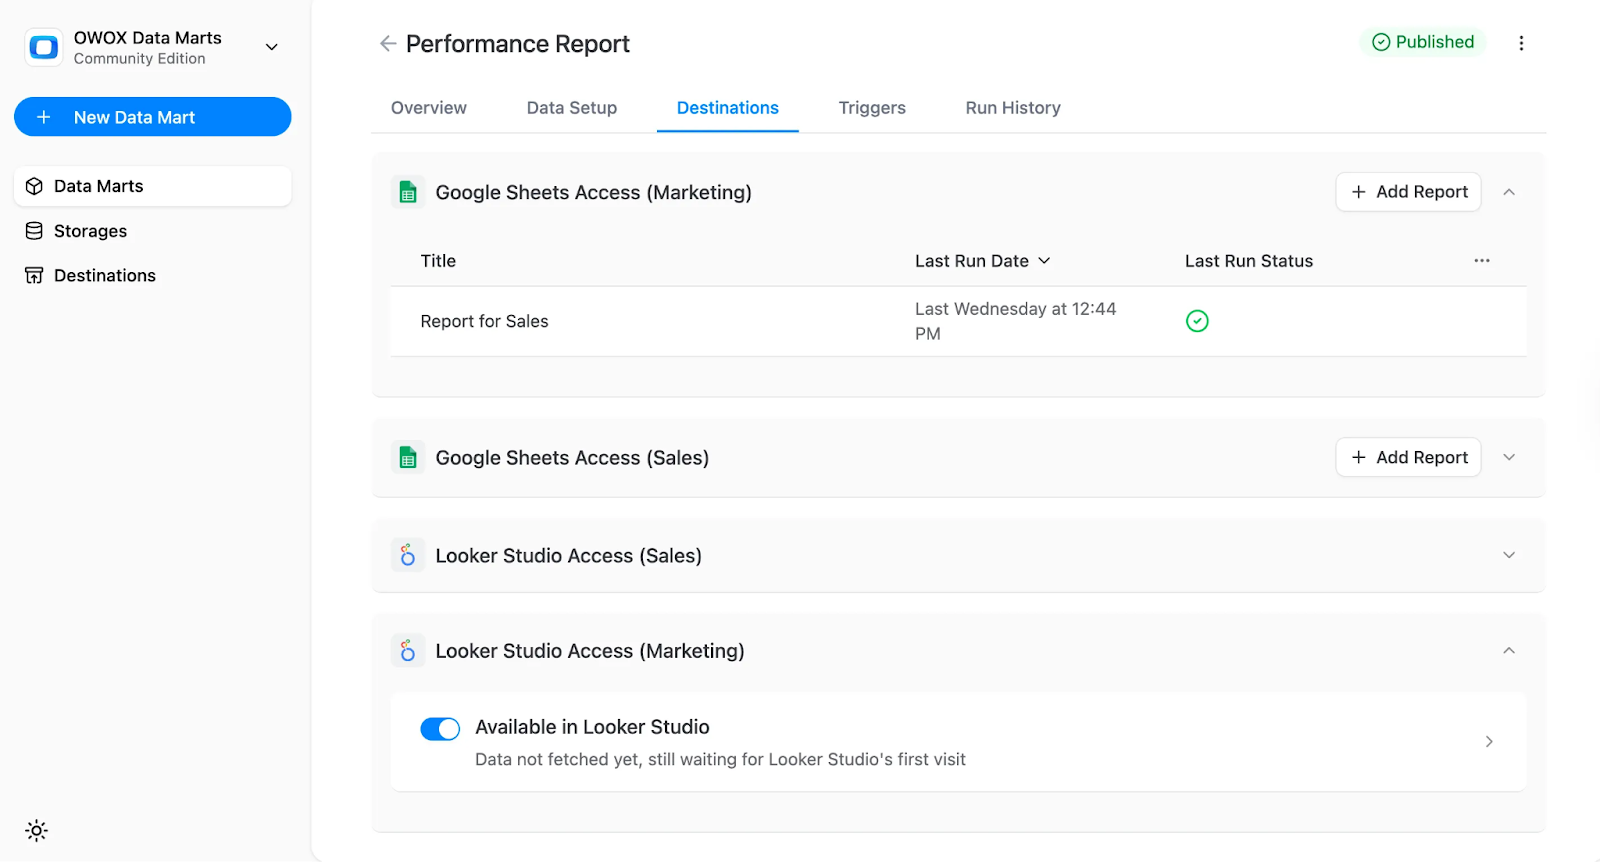
Marketing teams can pull CAC vs. LTV comparisons in Sheets, and Finance can validate payback and ratios in Looker Studio. Everyone works with the same trusted data, no more broken formulas, copy-paste errors, or mismatched numbers across dashboards.
Automate Freshness with Triggers
Keeping your LTV metrics current shouldn’t require constant manual work. OWOX supports automation through two types of triggers, one for pulling data in and another for refreshing your reports. This ensures your dashboards stay accurate without wasting analyst time.
Automatically pull in ad data from platforms like Facebook, LinkedIn, Twitter, and many more into BigQuery on a fixed schedule (daily, weekly, or custom intervals). This ensures your acquisition data stays up to date.

- Report Triggers
Automatically refresh your SQL-based LTV Data Mart as new CRM and ERP data arrives in your warehouse. This keeps the LTV logic current while preserving historical metrics.
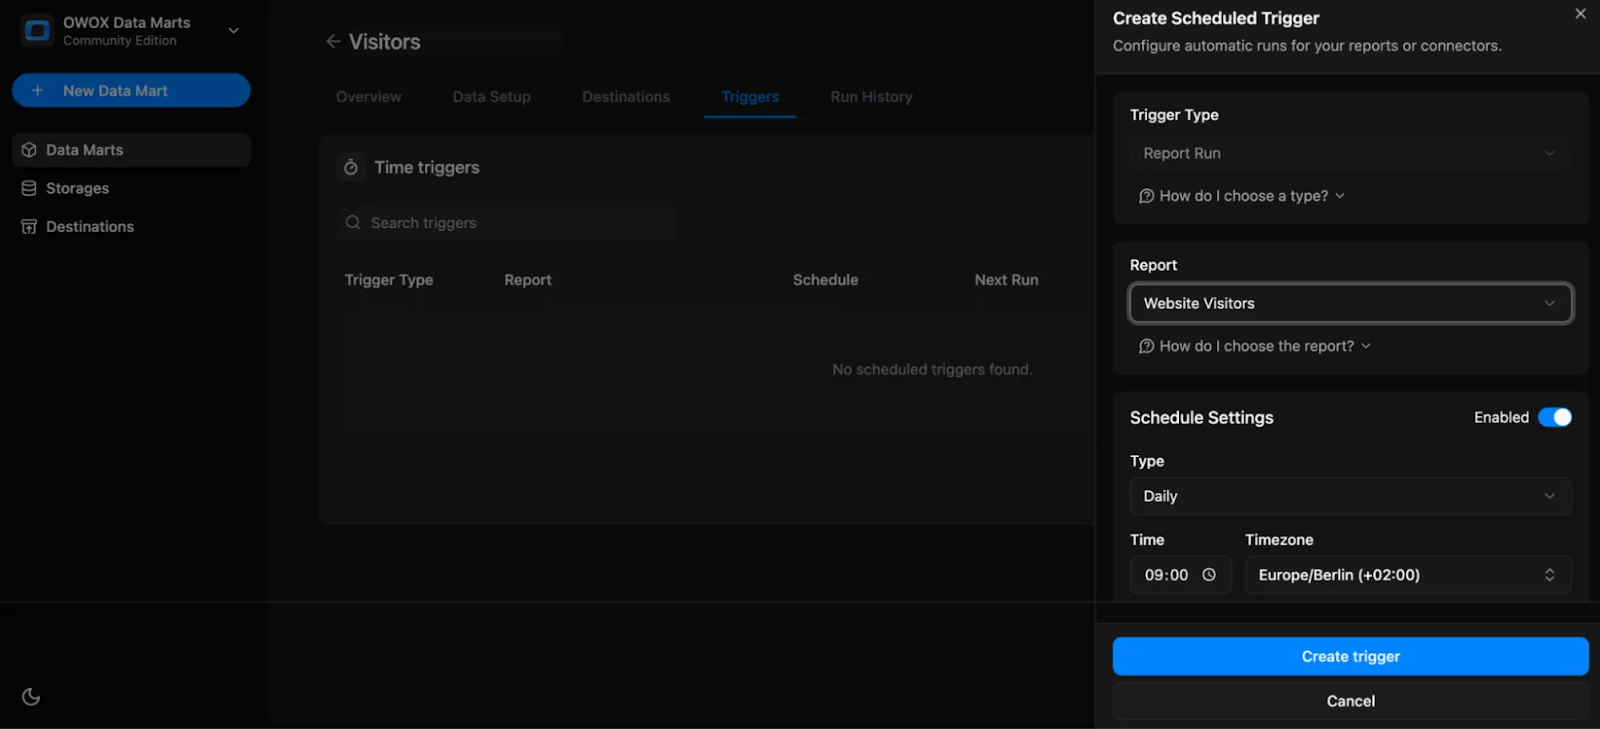
By automating both data imports and report refreshes, you eliminate the need for manual updates and reduce the risk of outdated insights.
Note: Build Directly from Warehouse Tables
Currently, OWOX Data Marts don’t support querying one Data Mart from another. To keep your setup stable and manageable, build your LTV Data Mart directly from base warehouse tables. This approach avoids dependencies, ensures clarity, and makes your logic easier to audit, adapt, and scale across teams.
Implementing LTV Formulas in SQL and Governing Them with OWOX Data Marts
Implementing LTV in SQL isn’t just about writing the right formula. Below are two example formulas for e-commerce and SaaS, along with guidance on how to govern and operationalize them using OWOX Data Marts.
E-Commerce SQL Example
For e-commerce businesses, LTV is typically calculated using:
LTV = Average Order Value × Purchase Frequency × Customer Lifespan
This formula helps estimate how much a customer will spend over their relationship with the business. Here's how you might implement this in SQL using transactional data:
1WITH order_stats AS (
2SELECT
3customer_id,
4COUNT(order_id) AS total_orders,
5SUM(order_value) AS total_revenue,    DATE_DIFF(MAX(order_date),
6MIN(order_date), DAY) / 30.0 AS lifespan_months
7FROM `project.dataset.orders`  GROUP BY customer_id),
8ltv_calc AS (
9SELECT
10customer_id,
11total_revenue / total_orders AS avg_order_value,
12total_orders / lifespan_months AS purchase_frequency,    lifespan_months,
13(total_revenue / total_orders) * (total_orders / lifespan_months) * lifespan_months
14AS ltv  FROM order_stats)
15SELECT * FROM ltv_calc;
This query defines each input to the LTV formula in a governed way, using raw transaction data. It keeps the calculation transparent and ready to be standardized across all reporting tools.
SaaS SQL Example
For SaaS and other subscription-based businesses, the standard formula is:
LTV = ARPU ÷ Churn Rate
This model highlights the impact of retention and helps teams understand how small improvements in churn can significantly boost LTV.
Here’s a sample SQL implementation:
1WITH monthly_metrics
2AS (SELECTsubscription_month,SUM(revenue) / COUNT(DISTINCT customer_id)
3AS arpu,COUNT(DISTINCT churned_customer_id) / COUNT(DISTINCT customer_id)
4AS churn_rateFROM `project.dataset.subscriptions`
5GROUP BY subscription_month),ltv_calc
6AS (SELECTsubscription_month,arpu,churn_rate,arpu / NULLIF(churn_rate, 0)
7AS ltvFROM monthly_metrics)SELECT * FROM ltv_calc;
This approach provides a time-based view of LTV, enabling easy tracking of performance trends and testing the effects of retention campaigns.
Governing the SQL with OWOX Data Marts
Once your LTV SQL is finalized, save it as a governed Data Mart in OWOX to ensure consistent, repeatable logic across teams. Instead of copying SQL between tools, analysts can enrich the logic with CRM and Ads joins for cohort or channel-level segmentation.
Set up automated refresh schedules, so your metrics always stay current. With governed access, business users can work in Sheets or Looker Studio, while analysts retain full control of the logic behind every number.
The Outcome: Scalable LTV Models Everyone Can Trust
Centralizing LTV logic in governed Data Marts enables analysts to avoid repetitive SQL updates and the complexity of spreadsheet work. Instead of patching logic across tools, they can define LTV once and serve trusted results everywhere, in Google Sheets or Looker Studio.
This consistency builds trust. Marketing, Finance, and BI all access the same version of LTV, segmented as needed and updated automatically. With reliable metrics in place, teams make faster, more confident decisions about ROI, retention strategies, and campaign budgeting.
Power Your LTV Reporting with OWOX Data Marts
Tired of rebuilding LTV logic across spreadsheets, dashboards, and teams? OWOX Data Marts gives analysts full control to define LTV once in SQL, on top of your warehouse tables. You can segment by channel or cohort, automate refreshes with triggers, and deliver results to Google Sheets or Looker Studio.
Stop wasting time on conflicting metrics. Start driving confident, ROI-focused decisions with governed, reusable LTV models.
Frequently asked questions
.png)


Finally, a tool that doesn't ask business users to learn a new dashboarding UI. Our marketing team already knows Sheets. OWOX just delivers the right data.
Joinable data marts concept was the thing that sold us. We can now use the semantic layer without building one.
Self-hosted the OSS version on Digital Ocean. Zero vendor lock-in. Contributed a Shopify connector back in week two.