Understanding ad hoc analysis and ad hoc reporting: A comprehensive guide for businesses
Ad hoc reporting answers one-off questions standing reports cannot. How it differs from analysis and data exploration, a worked example, and when to make it a report.
Ad hoc reporting is answering a one-off business question with a report made for that question, on current data, usually used once. A standing report tells you what you decided to watch. An ad hoc report answers what you did not know you would need to ask: how much did cancelled orders cost us last year, which campaign brought the customers who returned things, why did one number look off in the meeting.
The trouble is not the idea but the path. In many teams a one-off question becomes a ticket in the analyst’s queue, next to the “one more column” requests, and the answer arrives after the decision. This page separates the four things people call “ad hoc” so you can tell what you are asking for, shows one question answered with one query, and ends with the rule for when a one-off should become a report.
What is ad hoc reporting?
An ad hoc report is built when the question arrives, not before. It answers one specific question, such as the number of resolved support tickets last week or the daily calls one salesperson completed, and it is normally discarded or kept as a saved query once it has been read. If the same question comes back, it stops being ad hoc and belongs in a standing report: a marketing report built around a decision is the guide to building one.
Four things people call ad hoc
Four things people call ad hoc
| Question it answers | Who asks | Output | How long it lives | |
|---|---|---|---|---|
| Standing report | “How are we doing against what we planned?” | The team, on a schedule | A fixed layout, refreshed | Months or years |
| Ad hoc report | “What is this one number?” | Anyone, once | One table or chart | One reading, or a saved query |
| Ad hoc analysis | “Why did it change?” | An analyst or a curious manager | Findings, with the cuts that led to them | The length of the investigation |
| Data exploration | “What is in this dataset?” | An analyst, at the start | Notes on structure, patterns and gaps | Until the question is known |
Standing reports are the ones other guides call canned or scheduled reports. The line between ad hoc reporting and ad hoc analysis is the second question: a report gives the number, an analysis asks why it moved and tries cuts until something explains it.
OWOX Data Marts
See your first report built in real time. 15 minutes.
- Connect your data warehouse
- Pick your metrics
- Get a live Google Sheets report
In the time it takes to write a ticket. Then imagine never writing that ticket again.
Book a DemoWe'll use your actual use case
One question, one query
Take a question a finance lead might send you on a Friday: how much did cancelled and returned orders cost us in 2025? No standing report holds it, because nobody tracked “orders we did not keep” as a headline number.
Using the demo online store (synthetic data, so no figure here describes a real business; order value is sale price times quantity, the demo’s line_revenue), one query over the order tables gives:
| Status | Orders | Gross order value |
|---|---|---|
| Completed | 5,913 | $2,917,862 |
| Cancelled | 713 | $347,169 |
| Returned | 329 | $155,155 |
Cancelled and returned orders together are 1,042 of 6,955 orders, 15% of orders and 14.7% of gross value, $502,324. That is the answer. It goes into a message with the definition (“order value before cancellations and returns”) and the date range. It does not need a dashboard.
This is the query; swap in your own order and purchase tables.
SELECT o.status,
       COUNT(DISTINCT o.order_id) AS orders,
       ROUND(SUM(p.line_revenue)) AS gross_order_value
FROM `owox-demo.ecommerce.orders` AS o
JOIN `owox-demo.ecommerce.purchases` AS p ON p.order_id = o.order_id
WHERE o.order_date BETWEEN '2025-01-01' AND '2025-12-31'
GROUP BY o.status
ORDER BY orders DESC
If the same finance lead asks again next quarter, that is the moment to save the query, and to ask whether it should become a report.
What is data exploration? Patterns, trends and outliers
What is data exploration? Patterns, trends and outliers
Data exploration is the first step of data analysis, where analysts examine a dataset to understand its structure and key characteristics before asking a sharper question. It is looking for patterns, trends and outliers: what repeats, what moves over time, and what does not fit.
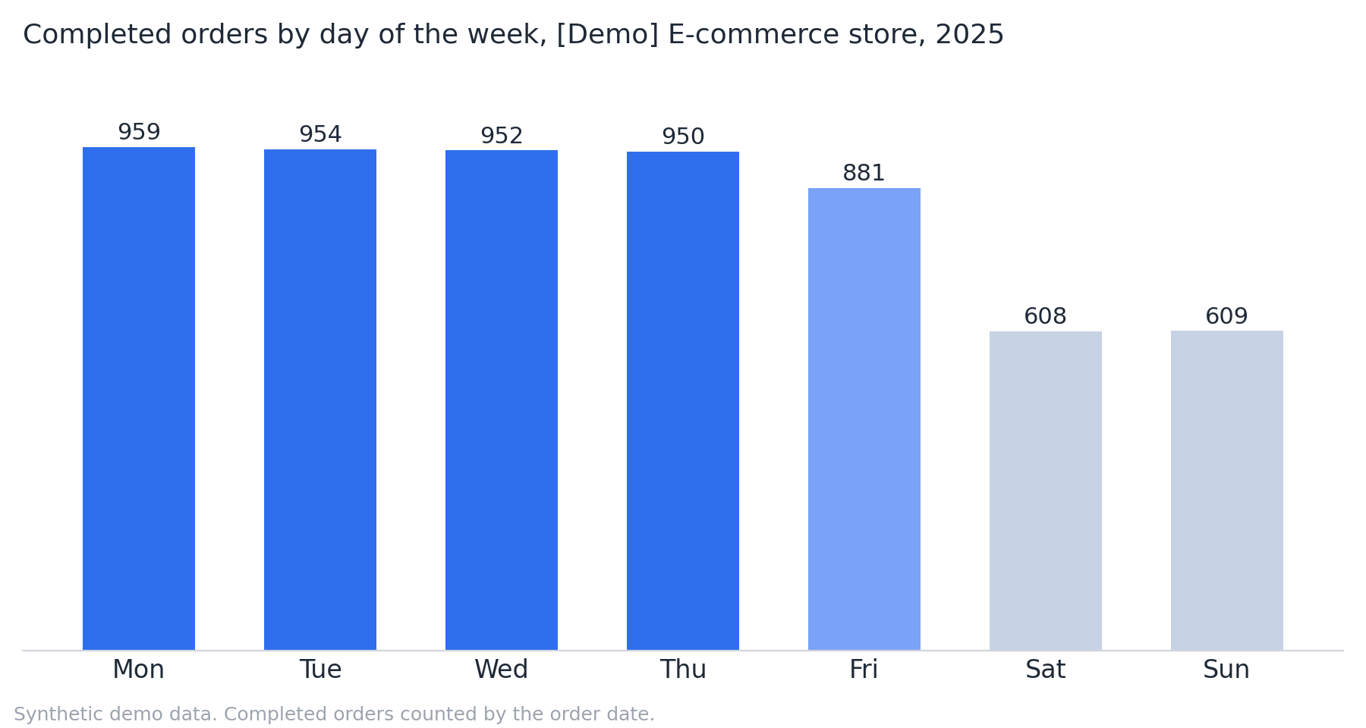
A data exploration example from the same demo store: counting completed orders by day of the week in 2025 shows a pattern, between 950 and 959 orders on each of Monday to Thursday, 881 on Friday, and 608 and 609 on Saturday and Sunday. Checking each paid platform’s daily spend in the ad performance table for outliers (days more than three standard deviations from that platform’s 2025 average) found none. That is a useful result: it says a spike did not drive a number someone is about to ask about.
Data exploration software is whatever lets you look at the rows, counts and charts of a dataset before you commit to a question: a spreadsheet pivot, a SQL editor or a notebook. The tool matters less than the habit of looking first.
When an ad hoc request should become a standing report
When an ad hoc request should become a standing report
A simple rule keeps the ticket queue short and the report list honest:
- Asked once: answer it in a message and keep the query.
- Asked twice: save the query and name it by the question, so the next person finds it.
- Asked a third time, or by a different team: make it a standing report with an owner, a definition of each number and a schedule.
For triaging the queue, an analyst’s guide to handling ad-hoc requests covers how to triage them. The risk on the other side is a stack of one-off reports nobody reopens, each with its own definition of the same number. Why teams bring different numbers to the same meeting is the longer version of that problem. Ad hoc reports also tend to stay in the team that asked for them, which makes them a source of data silos; saving the query and its definition is the cheapest fix.
Where an ad hoc answer should live
Where an ad hoc answer should live
A one-off answer needs access to the data, a way to ask and a definition of the number everyone agrees on. Ad hoc work is quick when the shared definitions already sit in a Data Mart, a dataset defined in SQL on your warehouse with an owner and a description, and the people who ask read it where they work. OWOX Data Marts publishes one to Google Sheets, so a one-off question starts from an agreed number, not from raw tables.
Turn your data into decisions.
Governed data marts give you the clean foundation ML needs to actually work.
- No AI hallucinations
- Analyst-governed definitions
- Every number traces to SQL
Frequently Asked Questions
What industries benefit from ad hoc reporting?
Industries like sales, marketing, finance, healthcare, retail, manufacturing, and technology use ad hoc reporting for targeted insights, efficiency improvements, and data-driven decision-making.
How can marketers effectively perform ad hoc analysis?
Marketers should clarify the problem, collect relevant data, perform analysis using self-service tools, extract actionable insights, and present findings with clear visuals.
What challenges come with ad hoc reporting?
Challenges include the potential for data silos, over-reliance on specific reports, inconsistent data alignment across stakeholders, and the need for data literacy among users.
What are the benefits of ad hoc reporting?
Ad hoc reporting improves efficiency, provides real-time insights, reduces costs, and enhances decision-making by allowing users to generate tailored reports without extensive IT involvement.
How is ad hoc reporting different from canned reporting?
Ad hoc reporting is on-demand and customizable, providing real-time insights for specific needs, while canned reporting follows a pre-defined format for routine, scheduled analysis.
What is ad hoc analysis?
Ad hoc analysis is a business intelligence method used to answer specific, immediate business questions by diving deeper into data for actionable insights.