

How to Build a Trusted Metrics Layer for Marketing Teams
Stop debating whose numbers are right. Learn how a single analyst can build a trusted metrics layer for marketing teams with OWOX.


Marketing teams rely on metrics to measure performance, but getting everyone to agree on the numbers is a constant struggle. One team might count every form fill as a lead, while another only includes qualified prospects. This lack of alignment results in broken dashboards, conflicting reports, and wasted time debating whose numbers are accurate.
This article explains why marketing metrics break down, what actually keeps them consistent, and how a single analyst can set up a trusted metrics layer for the whole team – without a brittle six-month project. You will also see how OWOX helps deliver consistent, governed definitions that work across dashboards, spreadsheets, and scheduled reports.
Why marketing metrics often lead to confusion
Teams use the same metric names but define them differently, and that gap quietly corrupts every report downstream. Here is why these mismatches happen and what actually causes teams to see different numbers.
Same metrics are defined differently by different teams
Marketing, sales, and product teams may all track leads, conversions, and engagement, but each defines them differently. Some teams include newsletter signups as leads, others focus only on qualified contacts, and a few count app signups. These differences create misalignment, conflicting dashboards, and repeated arguments over which numbers are accurate.
The real problem is the lack of shared, governed definitions
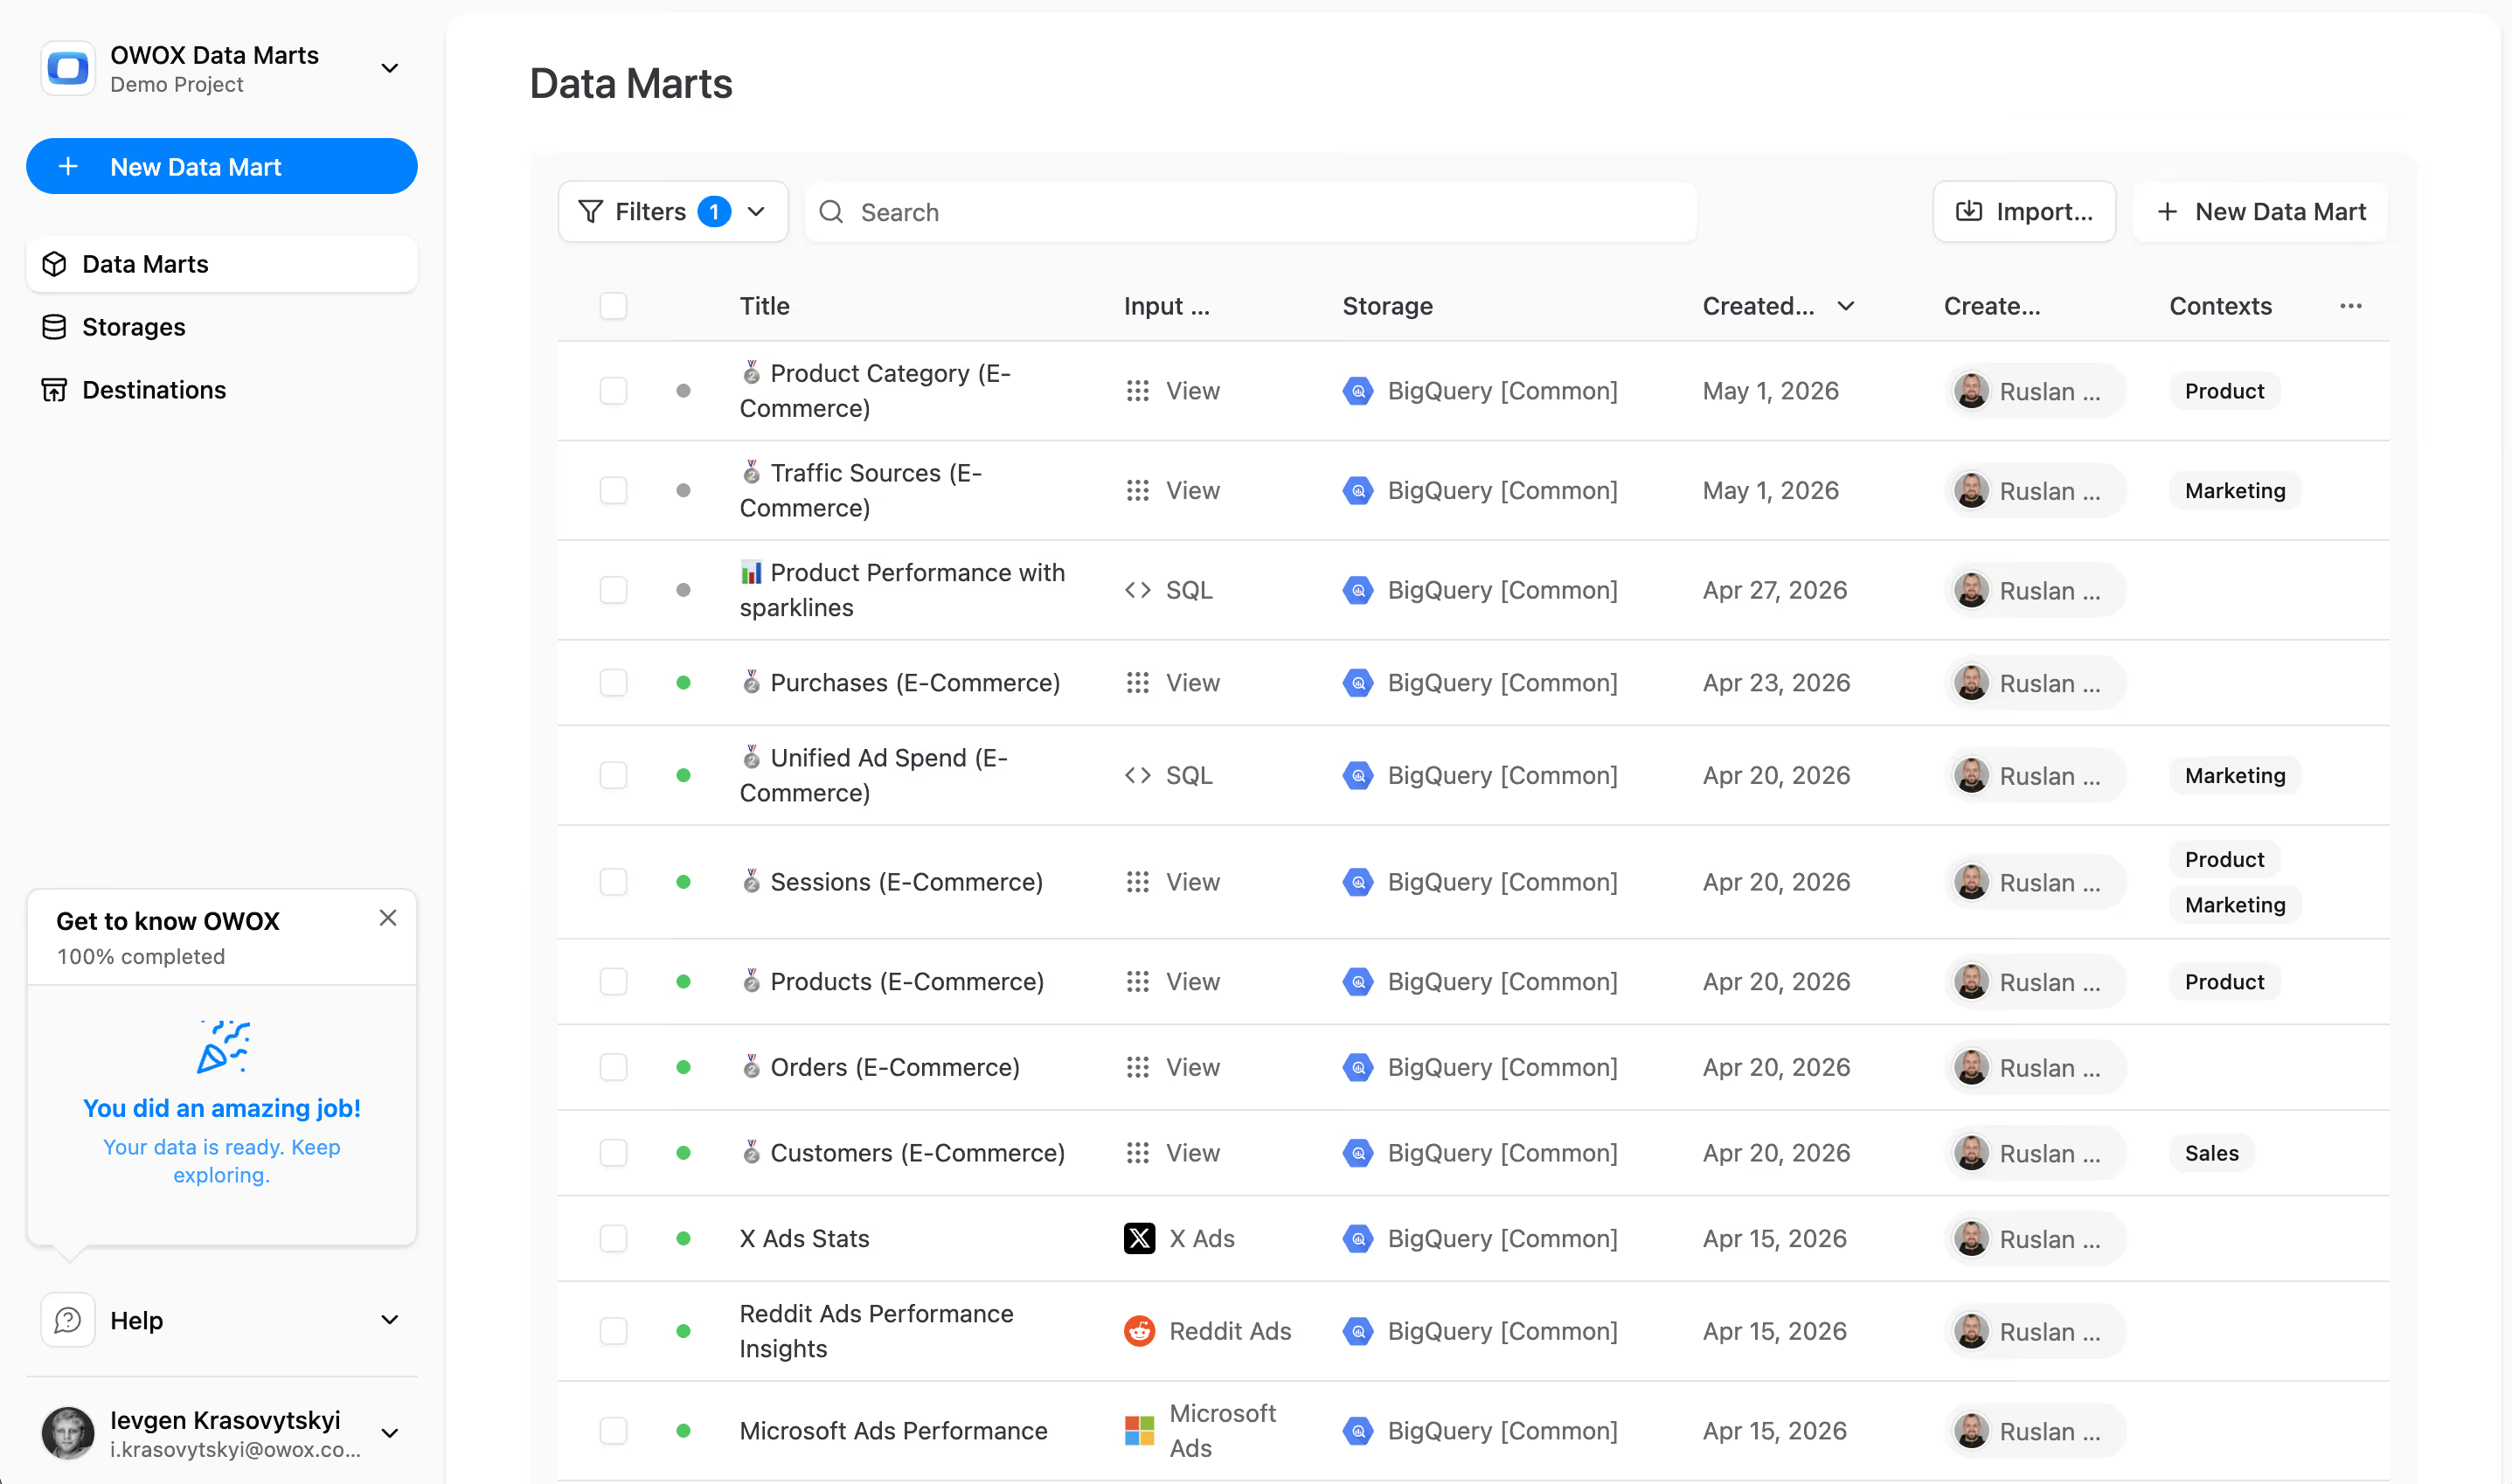
The issue is not with the tools or platforms – it is the absence of a single, analyst-owned definitions layer. When every team stores its own metric logic in separate spreadsheets or BI filters, mismatched reports are inevitable. What teams need is not a complex semantic layer project; they need governed Data Marts where one analyst defines a metric once and every report pulls from that same source.
What a trusted metrics layer is and why it matters
A trusted metrics layer is a simple concept: one place where your key marketing metrics are defined clearly, governed by an analyst, and reused automatically across every report. It does not require a dedicated semantic layer tool or months of infrastructure work.
A central place to define key marketing metrics
A trusted metrics layer acts as a central source where all your important marketing metrics are defined consistently. Instead of teams storing their own definitions in various tools – such as GA4, CRM, or spreadsheets – everything lives in one governed location.
This removes confusion, keeps everyone aligned, and ensures that all departments use the same logic when measuring results.
Clear definitions for key terms like leads and sessions
Common metrics like leads, sessions, and conversions often get misunderstood because different teams define them in their own way. A trusted layer helps by creating shared, analyst-approved definitions for these metrics.
When everyone uses the same meaning, it becomes easier to align reports, avoid mistakes, and make decisions based on consistent data.
One logic applied across all tools and reports
When a metric is defined in a governed Data Mart, that same definition flows into every connected report – whether in Google Sheets, dashboards, or scheduled Slack digests. You do not have to recreate the logic or double-check formulas in every tool. This consistent logic helps teams work faster, avoid reporting mistakes, and build trust in the numbers they use every day.
Why every marketing team needs governed metric definitions
Marketing teams pull data from many sources. Without shared, analyst-governed definitions, every source becomes its own version of the truth. Here is how solving this problem pays off across the whole organisation.
Achieve alignment across all departments
When marketing, sales, product, and analytics teams follow the same metric definitions, confusion and miscommunication go away. With governed definitions in place, everyone uses the same language when looking at data. This makes collaboration easier and turns reporting disagreements into a clear, shared understanding across teams.
Ensure consistency in dashboards and reports
Each team usually builds its own dashboards using separate logic, which leads to different numbers for the same metric. Governed Data Marts solve this by applying one consistent logic to all reports. Whether you view performance in Google Sheets, Looker Studio, or a Slack digest, you see the same data – helping teams align and act on accurate, unified insights.
Stop redefining metrics and start saving time
Analysts often spend hours redefining the same metrics for different teams and platforms. This repetition wastes valuable time and increases the risk of errors. With a governed Data Mart library, metrics like "lead" or "conversion rate" are defined once and reused everywhere, allowing analysts to focus on deeper analysis instead of routine reporting fixes.
Make faster, smarter decisions based on trustworthy data
When teams trust the data, they can act quickly without second-guessing reports. Metrics become easier to understand and more reliable when every number traces back to analyst-approved SQL. This builds confidence, speeds up decision-making, and helps marketers focus on improving performance instead of debating definitions.

What goes wrong when metric definitions are not governed
Without governed, analyst-owned definitions, teams create their own versions of every metric. This leads to mismatched dashboards, constant confusion, and wasted time trying to explain or fix reports instead of using them to make decisions.
Teams create conflicting definitions of key metrics
Without a shared definitions layer, every team ends up creating its own logic for metrics like leads or conversion rate. One team might include trial signups as leads, while another only counts qualified prospects. These differences lead to dashboards that show different results for the same question, making it difficult to collaborate or agree on what the data actually means.
Disagreements and mistrust become commonplace
When each team uses its own logic, it is only a matter of time before conflicts arise. Reports are questioned, meetings turn into arguments about which numbers are correct, and trust in data breaks down. This constant back-and-forth slows down decision-making and creates unnecessary tension between departments that should be working together.
Analysts waste time fixing reports instead of building insights
Without governed definitions, analysts are stuck in reactive mode – rebuilding reports, redefining the same metrics, and responding to doubts from different teams. Instead of focusing on strategy and insight generation, they are busy cleaning up mismatches. This repetitive work limits their impact and makes it hard to scale reporting across the organisation.
How to create a trusted metrics layer without a large team
You do not need a big data team, a specialist tool, or a six-month semantic layer project to achieve consistent marketing metrics. The following steps show how a single analyst can get there with clear logic and accessible tools.
Step 1: Identify and prioritise key marketing metrics
Begin by listing the core marketing metrics your team uses most often – such as leads, sessions, cost per click, and conversion rates. Then prioritise them based on how much they influence business and campaign decisions. This helps you focus on the metrics that matter most and ensures your governance layer is built around real reporting needs from the start.
Step 2: Define clear SQL logic for each metric
Once you have identified the key metrics, write the definition as analyst-approved SQL. For example, clarify what qualifies as a lead: include the traffic source, channel grouping, and form completion criteria. Storing this logic in a governed Data Mart removes guesswork and ensures every team member, tool, and dashboard uses the same calculation every time.
Step 3: Publish the Data Mart and enable self-service
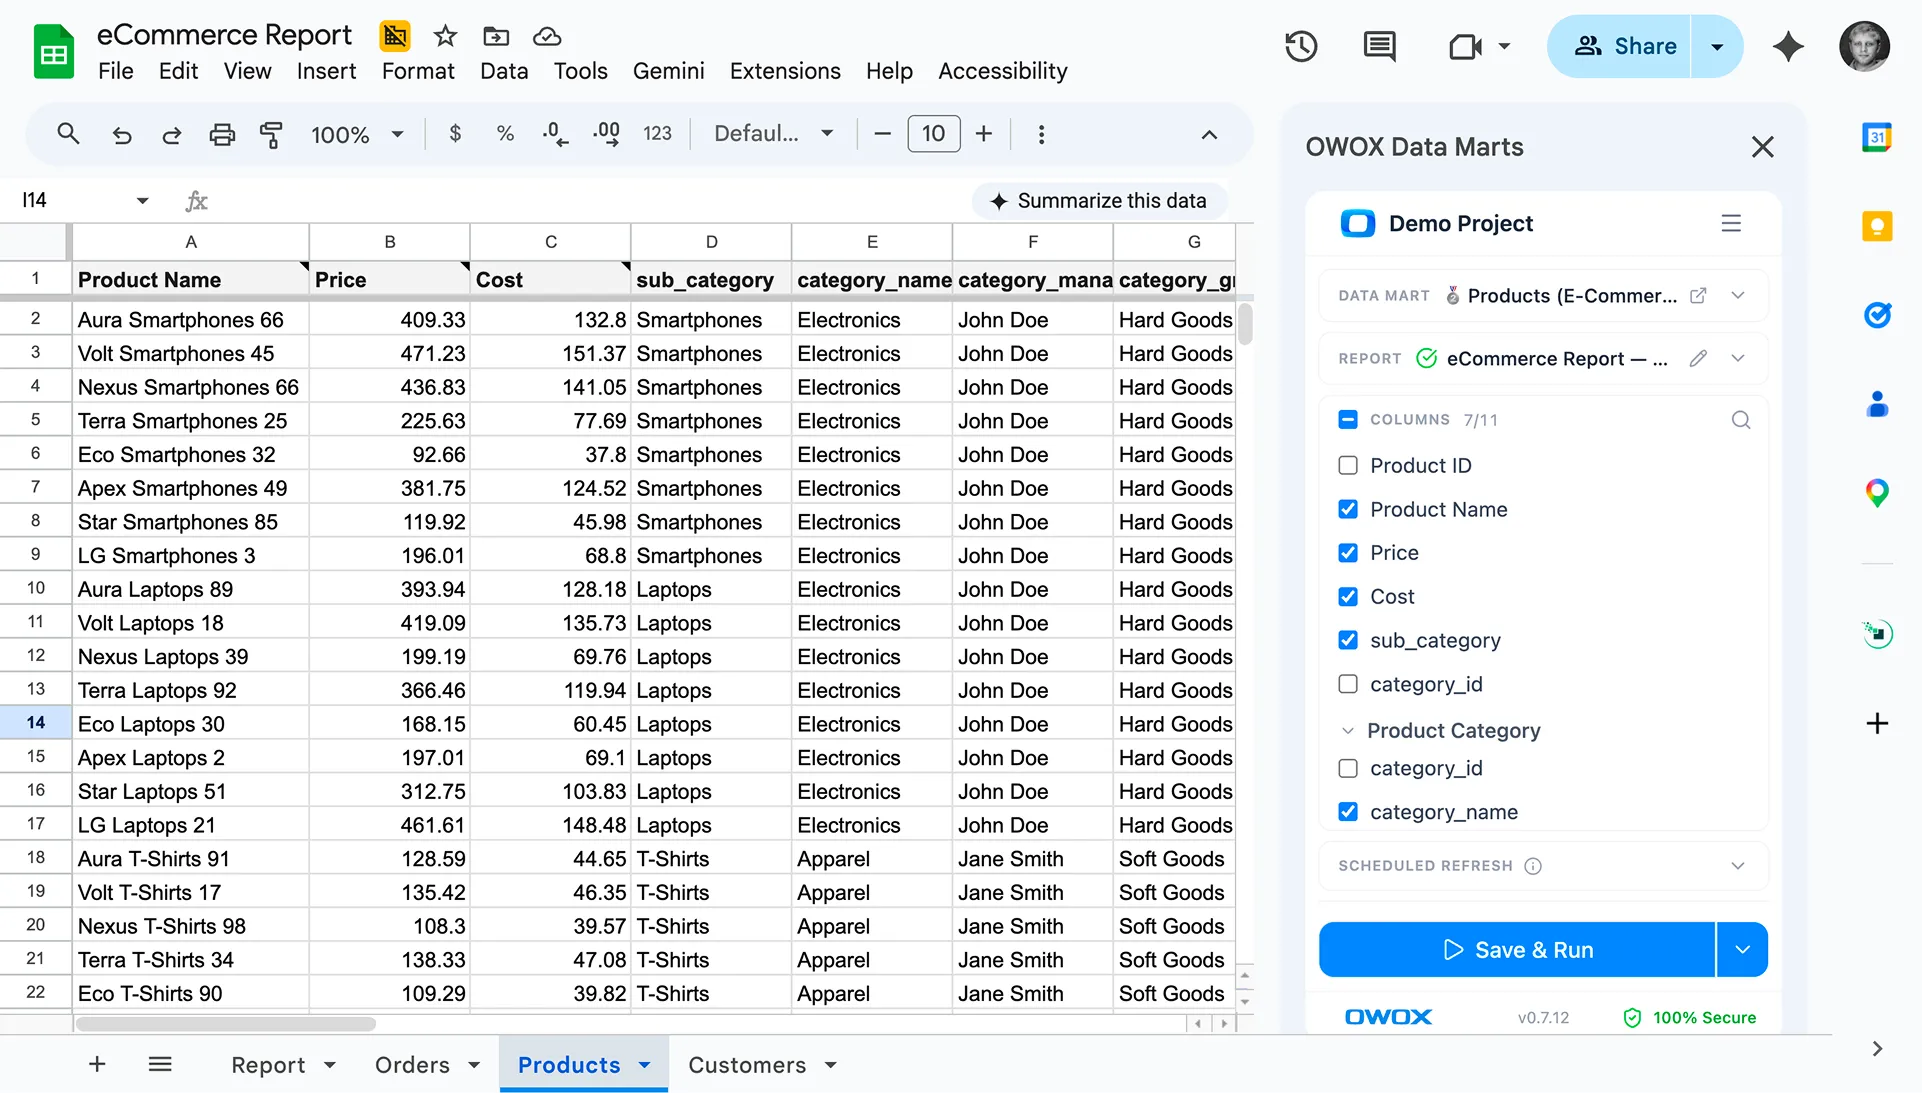
Once your SQL definitions are ready, publish them as governed Data Marts in your warehouse. Business users can then browse the Data Mart library in Google Sheets using the OWOX Sheets Extension – no SQL required. When an analyst updates the mart logic, every connected Sheet refreshes automatically. This eliminates repeated formulas, cuts reporting errors, and ensures consistency across all teams.
How OWOX makes building a trusted metrics layer straightforward
Creating a consistent, governed metrics layer does not have to be complex or time-consuming. OWOX gives analysts the tooling to define, publish, and govern Data Marts – then puts those metrics directly in the hands of business users, without any extra integration work.
Use a ready-made data model built for marketers
OWOX ships with a built-in marketing data model tailored to tools like GA4, Google Ads, and CRM systems. This ready-made structure is designed for campaign tracking and funnel analysis, so analysts can skip the boilerplate setup and publish governed metrics that speak the marketing team's language from day one.

Analyst defines the metric once – everyone uses it forever
With OWOX Data Marts, an analyst writes the SQL for a core marketing metric – "qualified lead," "cost per acquisition," "session by channel" – and publishes it as a governed Data Mart. No engineering support needed. That definition then flows into every report automatically.
There is no brittle semantic layer to maintain, no six-month project, and no risk of one team quietly redefining the metric in a spreadsheet. The analyst owns the definition; OWOX governs and schedules it. Every number is traceable to the SQL that produced it – making this approach audit-ready by design, with no AI hallucinations possible because nothing is inferred.
Instantly available across Sheets, dashboards, and scheduled reports
Once metrics are published as Data Marts, they automatically flow into your reporting tools – Google Sheets, Looker Studio, and scheduled digests delivered to Slack, Teams, or Email via OWOX AI Insights. There is no extra integration or manual adjustment required.
Teams across the company access the same trusted numbers, regardless of where they view the data – ensuring cross-platform clarity and alignment.

Scheduled narrative insights without hallucinations
OWOX AI Insights lets analysts create a Markdown template with {{value}} placeholders. Each placeholder is filled by deterministic, analyst-approved SQL – not freeform AI generation. The AI writes the prose narrative around those numbers, then delivers the briefing to Slack, Teams, or Email on schedule.
This means marketers receive a clear, human-readable summary of campaign performance – and every single number in that summary traces back to SQL the analyst reviewed and approved. No guessing, no hallucinations, full audit trail.
Real-life example: a marketing team before and after governed Data Marts
At one fast-scaling B2B SaaS firm – 300 people, roughly $5 million in annual marketing spend – the Marketing, Sales, and Analytics teams relied on separate tools and separate definitions. With no shared logic for key metrics, dashboards disagreed, meetings stalled over data disputes, and growth plans sat on hold until numbers could be reconciled.
Before: conflicting metrics and constant reporting chaos
Marketing pulled numbers from GA4 and Google Ads, Sales lived in HubSpot CRM, and Analytics stitched everything together in Looker and Google Sheets. Because each platform defined "lead," "MQL," and "pipeline value" in its own way, dashboards disagreed by up to 25%.
Weekly reviews opened with arguments over which figure was "right," and roughly 20% of the ad budget chased prospects that never closed. Analysts lost significant hours every week reconciling filters and formulas, stretching revenue forecasts from hours to three days and freezing new-campaign approvals until the data could be patched.
After: shared Data Marts, self-serve access, and instant clarity
A single analyst defined one behaviour-based, company-wide definition of a "qualified lead" as a SQL Data Mart in OWOX. That logic now flows automatically into Looker dashboards, Google Sheets models, and scheduled Slack digests – all from the same governed source. Data stays in their BigQuery warehouse; OWOX never copies it to a vendor cloud.
Within one quarter, MQL-to-SQL conversion climbed from 42% to 55%, Sales cut lead-rejection from 27% to 11%, and analysts reclaimed three-quarters of the hours once spent on data triage. Cost-per-acquisition fell, revenue forecasts refresh in under 15 minutes, and leadership bases decisions on a single, trusted set of numbers.
Trusted reports built from the marketing data model
With OWOX, the team connected all their key data – ads, sessions, events, visitors, and leads – through a shared data model using fields like visitorId. This lets them build consistent metrics like "cost per qualified lead" or "leads by channel" across Sheets and Looker Studio, without rewriting logic. Reports are now accurate, fast, and easy for everyone to use.
The analyst's new role: owner, not firefighter
With governed Data Marts in place, the analyst defines and governs metrics once – letting every tool reuse the same logic automatically. Freed from patching filters and justifying mismatched numbers, analysts can focus on uncovering trends, advising teams, and driving strategy.
From fixing dashboards to owning metric definitions
Before governed Data Marts, analysts often spent their time fixing broken dashboards and answering the same question over and over – "Which number is right, the one in the dashboard or the one in the CRM?"
With a trusted metrics layer in place, they define the logic once and manage it centrally. This shifts their role from reactive troubleshooting to owning and maintaining the foundation of reliable, consistent reporting.
Marketers gain speed with self-service reporting
With clear metrics already defined, marketers no longer need to wait for analysts to build or fix reports. They access the data they need directly through the OWOX Sheets Extension – browsing the Data Mart library, joining marts by analyst-defined join keys, picking columns, and refreshing inside Google Sheets. This speeds up decision-making, supports quicker campaign adjustments, and gives marketing teams the freedom to explore insights independently.
Governed Data Marts empower analysts and free marketers
When every report runs on one trusted data model, teams stop questioning numbers. Analysts take charge of defining and updating metrics; marketers receive fast and consistent answers. OWOX is the hand-off layer between the data team and business stakeholders – not a replacement for analysts, but the system that makes their work scale.
Simplifying metric governance for small teams
Consistent, governed marketing metrics may sound like an enterprise-only project, but they do not have to be. Even a small team can get there without a big budget, a specialist tool, or engineering resources – by starting with clear logic and the right approach.
You don't need a big team or big budget
Many assume that governing metrics at scale is meant only for large companies with big budgets and engineering teams. That is not the case. With the right approach, even a single analyst can create a reliable metrics layer using SQL Data Marts and clear definitions – without needing complex infrastructure or a six-month project.
Begin with the metrics that matter most
You do not have to govern everything at once. Start by identifying a few key marketing metrics – like leads, conversions, or CPC – that are used most often. Write clear, shared SQL definitions for those first. Once they are published as Data Marts, apply them across dashboards and reports. This creates consistency without making the system too complex from the beginning.
OWOX delivers simplicity and speed
OWOX is designed to help marketing teams build a governed metrics layer with minimal technical overhead. No dbt, no complex infrastructure, no vendor lock-in – your data stays in your warehouse and every number traces to SQL the analyst owns. Analysts define the metrics in SQL, OWOX governs and schedules them, and the whole team self-serves from Google Sheets or receives scheduled narrative digests. The entire process from first Data Mart to live report takes minutes, not months.
Build your trusted metrics layer with OWOX
You do not need a large team, a complex infrastructure project, or months of work to fix broken reporting. OWOX gives you everything needed to build a trusted metrics layer in one place – with a ready-made marketing data model, analyst-governed SQL Data Marts, and self-service access for the whole team via Google Sheets.
A single analyst can publish the first governed metric in minutes. That definition then flows into every report, dashboard, and scheduled digest automatically – with a full audit trail and no AI hallucinations, because every number comes from SQL the analyst approved. Start today and give your marketing team clear, consistent data they can actually rely on.
Frequently asked questions






"AI by its nature will hallucinate. You need guardrails so you can trust your data."
"We had six or seven different channels and no single source of truth. It was almost impossible"
"We regained time. And time is the one resource that never comes back."