

Why Self-Service Reporting Fails (And How to Fix It)
Self-service reporting fails not because of tool access, but due to missing shared metric definitions and governed data models.


Ever wondered why your team keeps asking for the same report every week, even with full dashboard access? Self-service reporting was meant to save analyst time and reduce back-and-forth. Instead, it's created more confusion, duplicated efforts, and numbers nobody trusts.
The problem isn't access — it's structure. Without shared metric logic and clearly governed definitions, teams can't trust what they see. This article explains why self-service breaks down and how to fix it without building a six-month semantic layer project.
When did self-service reporting turn into a nightmare?
Companies invested in dashboards, trained every team, and gave open access to tools like Looker Studio and GA4. But the questions haven't stopped — they've just moved to Slack and email. Marketers still don't trust the numbers, can't agree on basic metrics, and turn to analysts for help.
What was meant to be a self-service solution has become a marketing reporting nightmare, leaving data teams stuck in the middle.
Here's where self-service reporting typically breaks down:
Most common myths about self-service reporting
Despite good intentions, most self-service systems don't work as expected. They're built on assumptions that seem logical on the surface but don't hold up in practice. These myths often lead teams down the wrong path, resulting in broken reports, distrust in data, and overworked analysts.
Myth 1 – Dashboards equal self-service
Many teams believe that providing everyone with a dashboard is sufficient. Once it's live, they assume users will stop asking for reports and start making decisions on their own.
Reality: Dashboards only provide access, not clarity. Without context, logic, or shared metric definitions, marketers don't trust the numbers. They still rely on analysts to explain what the data means.
Myth 2 – Connecting GA4 and Ads is enough
Connecting GA4, Google Ads, or Facebook Ads to a dashboard tool can give the illusion that reporting is ready to go. The data appears in charts, so it feels like the job is done.
Reality: These connections bring in raw, unstructured data. Without modeling or consistent metric logic, reports become hard to read, hard to trust, and easy to misinterpret. Teams end up spending more time cleaning and explaining data than analyzing it.
Myth 3 – Users will figure it out once they have access
The assumption is that access to data tools is enough. Users are expected to explore, build reports, and find answers independently after a few training sessions.
Reality: Most marketers aren't trained to filter, join, or interpret raw data. Without structure, they get stuck, make mistakes, or end up asking analysts to "just do it for them."
Why self-service fails without a proper data model
Self-service reporting promises agility, but it can't function without a solid foundation. Without structured modeling, teams work with inconsistent metrics, misread data, and duplicate efforts.
Raw data is too complex for marketers to use
Raw data from GA4, ad platforms, or CRM tools is often full of technical fields and nested formats. Without transformation, marketers struggle to understand or use it. They may overlook key insights, rely on guesswork, or abandon the tool altogether — turning back to analysts for clarity and support.
Everyone defines metrics differently
When there's no central definition, terms like "lead," "conversion," or "engagement" are interpreted differently across teams. Each department builds reports based on its own logic. This leads to misalignment, conflicting outcomes, and constant questions about which number is right and who owns the source of truth.
Without governed metric definitions, there's no shared truth
A governed data model translates raw data into clear business terms and consistent calculations. It acts as a shared contract — ensuring all reports follow the same logic. Without it, dashboards become disconnected, and teams lose trust in the data, wasting time trying to validate or reconcile different reports.
The good news: you don't need a brittle, six-month semantic layer project to achieve this. Governed metrics can live at the Data Mart level — defined once by an analyst, reused everywhere.
What true self-service reporting actually requires
Self-service reporting isn't just about giving access to data tools. It requires structure, shared logic, and the right setup behind the scenes. Below are the key elements needed to make self-service work reliably at scale.
Shared trust through centralized metric definitions
When every team defines metrics differently, reporting becomes chaotic. A centralized metrics approach solves this by standardizing key definitions — "lead," "CPC," "conversion" — across all tools.
This shared source of truth ensures consistency, prevents confusion, and builds trust in self-service reporting. Everyone works with the same numbers, regardless of where they view them.
Structural clarity through clean joins and modeling
Self-service reporting requires proper data modeling to make datasets usable and accessible. Marketers can't analyze fragmented tables or figure out joins on their own.
When analysts build clean, well-structured models with defined relationships across sources, business users can explore data confidently — without getting stuck in technical issues or misinterpreting connections between datasets.
Access in the formats teams actually use
Dashboards aren't always the most effective way for marketers to work with data. Many prefer tools they already use — like Google Sheets — or want scheduled briefings delivered to Slack or email. Self-service reporting should support these familiar formats, making data access easier and faster.
Logic ownership that stays with analysts
Analysts should own and define the core logic behind every metric, ensuring it's accurate, consistent, and aligned across the business. Marketers can explore and use that logic without needing to change or duplicate calculations. This separation of responsibilities protects data quality while allowing business users to work independently with trusted, pre-modeled metrics in the tools they prefer.
How OWOX enables real self-service reporting
OWOX solves the real reason self-service reporting fails: inconsistent logic and unclear metric definitions. It lets analysts maintain control over the data model while giving marketers the freedom to explore and use data without confusion or delays.
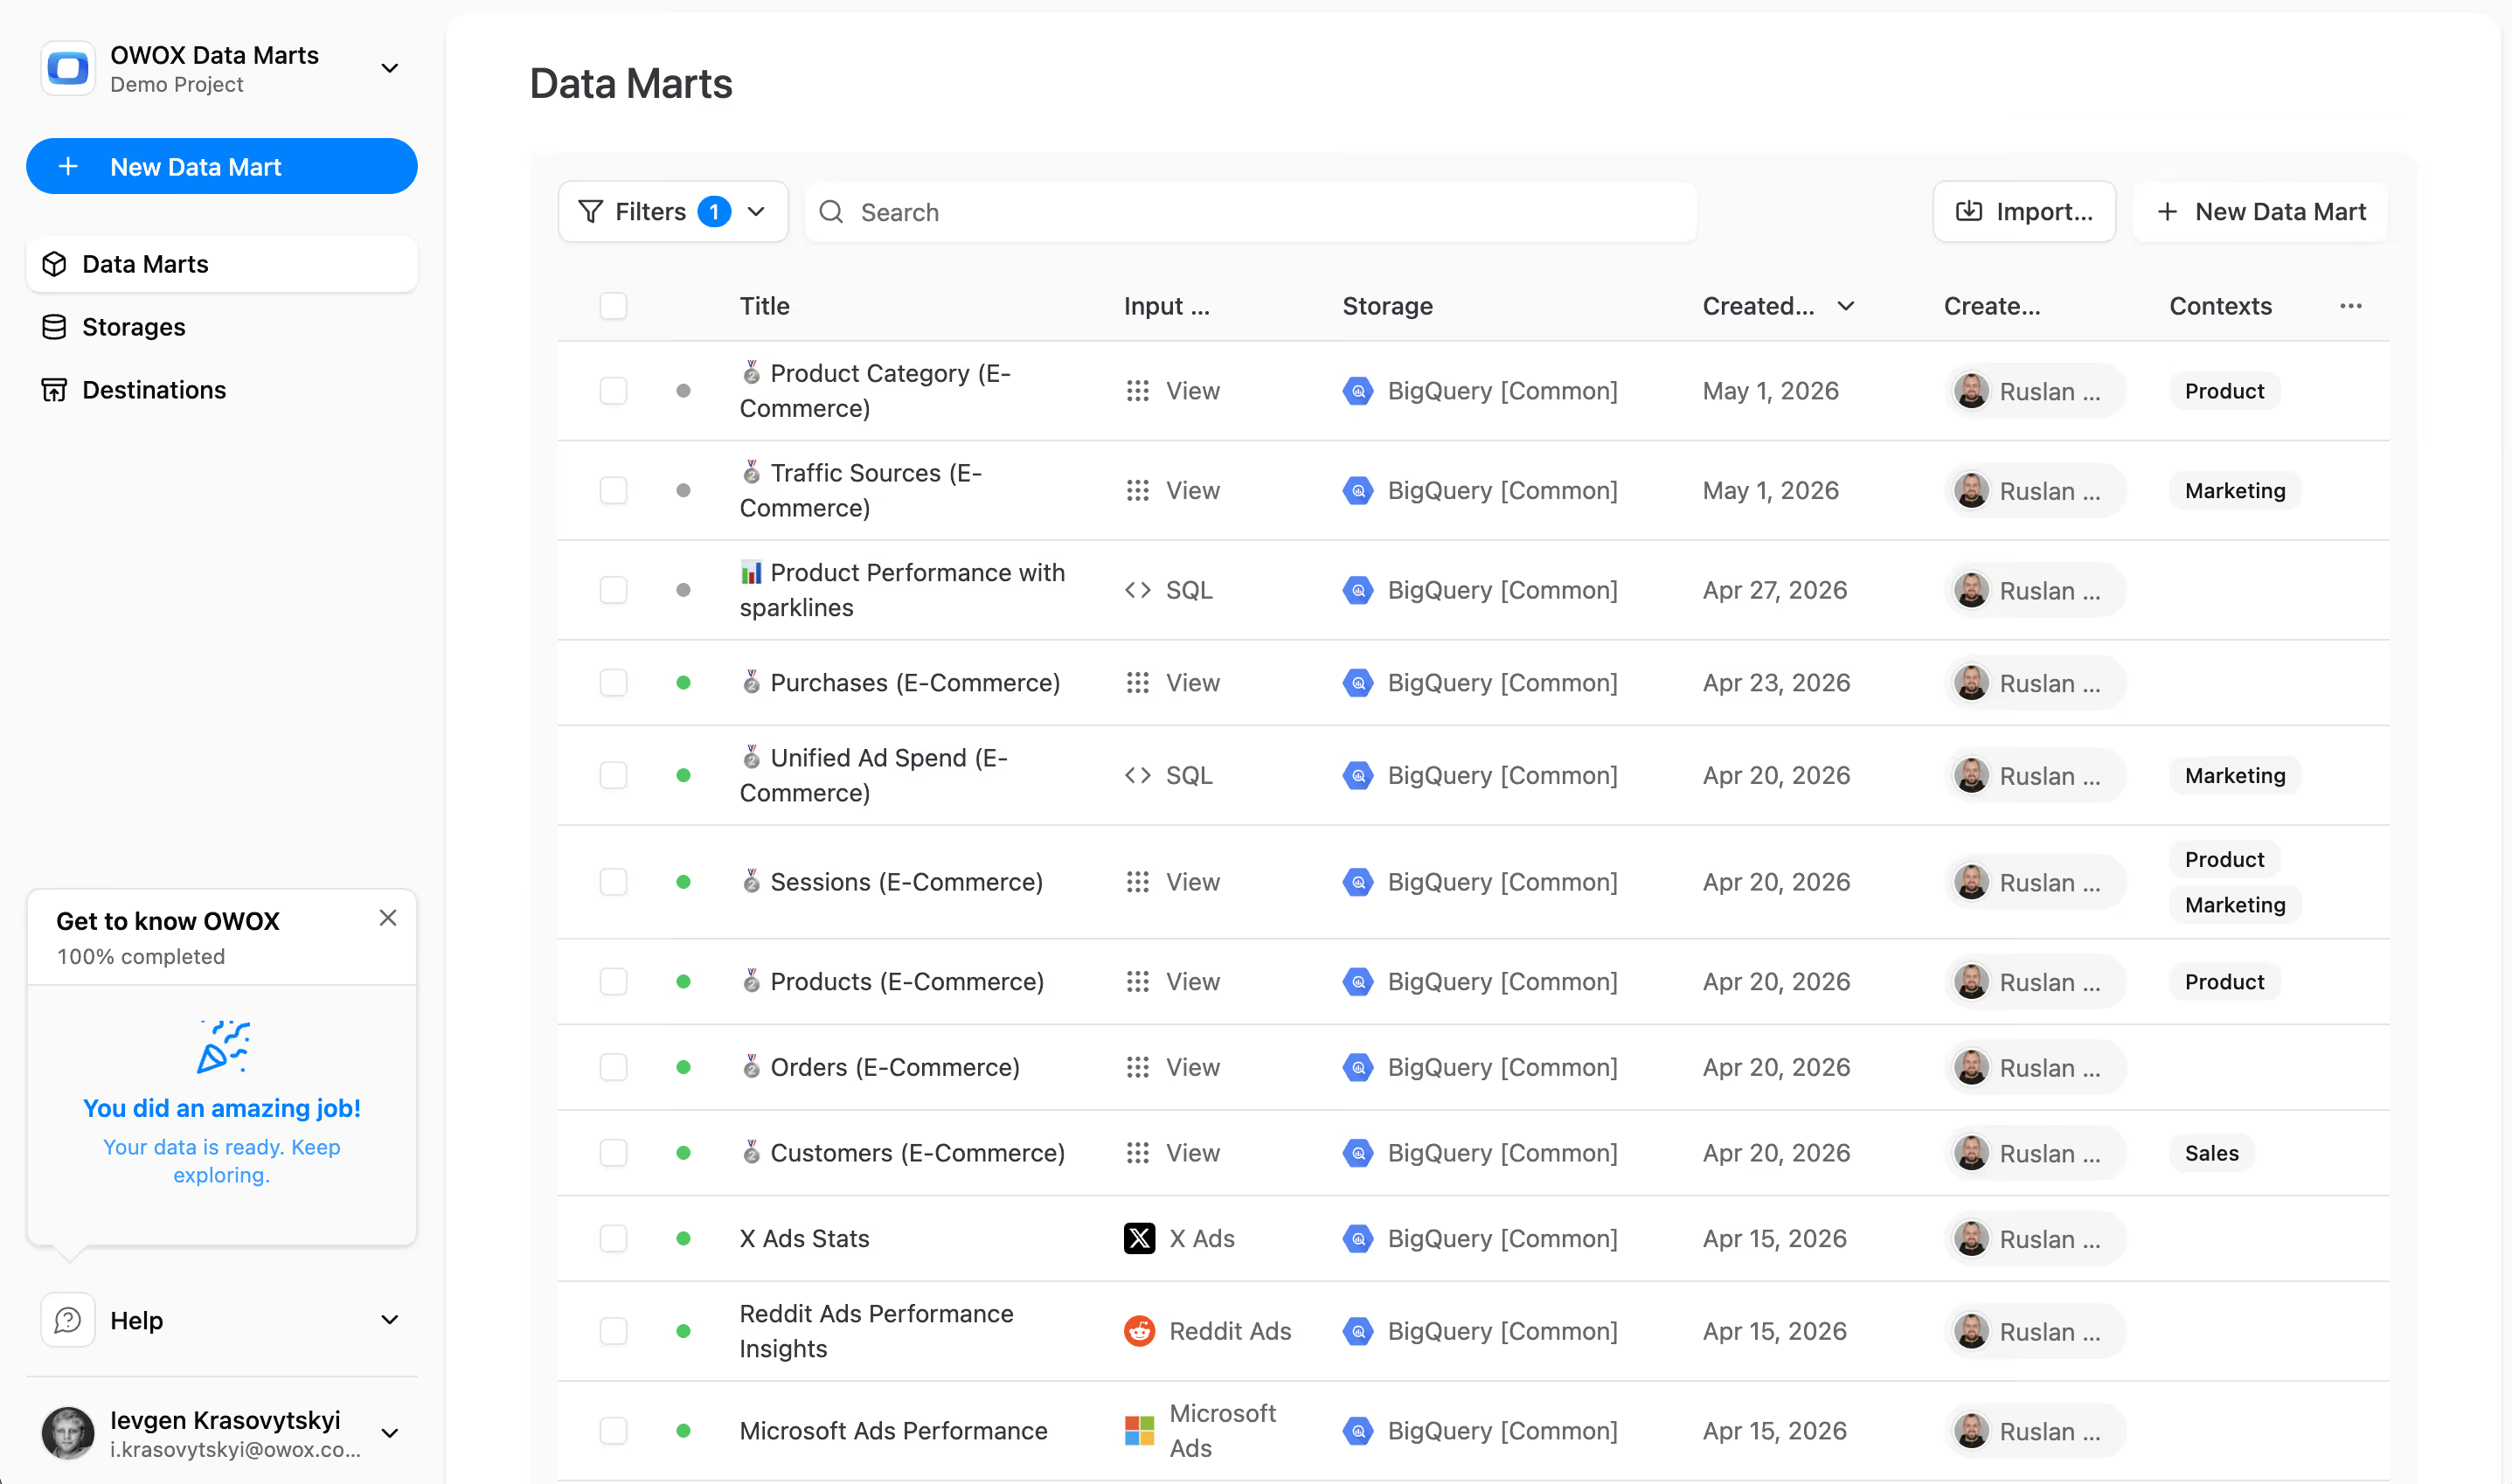
Analysts define Data Marts, not just visuals
With OWOX Data Marts, analysts write SQL that encodes the business logic — session definitions, cost-per-lead calculations, attribution rules — and publish it as a governed, reusable Data Mart. Marketers no longer build their own formulas or argue over what a metric means, because the logic is already defined, approved, and consistent across tools.
This is not automatic transformation. The analyst writes the SQL; OWOX governs, schedules, and publishes it. The logic lives in analyst-owned SQL — not in vendor templates or black-box pipelines.
Centralized logic across all data sources
OWOX Data Marts bring together data from GA4, ad platforms, CRMs, and more — all governed through the same Data Mart library. Instead of stitching together exports, reports draw from a single source of truth. This makes dashboards more accurate, reduces duplication, and ensures teams always work with clean, aligned data.
And because data stays in your warehouse — BigQuery, Snowflake, Athena, Redshift, or Databricks — OWOX never copies it to a vendor cloud. There's no lock-in, and your analysts own the SQL.
Marketers self-serve in Sheets — no SQL needed
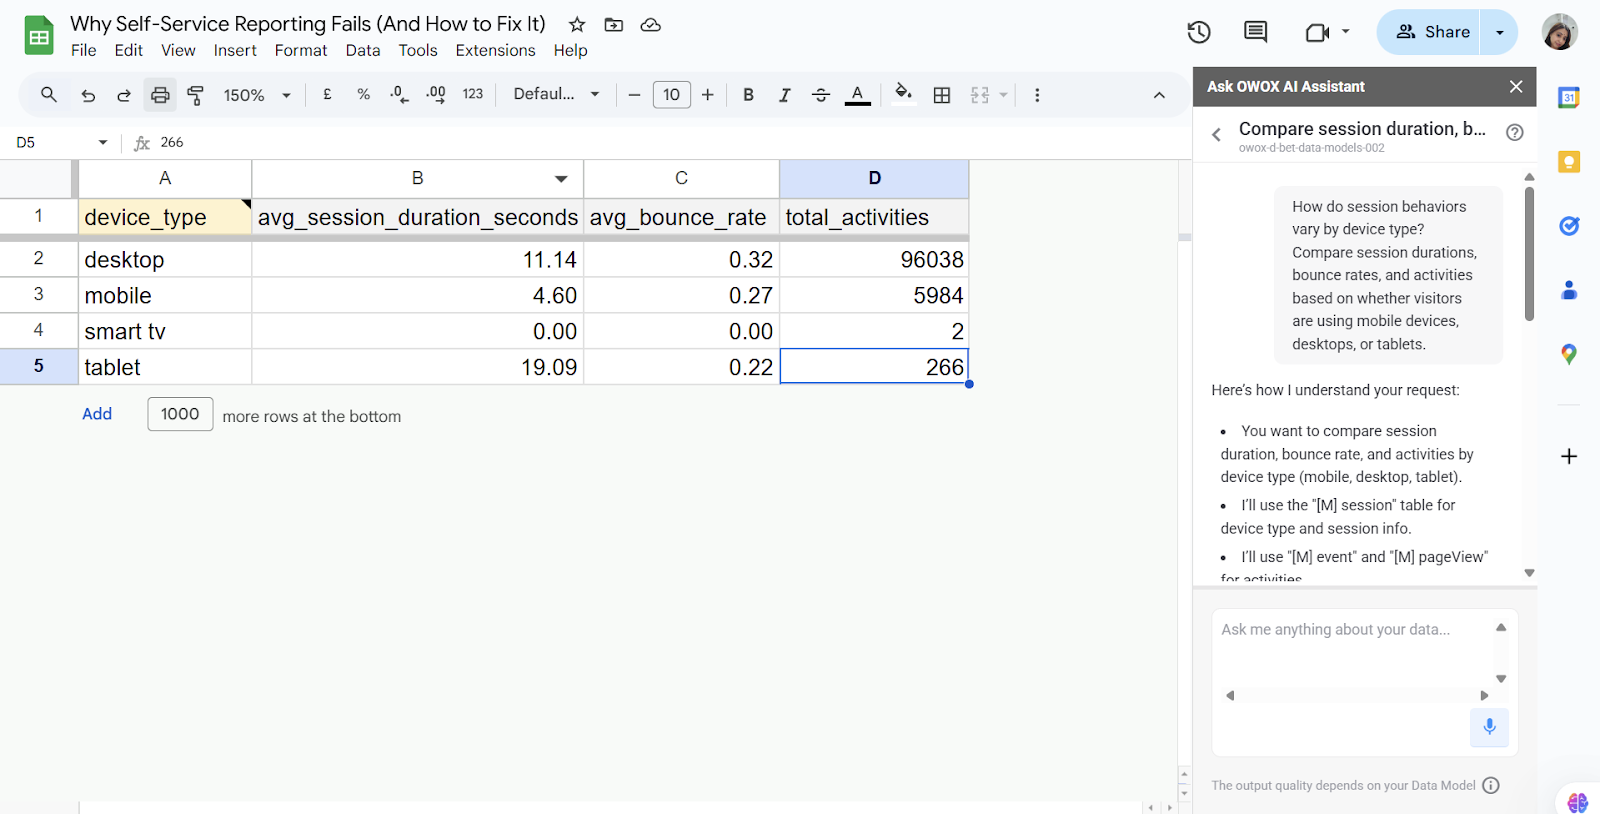
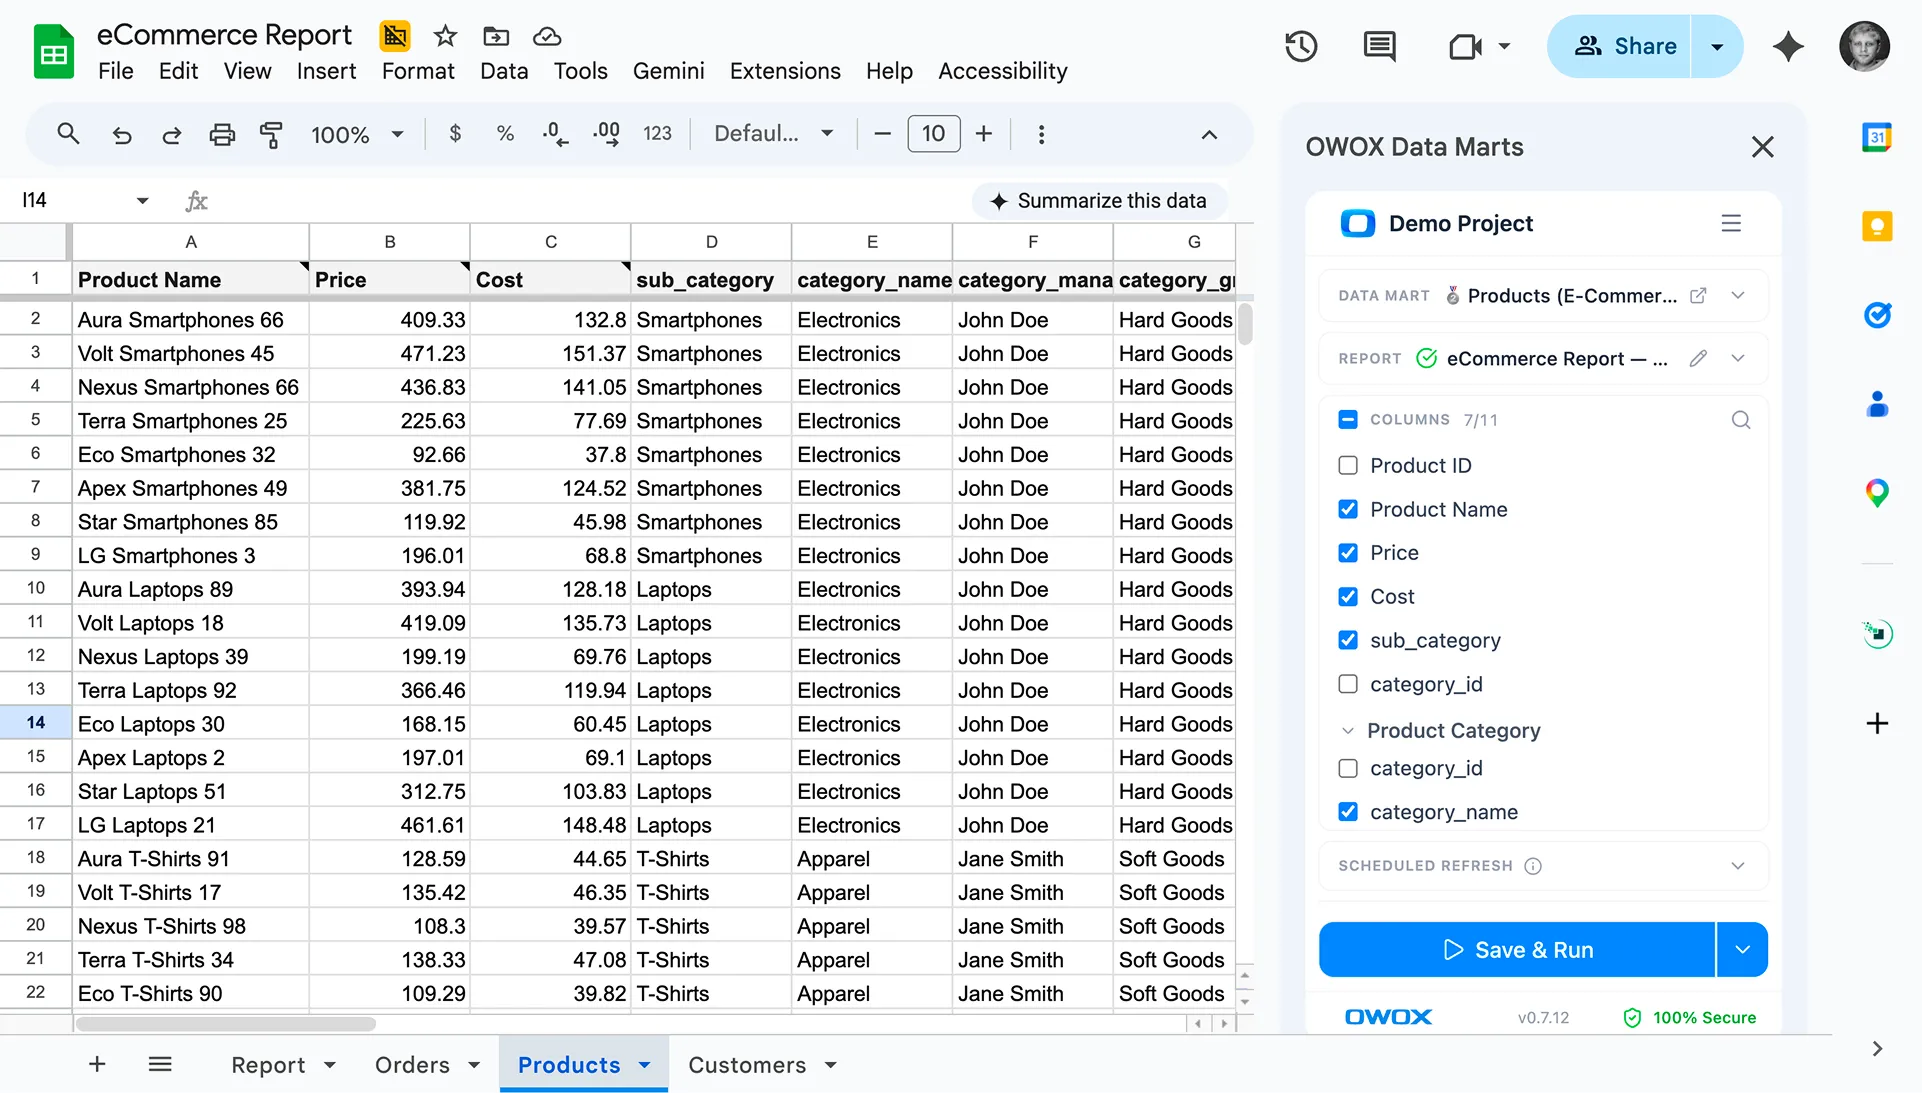
The OWOX Sheets Extension lets marketers browse the Data Mart library directly inside Google Sheets. They pick the mart they need, choose columns, apply filters, and refresh — without writing a single line of SQL.
When an analyst updates the mart logic, every connected Sheet refreshes automatically. Marketers always see current, governed numbers without filing another request.
Scheduled AI briefings — no hallucinations, no guesswork
For teams that want narrative summaries rather than raw data, OWOX AI Insights delivers scheduled briefings to Slack, Teams, or email. An analyst creates a Markdown template with placeholders; each placeholder is filled by deterministic, analyst-approved SQL. The AI writes the prose around the numbers.
Every figure in the briefing traces back to analyst-approved SQL — no AI hallucinations, no invented metrics. This is not "chat with your data." It's an auditable, scheduled briefing system where the analyst remains in control of every number.
No more guesswork or rework
With consistent logic behind every report, teams no longer need to second-guess numbers. There's no back-and-forth with analysts or rebuilding the same dashboard with new filters. Marketers gain confidence in the data, while analysts stop wasting time fixing metric confusion.
Real-world scenarios: before and after a governed data model
Below are common reporting challenges teams face without governed, centralized logic — and how those scenarios improve once OWOX Data Marts are in place.
Before – every campaign report is rebuilt manually
Analysts rebuild reports for every new campaign by duplicating queries and adjusting filters. It's a repetitive process that consumes time, introduces errors, and delays decisions.
As requests increase, workload grows, making it difficult to maintain quality and consistency. Teams spend more time fixing and formatting than analyzing, turning reporting into a bottleneck.
After – Sheets auto-update from governed Data Marts
With OWOX Data Marts, campaign reports pull from a predefined, centralized model that updates automatically in Google Sheets. Analysts no longer rebuild reports or rewrite SQL.

Marketers access up-to-date numbers on demand, saving hours of rework and back-and-forth. Analyst time shifts from firefighting to building scalable logic.
Before – conflicting definitions spark debates
Each team defines marketing metrics like "conversion," "lead," or "CPC" differently, resulting in mismatched reports and ongoing confusion. Weekly meetings turn into arguments over which number is correct.
This lack of alignment hinders decision-making, erodes trust in data, and forces analysts to spend hours resolving discrepancies rather than doing meaningful analysis.
After – metric definitions live in the Data Mart
With OWOX Data Marts, key metrics are defined once in the analyst's SQL and applied consistently across all tools and teams. Whether viewing a dashboard or a spreadsheet, everyone sees the same numbers and logic. This eliminates conflicting reports, streamlines communication, and lets marketers act with confidence.
Analysts stay in control while marketers gain autonomy
A strong self-service setup doesn't mean giving up control. With the right model in place, analysts define the logic and maintain data quality while marketers get the freedom to explore and act on trusted data.
No more "rogue" metrics in reports
Every report uses metrics defined in the Data Mart library, eliminating the risk of conflicting logic. Marketers no longer create custom formulas or misinterpret calculations. They draw from a single source of truth, ensuring all reports are consistent, comparable, and aligned across teams and tools.
Governed metrics only – if it's not defined, it's not used
In OWOX Data Marts, all metrics are predefined and governed through the Data Mart library. This prevents teams from creating unapproved versions of key metrics. With role-based governance, structured mart layers, and clear ownership, every report is based on approved definitions. If it's not in a mart, it's not available — ensuring alignment, accuracy, and full trust in the numbers.
Analysts shift from gatekeepers to enablers
With a governed data model, analysts stop spending time fixing broken reports and resolving metric debates. Instead, they focus on building scalable, reusable logic that the whole business can use.
This shift empowers marketers to explore and analyze data independently, while analysts maintain control over definitions — becoming enablers of trusted self-service rather than bottlenecks in the analytics process.
Self-service is a modeling problem, not a tool problem
Most teams assume that adding more tools will fix reporting issues. But the real problem isn't access or interfaces — it's the lack of structured, shared logic behind the data. Without modeling, self-service reporting can't succeed.
Most teams start at the interface instead of the logic
Teams often begin with visual tools like dashboards or Looker Studio, expecting instant insights. But without defining how data should be calculated, filtered, or joined, dashboards quickly become confusing. This approach skips the hard part: building shared logic that ensures consistent and meaningful reporting across tools and teams.
More dashboards won't fix metric confusion
Adding new dashboards only adds new versions of the same metrics. Without defined calculations and shared definitions, every team ends up with its own numbers. The confusion multiplies, and analysts continue to be pulled into resolving debates. Dashboards are only as useful as the logic that powers them underneath.
A Data Mart-first approach skips the six-month layer project
You don't need to build a brittle semantic layer to get consistent metrics. With OWOX Data Marts, analysts define business metrics and logic as SQL — once, centrally — and publish them as governed marts. Those definitions automatically flow to every connected Sheet, dashboard, or Slack briefing.
Marketers get reliable, consistent metrics without writing SQL. Analysts eliminate duplication and reduce the risk of conflicting calculations. And because every number traces back to analyst-approved SQL with a full audit trail, there are no AI hallucinations — not even one.
Build reliable self-service reporting with OWOX
OWOX makes self-service reporting truly reliable by letting analysts define clear logic, centralize metric definitions, and govern data structures — all through a Data Mart library that lives in your warehouse.
Marketers gain trusted access to accurate data through Google Sheets, Looker Studio, or scheduled AI briefings to Slack and email — eliminating the need to rebuild logic themselves. With OWOX, reports stay consistent, scalable, and aligned across the business.
Instead of adding more dashboards, you create a single governed model that powers every report with confidence and clarity.
Frequently asked questions




"AI by its nature will hallucinate. You need guardrails so you can trust your data."
"We had six or seven different channels and no single source of truth. It was almost impossible"
"We regained time. And time is the one resource that never comes back."