How to connect Google Ads to Databricks, step by step
To connect Google Ads to Databricks, create a connector Data Mart on a Databricks storage, enter the customer ID of the ad account, sign in with Google, choose a stats endpoint and fields, and name the catalog, schema and table. The connector creates the table in your workspace and refreshes it on a schedule. Cost arrives in micros and the date as text.
Google Ads reporting ends at the edge of Google Ads. Paid search next to paid social, cost next to orders from your own systems, keywords next to the margin of what they sold: those are joins, and in a lakehouse a join needs a table.
This guide puts Google Ads data into Databricks with the Google Ads connector in OWOX Data Marts. It follows the five setup screens, explains the manager-account rule that breaks most first runs, and ends with the table in Unity Catalog and the SQL to read it.
What you end up with
One Delta table per endpoint in your own Databricks workspace. For performance reporting that is a stats table such as google_ads_campaigns_stats: one row per campaign per day, with impressions, clicks, cost and conversions.
The connector calls the Google Ads API, writes the table and repeats on a schedule. It does not model the data. The logic on top, in SQL or a notebook, is yours.
Before you start
In Google Ads
The customer ID of the ad account you want data from. It is shown in the top right corner of the Google Ads interface when that account is open. If you reach the account through a manager account, you also need the manager account’s ID.
In Databricks
A storage of type Databricks connected to your OWOX Data Marts project. The storage guide asks for the workspace host, the HTTP path of a SQL warehouse and a personal access token. The token’s user needs permission to create schemas and tables in the catalog you choose, and to run queries on that warehouse.
The SQL warehouse behind the HTTP path does the work, so it sets the cost. Turn on auto stop and start small. Databricks pricing shows what a short daily job is billed for.
OWOX Data Marts
See your first report built in real time. 15 minutes.
- Connect your data warehouse
- Pick your metrics
- Get a live Google Sheets report
In the time it takes to write a ticket. Then imagine never writing that ticket again.
Book a DemoWe'll use your actual use case
Step 1: create the Data Mart and choose the connector
Step 1: create the Data Mart and choose the connector
Click New Data Mart, give it a title, pick the Databricks storage and click Create Data Mart. On the Data Setup tab, set Definition Type to Connector.
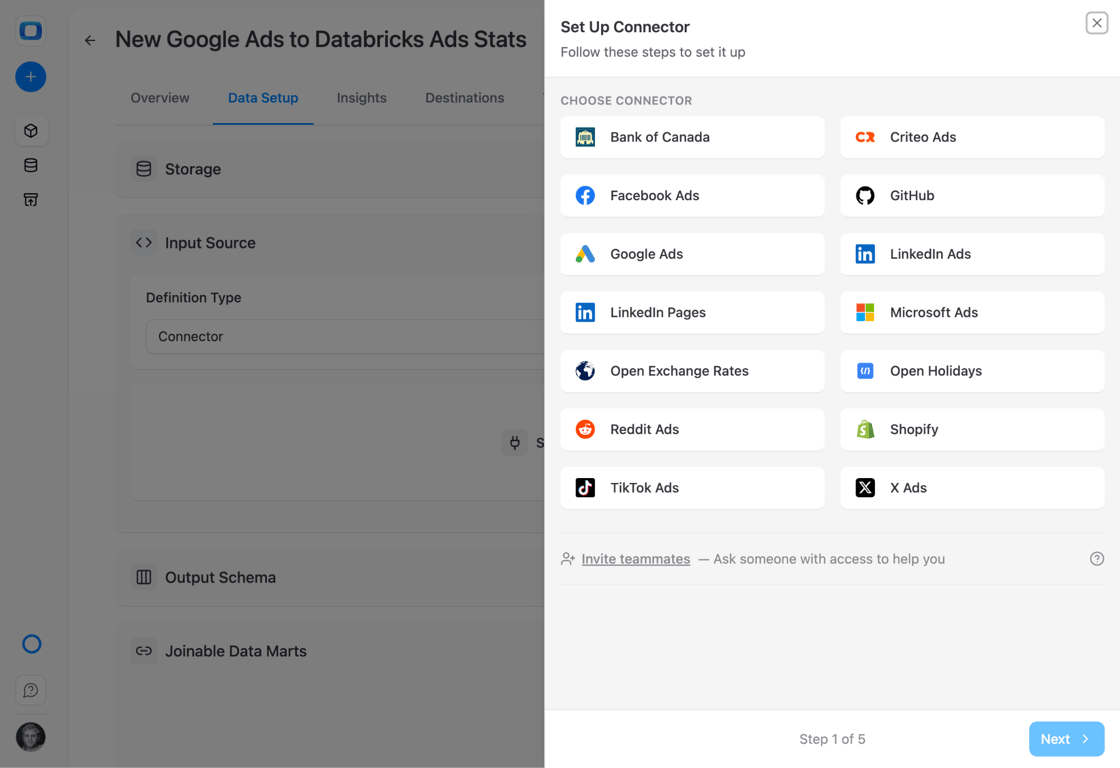
Choose Google Ads and click Next.
Step 2: enter the account and sign in
Step 2: enter the account and sign in
The form has two ID fields, and they are where most first runs go wrong.
- Customer ID is the account the data comes from. For any stats endpoint it must be an ad account, not a manager account. Performance data cannot be read from a manager account itself.
- Login Customer ID is the manager account you sign in through. Fill it in only if you access the ad account through a manager account, and leave it empty if you sign in directly. It must not be the same as the customer ID.
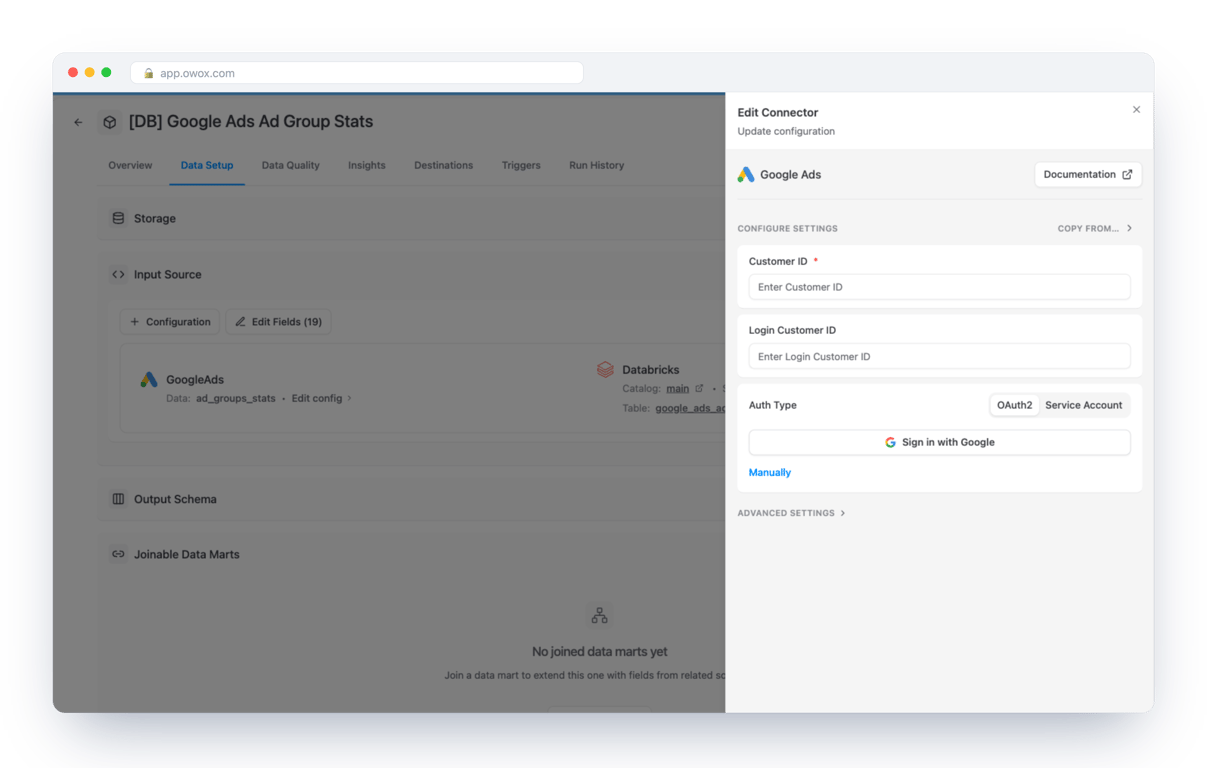
Then choose how to authenticate.
Sign in with Google is the short way. Pick the Google account that has access to the ad account and grant access. The form then shows which account is connected.
Manually is for your own credentials: a refresh token, a client ID and a client secret from a Google Cloud OAuth client, plus a developer token from the API Center of a manager account. Service Account takes a service account key and a developer token. A new developer token only works with test accounts until Google grants it Basic Access, which the credentials guide explains. With the sign-in button, none of that is needed.
Step 3: choose the endpoint
Each Data Mart loads one endpoint. A second endpoint is a second Data Mart and a second table.
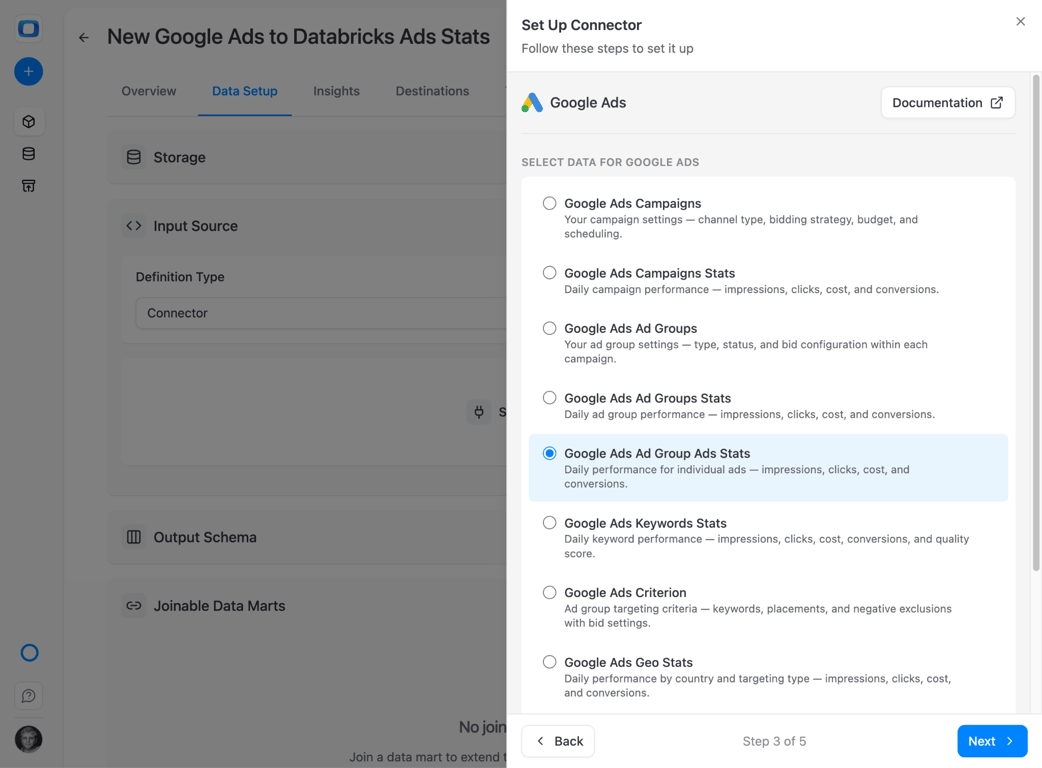
They come in two kinds.
Stats endpoints hold daily performance, one row per object per day:
- Campaigns Stats, keyed by campaign and date.
- Ad Groups Stats, keyed by ad group and date.
- Ad Group Ads Stats, keyed by ad and date.
- Keywords Stats, keyed by keyword and date, with quality score.
- Geo Stats, by campaign, country and date.
Settings endpoints hold the current state of objects, without dates:
- Campaigns and Ad Groups: names, statuses, channel type, bidding strategy, budget.
- Criterion: keywords, placements and negative exclusions with their bids.
- Geo Target Constants: the reference table that turns the country ID in Geo Stats into a name.
Start with Campaigns Stats. Add a second Data Mart for Campaigns when you want to report by channel type or bidding strategy, and join the two on campaign_id.
Step 4: choose the fields
The keys are always included. For the rest, take what you will report on.
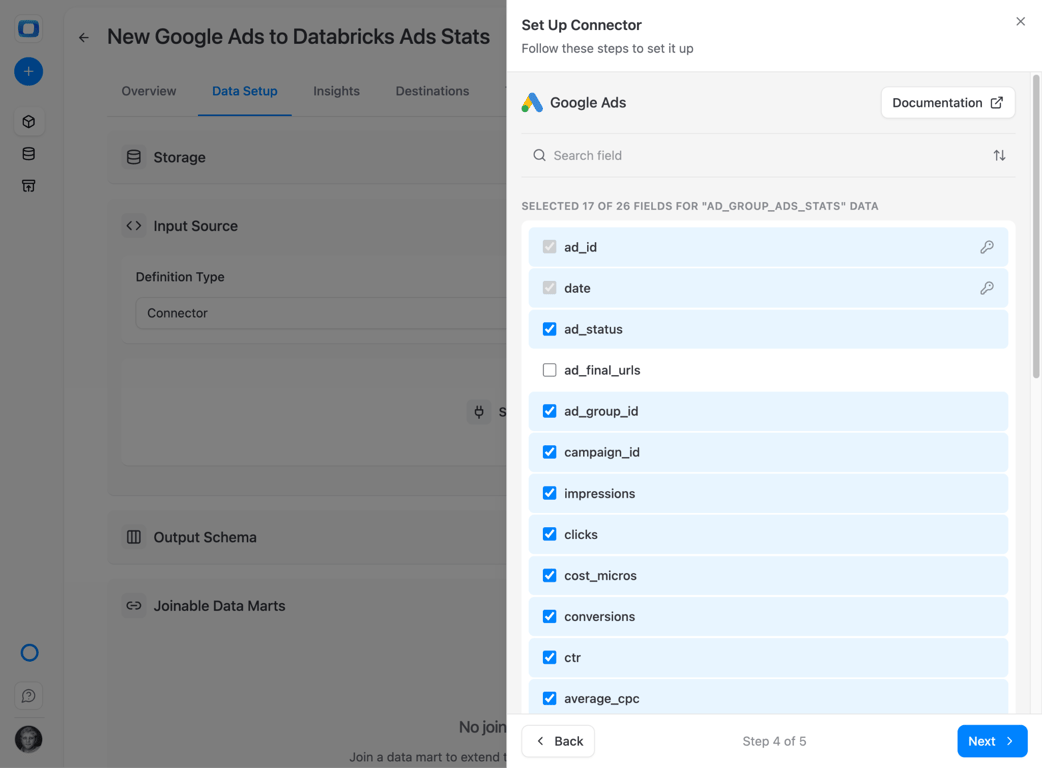
Fields can be added later, and the connector adds the columns to the table.
Step 5: name the catalog, schema and table
Step 5: name the catalog, schema and table
On Databricks the destination has three levels.
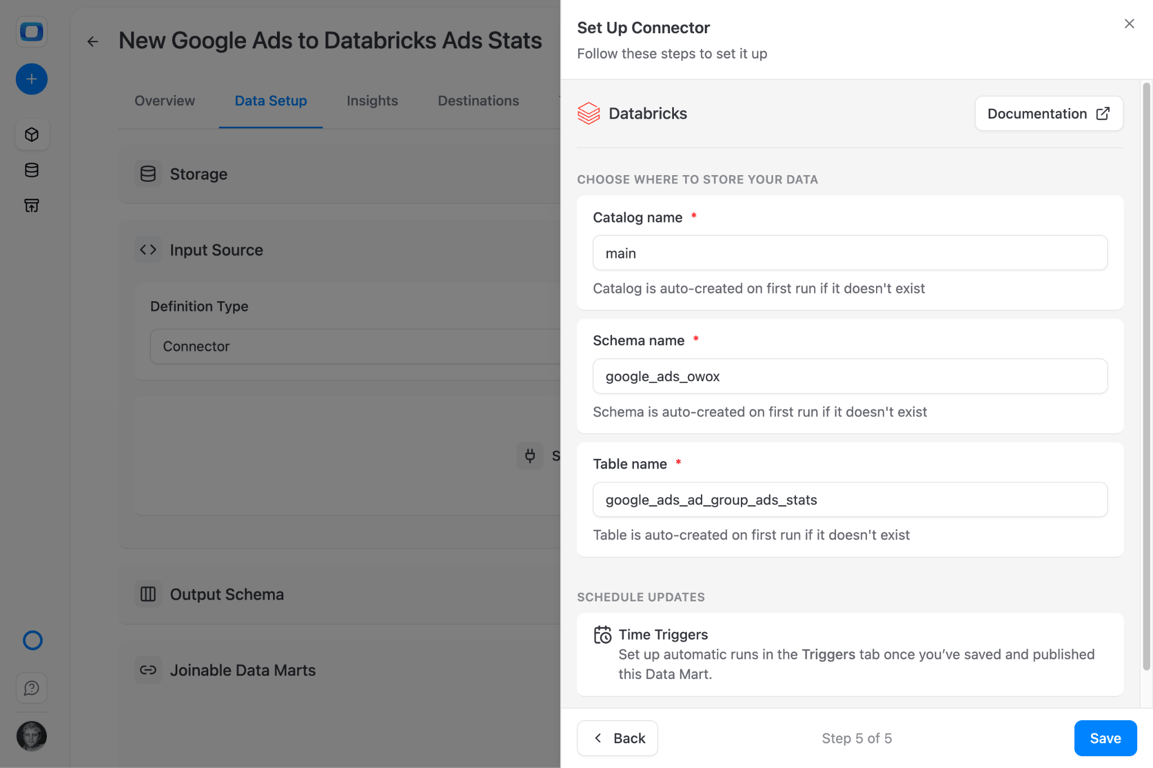
The setup proposes the catalog main, a schema named after the source and a table named after the endpoint. Each is created on the first run if it does not exist.
Click Save. The Data Mart is still a draft, with the source on the left and the Databricks destination on the right.
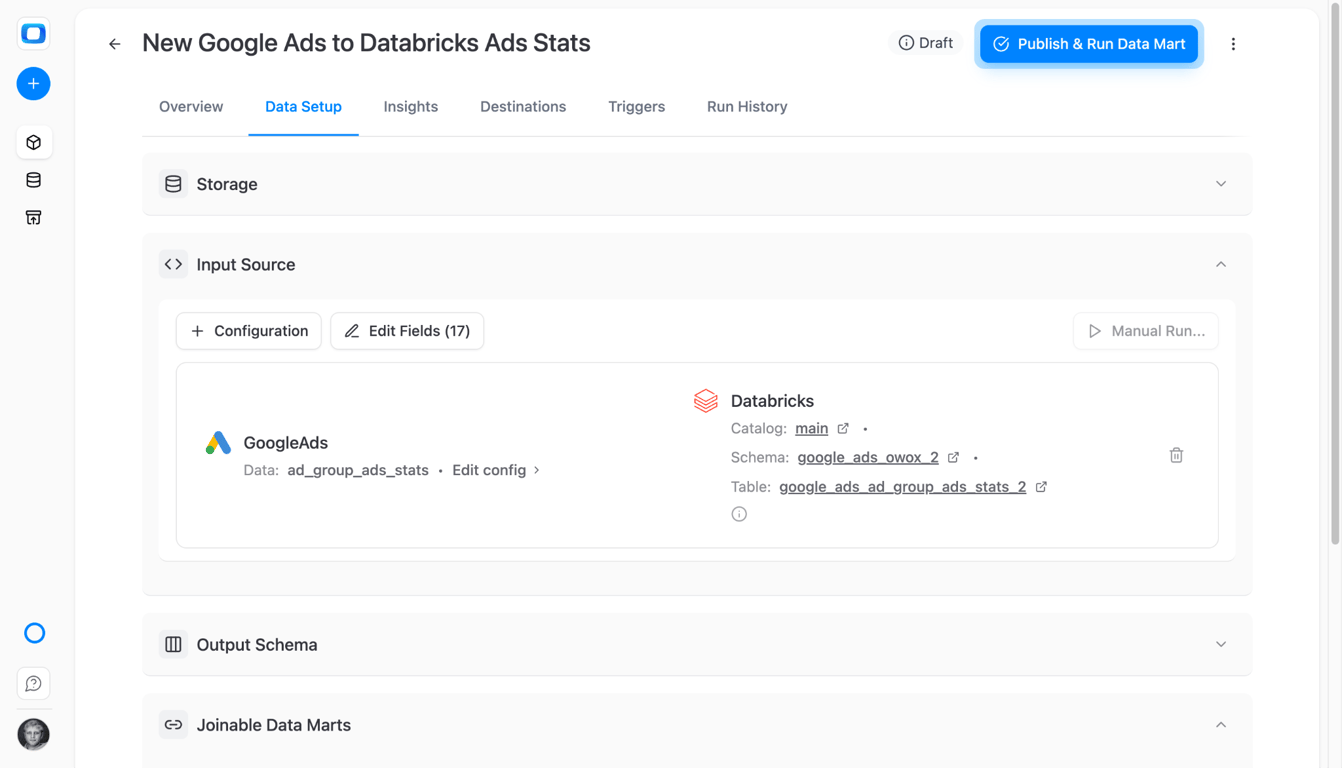
Click Publish & Run Data Mart. Publishing starts the first import.
Load history and set the schedule
Load history and set the schedule
Backfill
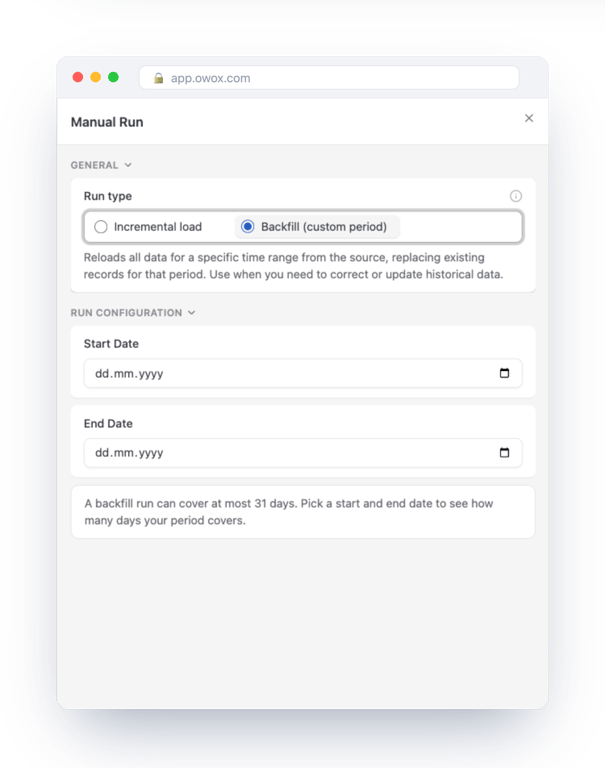
Click Manual Run and choose Backfill (custom period). One backfill run covers at most 31 days. For a longer history, run consecutive periods, each after the previous one has finished.
Schedule
A Data Mart without a trigger does not run again. On the Triggers tab, add a trigger of type Connector Run: daily, weekly, monthly or at an interval, in the time zone you choose.
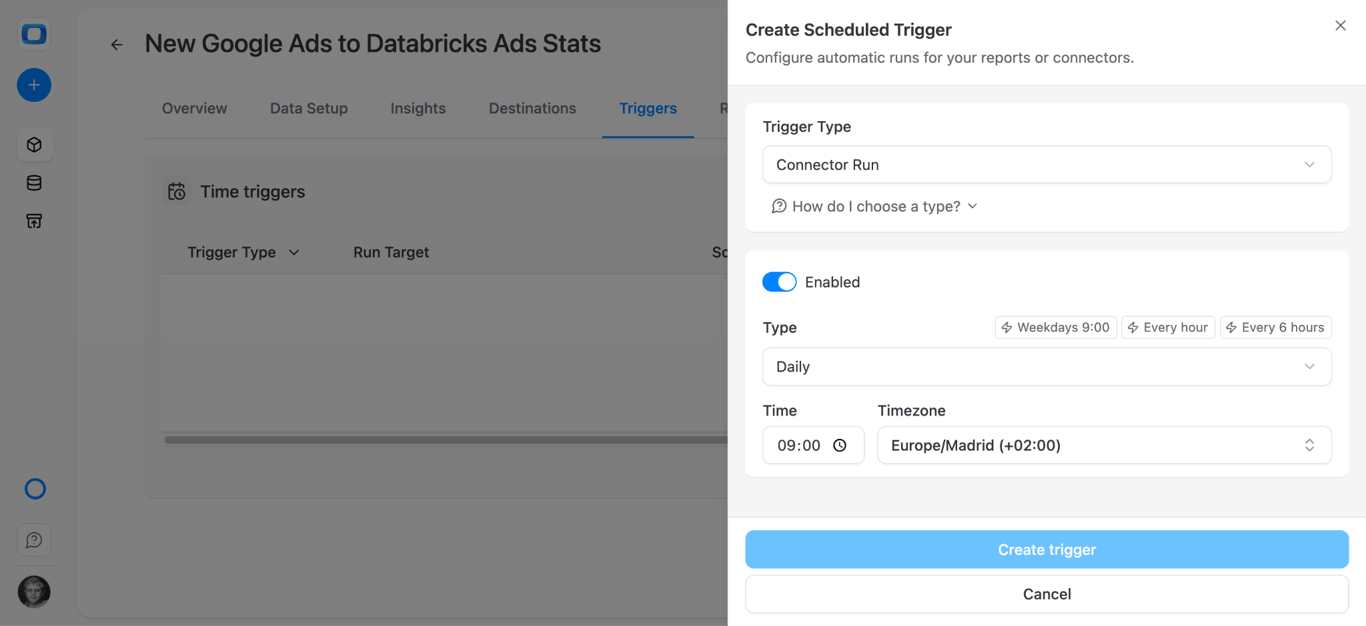
Scheduled runs are incremental. Each one starts from the last loaded date minus the Reimport Lookback Window, two days by default, and rewrites those days. Google Ads keeps adjusting recent conversions, so if your conversion window is long, raise the lookback in the advanced settings. Rows are merged on the keys, so a re-imported day replaces the earlier version.
What the tables look like in Databricks
What the tables look like in Databricks
A three-level name. With the proposed names, campaign statistics are in main.google_ads_owox.google_ads_campaigns_stats. No quoting is needed, and names are not case-sensitive.
Cost is in micros. cost_micros is the cost multiplied by one million, in the account’s currency. Divide by 1,000,000. The same applies to budget and bid fields ending in _micros.
The date is text. The date column holds the day as a string in YYYY-MM-DD form. Wrap it in to_date when you filter or group by it.
Keys and comments in the catalog. The connector declares the endpoint’s keys as the table’s primary key and writes each field’s description as a column comment, so the table documents itself in Catalog Explorer.
Query the data
Both queries use the column names and types the connector creates on Databricks, and were checked on a Databricks SQL warehouse.
Cost, clicks and conversions by campaign and day, for the last 30 days:
SELECT
  to_date(date) AS date,
  campaign_name AS campaign,
  SUM(impressions) AS impressions,
  SUM(clicks) AS clicks,
  SUM(cost_micros) / 1000000 AS cost,
  SUM(conversions) AS conversions
FROM main.google_ads_owox.google_ads_campaigns_stats
WHERE to_date(date) >= date_sub(current_date(), 30)
GROUP BY to_date(date), campaign_name
ORDER BY date, cost DESC;
The same numbers by channel type, joining the stats table to the campaign settings:
SELECT
  to_date(s.date) AS date,
  c.campaign_advertising_channel_type AS channel_type,
  SUM(s.clicks) AS clicks,
  SUM(s.cost_micros) / 1000000 AS cost,
  SUM(s.conversions) AS conversions,
  SUM(s.cost_micros) / 1000000
    / NULLIF(SUM(s.conversions), 0) AS cost_per_conversion
FROM main.google_ads_owox.google_ads_campaigns_stats s
LEFT JOIN main.google_ads_owox.google_ads_campaigns c
  ON s.campaign_id = c.campaign_id
GROUP BY
  to_date(s.date),
  c.campaign_advertising_channel_type
ORDER BY date, cost DESC;
Compute ratios from sums. Averaging the ctr or average_cpc column across rows gives a small campaign the same weight as a large one.
A view over these tables is the right place to do the division and the date conversion once, so nobody downstream meets micros.
From table to report
A connector Data Mart can be reported from as it is. On its Destinations tab you attach reports to Google Sheets, Data Studio, Slack or email, each with its own columns and schedule.
For a report with cost in currency and campaigns grouped your way, publish your own query as a SQL Data Mart and report from that one. Databricks to Google Sheets walks through the scheduled report and the self-service route for business users.
When the first run fails
Run History shows the error the API returned. With Google Ads it is nearly always one of these.
- A stats endpoint on a manager account. The customer ID is the manager account. Replace it with the ad account’s ID and put the manager ID in Login Customer ID.
- The same ID in both fields. Login Customer ID must differ from Customer ID. If you sign in directly to the ad account, leave it empty.
- No access. The Google account you signed in with cannot open that ad account.
- Developer token without Basic Access. Only with manual or service account credentials. The token works on test accounts until Google approves it.
Where to go next
The same five screens load the other sources into the same workspace: Facebook Ads, LinkedIn Ads and TikTok Ads.
On Snowflake the steps are the same and the naming rules differ: see Google Ads to Snowflake. For the platform itself, start with what Databricks is and how it works.
Turn your data into decisions.
Governed data marts give you the clean foundation ML needs to actually work.
- No AI hallucinations
- Analyst-governed definitions
- Every number traces to SQL
Frequently Asked Questions
Why is Google Ads cost so large in the Databricks table?
The cost_micros column holds cost multiplied by one million, in the account's currency, as the Google Ads API returns it. Divide it by 1,000,000 in your query. The date column is stored as text, so wrap it in to_date when filtering or grouping. A view or a SQL Data Mart over the table is a good place to do both once.
Is the OWOX Google Ads connector open source?
Yes. The connectors are part of the OWOX Data Marts repository on GitHub, and the connectors package is published under the MIT licence. You can read which Google Ads fields each endpoint requests and how rows are written to Databricks.
Can I use a Google Ads manager account (MCC) with Databricks?
Yes, as the account you sign in through. Put the manager account's ID in Login Customer ID and the ad account's ID in Customer ID. For any stats endpoint the Customer ID must be an ad account, because performance data cannot be read from a manager account itself. The two IDs must be different.
How often does Google Ads data refresh in Databricks?
As often as the Connector Run trigger you set: daily, weekly, monthly or at an interval. Each scheduled run is incremental and re-imports the days set by the Reimport Lookback Window, two by default, so conversions that Google Ads adjusts afterwards are updated. Daily is enough for most reporting.
What Google Ads data can I import into Databricks?
Daily statistics for campaigns, ad groups, ads and keywords, and geo statistics by country. Settings endpoints cover campaigns, ad groups and targeting criteria such as keywords, placements and negative exclusions, and a reference table resolves country IDs to names. Each endpoint is loaded by its own Data Mart into its own table.
Do I need API credentials to connect Google Ads to Databricks?
Not with the Sign in with Google button: you choose the Google account that has access to the ad account and grant access. Your own credentials are needed only for the manual method, which takes a refresh token, client ID, client secret and developer token, or for a service account key with a developer token.
How do I connect Google Ads to Databricks?
Connect Databricks as a storage in OWOX Data Marts, create a Data Mart on it, set its definition type to Connector and choose Google Ads. Enter the customer ID of the ad account, sign in with Google, pick a stats endpoint and the fields you need, name the catalog, schema and table, then publish. A Connector Run trigger repeats the load on a schedule.