Customer lifetime value: formula, calculation and analysis
Customer lifetime value (CLV, also CLTV or LTV) is the total gross margin a customer brings your business over the whole relationship. The simplest formula is average order value × purchases per period × gross margin × number of periods a customer stays. For a store with a $600 average order, 0.4 orders per customer a month, a 27% margin and customers who stay four months, CLV is about $259.
That number is only useful next to two others: what it cost to acquire the customer, and how CLV differs between the customers you acquired in different ways. This guide covers the four common ways to calculate CLV, with worked numbers, then how to analyse it by channel and cohort, with a query you can run.
Originally published in January 2021. Fully updated in October 2026: corrected worked examples, a section on CLV analysis by channel and cohort, and a runnable SQL example.
What customer lifetime value tells you
What customer lifetime value tells you
CLV answers a budgeting question: how much can you afford to spend to win and keep a customer? A business whose customers are worth $250 in margin can pay $80 to acquire one. A business whose customers are worth $40 cannot.
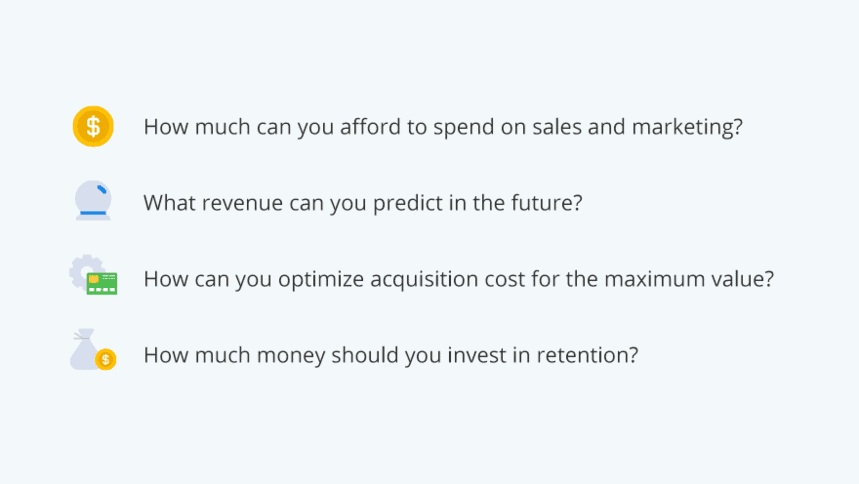
It also points at where value comes from. Two customers who spend the same on a first order can be worth very different amounts a year later: one buys again every month, the other never returns. CLV is where that difference shows up, which is why it is the metric to read before you cut a channel that looks expensive on first-order revenue.
Two definitions get mixed up, and the mix-up changes the number by a factor of three or four:
- Revenue CLV sums what a customer paid you.
- Margin CLV sums what is left after the cost of the goods, and usually after refunds.
Use margin CLV whenever you compare it with acquisition cost. A revenue CLV next to a cost makes every channel look profitable.
How to calculate customer lifetime value
How to calculate customer lifetime value
There are four common methods. They differ in how much history you need and whether they predict or only describe.
| Method | Needs | Answers |
|---|---|---|
| Historical (ARPU) | revenue and customer counts for one period | what an average customer was worth |
| Cohort | orders tagged with each customer’s first-order month | how value builds over time, per group |
| Predictive (formula) | order value, frequency, margin, churn | what a customer is likely to be worth |
| Traditional (with retention and discount rate) | margin per period, retention, a discount rate | today’s value of future margin |
Method 1: historical CLV from ARPU
Average revenue per user (ARPU) for a period, projected over a year.
Example. 20 customers brought $1,240 of gross margin over three months.
- ARPU for three months: $1,240 / 20 = $62
- Annualised: $62 × 4 = $248 per customer per year
It is quick and needs only two numbers. It assumes every customer behaves like the average one and that the next three quarters look like the last, so treat it as a description, not a forecast.
Method 2: cohort CLV
A cohort is a group of customers who made their first purchase in the same period. Instead of one average, you track how much margin each cohort has produced by month 1, month 2, month 3 and so on, and read CLV off the curve.
Example. Customers acquired in January produced $62 of margin each by the end of month 3 and $97 by month 6. Customers acquired in March produced $54 by month 3. If the March cohort follows January’s shape, it will be worth about $85 by month 6. If it does not, something about March’s customers, or the way they were acquired, is different.
How you define the cohort changes the curve: by first order or by sign-up, calendar months or rolling 30 days, gross or net of refunds. Cohort retention analysis in SQL runs four such definitions on the same orders, and the concept itself is explained in cohort analysis.
Method 3: predictive CLV
The formula from the top of this page, built from four averages.
CLV = AOV × F × GM × L
| Input | Meaning | Example |
|---|---|---|
| AOV | average order value | $36,000 revenue / 60 orders = $600 |
| F | orders per customer per month | 60 orders / 150 customers = 0.4 |
| GM | gross margin, as a share of revenue | ($36,000 − $26,280) / $36,000 = 27% |
| L | average lifespan in months, 1 / monthly churn | 200 customers at the start, 150 at the end: churn 25%, L = 1 / 0.25 = 4 |
CLV = $600 × 0.4 × 0.27 × 4 = $259.20
Keep every input per customer and in the same period. The most common error in published examples is multiplying total transactions for the whole business by per-customer values and then dividing by the customer count at the end, which double counts.
The weakness is L. One month’s churn is a noisy estimate of how long customers stay, and a churn rate that moves from 25% to 20% moves CLV by a quarter. Average churn over several months before you use it.
Method 4: traditional CLV with retention and discount rate
When margin per period is steady but customers drop off, discount the future margin to today’s money:
CLV = M × r / (1 + d − r)
- M: gross margin per customer per period
- r: retention rate, the share of customers who buy again next period
- d: discount rate per period, your cost of capital. A 10% annual rate is about 0.8% a month.
Retention rate example. 220 customers at the start of November, 50 new customers during the month, 250 at the end: r = (250 − 50) / 220 = 91%.
CLV example. M = $20 a month, r = 0.91, d = 0.008:
CLV = $20 × 0.91 / (1 + 0.008 − 0.91) = $18.20 / 0.098 = $185.71
This counts margin from the next period on. Add the first period’s margin if you want the whole relationship.
OWOX Data Marts
See your first report built in real time. 15 minutes.
- Connect your data warehouse
- Pick your metrics
- Get a live Google Sheets report
In the time it takes to write a ticket. Then imagine never writing that ticket again.
Book a DemoWe'll use your actual use case
Customer lifetime analysis: where the value comes from
Customer lifetime analysis: where the value comes from
A single CLV for the whole business answers the budgeting question. Analysing it answers the one that follows: which customers are worth more, and why? Split CLV by what you can act on:
- Acquisition channel. Customers from paid social may buy once; customers from search or email may come back. This is the split that changes budgets.
- First-order cohort. Shows whether customers you acquire now are worth more or less than last year’s.
- First product or category. Some entry products lead to repeat purchases, others do not.
- Customer segment. For example by RFM score, which ranks customers on recency, frequency and monetary value.
The split by channel needs three tables joined correctly: customers with the channel that acquired them, their orders, and acquisition spend per channel. The query below computes 12-month margin CLV and the ratio to acquisition cost per channel. It runs as written in Google BigQuery; the CTEs stand in for your own tables.
WITH customers AS (
  SELECT 'c1' AS customer_id,
         DATE '2025-01-12' AS first_order,
         'google / cpc' AS channel
  UNION ALL SELECT 'c2', '2025-01-20', 'google / cpc'
  UNION ALL SELECT 'c3', '2025-02-03', 'facebook / paid'
  UNION ALL SELECT 'c4', '2025-02-15', 'facebook / paid'
  UNION ALL SELECT 'c5', '2025-03-01', 'email'
),
orders AS (
  SELECT 'c1' AS customer_id,
         DATE '2025-01-12' AS order_date,
         120.0 AS revenue,
         70.0 AS cost_of_goods,
         FALSE AS refunded
  UNION ALL SELECT 'c1', '2025-05-02', 90.0, 50.0, FALSE
  UNION ALL SELECT 'c1', '2025-11-20', 150.0, 85.0, FALSE
  UNION ALL SELECT 'c2', '2025-01-20', 80.0, 45.0, FALSE
  UNION ALL SELECT 'c3', '2025-02-03', 200.0, 120.0, FALSE
  UNION ALL SELECT 'c3', '2025-02-10', 60.0, 35.0, TRUE
  UNION ALL SELECT 'c4', '2025-02-15', 70.0, 40.0, FALSE
  UNION ALL SELECT 'c4', '2026-03-01', 95.0, 55.0, FALSE
  UNION ALL SELECT 'c5', '2025-03-01', 110.0, 60.0, FALSE
  UNION ALL SELECT 'c5', '2025-08-14', 130.0, 70.0, FALSE
),
spend AS (
  SELECT 'google / cpc' AS channel,
         60.0 AS acquisition_spend
  UNION ALL SELECT 'facebook / paid', 90.0
  UNION ALL SELECT 'email', 5.0
),
margin_12m AS (
  -- gross margin in the first 12 months,
  -- refunds excluded
  SELECT c.channel,
         c.customer_id,
         SUM(IF(o.refunded, 0,
                o.revenue - o.cost_of_goods))
           AS margin
  FROM customers AS c
  JOIN orders AS o
    ON o.customer_id = c.customer_id
   AND o.order_date < DATE_ADD(
         c.first_order, INTERVAL 12 MONTH)
  GROUP BY c.channel, c.customer_id
)
SELECT m.channel,
       COUNT(*) AS customers,
       ROUND(AVG(m.margin), 2) AS ltv_12m,
       ROUND(ANY_VALUE(s.acquisition_spend)
             / COUNT(*), 2) AS cac,
       ROUND(AVG(m.margin)
             / (ANY_VALUE(s.acquisition_spend)
                / COUNT(*)), 1) AS ltv_to_cac
FROM margin_12m AS m
JOIN spend AS s USING (channel)
GROUP BY m.channel
ORDER BY ltv_to_cac DESC| channel | customers | ltv_12m | cac | ltv_to_cac |
|---|---|---|---|---|
| 1 | 110.00 | 5.00 | 22.0 | |
| google / cpc | 2 | 95.00 | 30.00 | 3.2 |
| facebook / paid | 2 | 55.00 | 45.00 | 1.2 |
Three decisions are written into that query, and each one moves the result: the 12-month window (c4’s second order, 13 months later, does not count), refunds excluded (c3’s refunded order adds nothing), and margin, not revenue.
How far they move it is easiest to see on more than five customers. We ran the same logic on the demo shop behind the public [Demo] E-commerce project (synthetic data): customers whose first completed order came in January–June 2025, credited to the source of that order’s session, with acquisition cost as that channel’s ad spend over the same six months divided by those customers.
| Channel | Customers | CAC | 12-month margin ÷ CAC | 6-month margin ÷ CAC | 12-month revenue ÷ CAC |
|---|---|---|---|---|---|
| facebook / cpc | 86 | $292.68 | 2.16 | 1.35 | 3.43 |
| tiktok / cpc | 51 | $288.06 | 2.50 | 1.81 | 3.95 |
| bing / cpc | 46 | $301.16 | 1.76 | 1.11 | 2.78 |
| google / cpc | 29 | $545.87 | 1.48 | 0.99 | 2.35 |
The table shows the four paid channels with more than 20 new customers in the period; Reddit, X and LinkedIn Ads brought 15, 4 and 3, too few to read.
Read the Google Ads row three ways. On 12-month margin it pays back one and a half times. On six months it does not pay back at all. On revenue it clears the 2:1 bar comfortably. Same customers, same spend: whether the channel looks like one to cut or one to grow depends on a definition someone chose, usually without writing it down. Two caveats on the method, both deliberate: crediting customers to their first order’s source ignores the touches before it, and ad spend also buys repeat orders, so CAC here is an upper bound.
CLV and customer acquisition cost
CLV and customer acquisition cost
Customer acquisition cost (CAC) is your sales and marketing spend for a period divided by the new customers it produced. The ratio of the two is the usual test of whether growth pays:
- Below 1: each customer costs more to win than they return.
- Around 3: the common rule of thumb for a healthy business.
- Well above 3: you may be under-investing in acquisition.
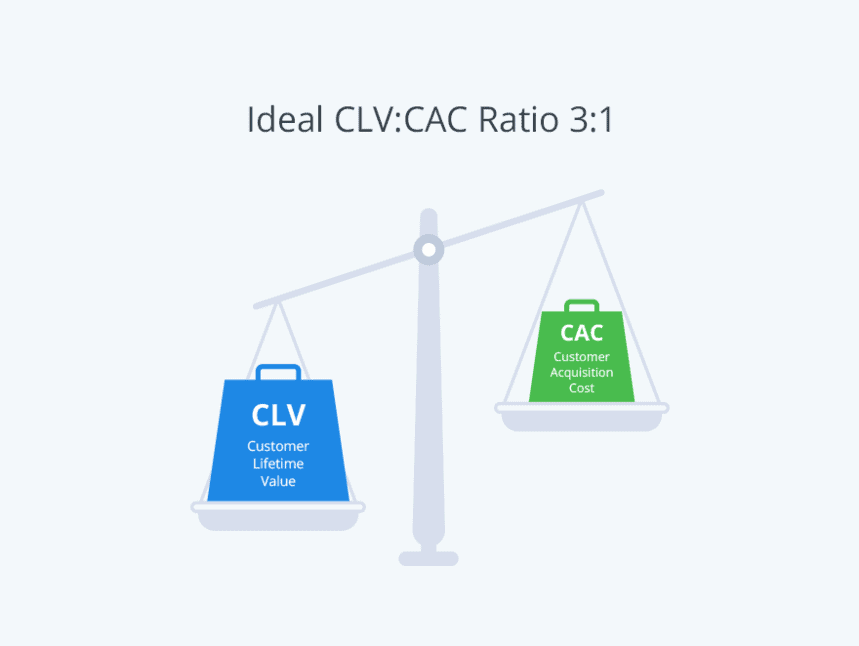
The ratio is only as good as its two halves. CLV from margin and CAC from all acquisition costs, over matched periods, gives a ratio you can compare between channels; anything else gives a ratio you can argue about. The benchmarks and how to read them are in LTV:CAC ratio, and the spend side of the join in unifying ad spend and CRM data for CAC.
Make the number one you can defend
Make the number one you can defend
CLV is the metric most likely to differ between teams. Finance calculates it net of VAT and refunds from the ERP. Marketing calculates it from the CRM or the store, often gross. A board deck can end up with two CLVs, both “correct”, a factor of two apart. Calculating LTV with CRM and ERP data walks through where those differences come from: refunds, VAT, churn definitions and lifespan assumptions that each team sets on its own.
The fix is not a better formula. It is deciding the assumptions once (window, margin, refunds, what counts as churn) and writing them into one query that everyone reads from. That is what a Data Mart is: an analyst’s SQL, published with a description and an owner, which reports and AI questions then use instead of recalculating.
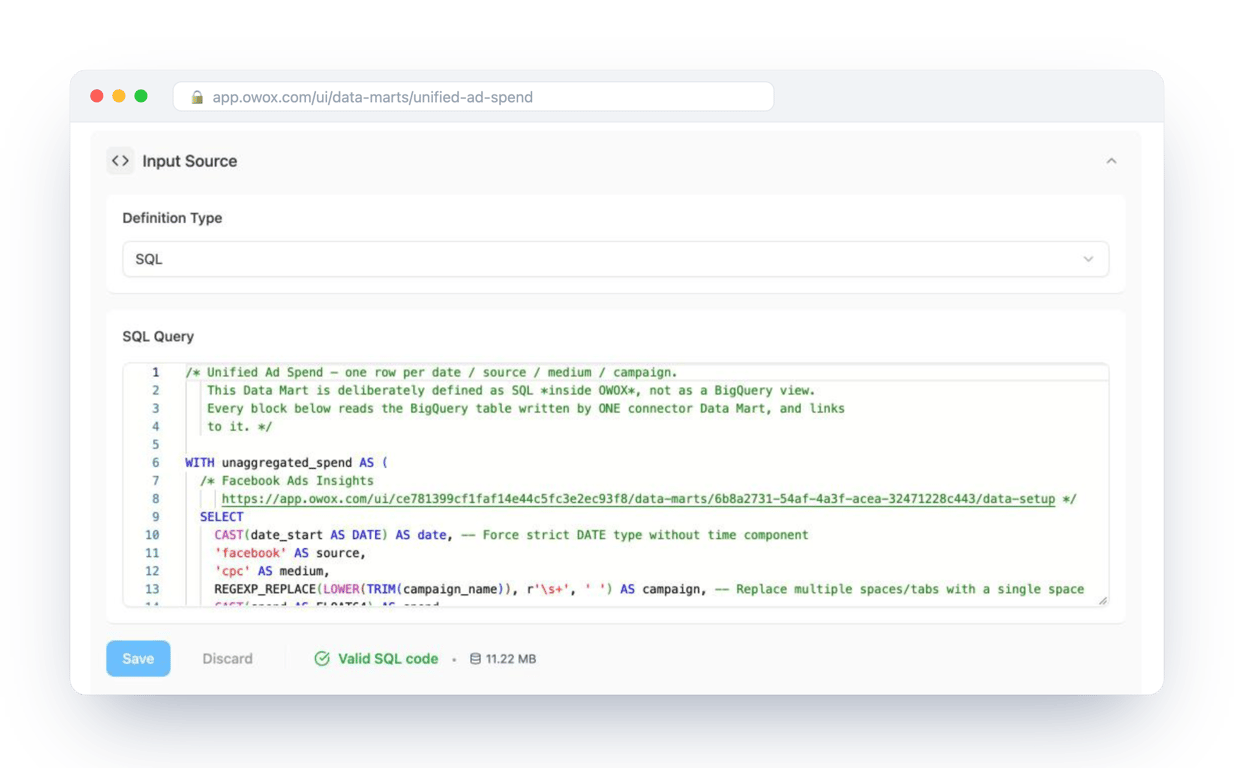
Once ad spend and store orders are published as Data Marts in a model, such as the E-commerce model with its Ad Spend vs Store Orders Data Mart, the CAC half of the ratio becomes a question anyone can ask:
“What did each paid source cost per completed store order in Q1 2026? Show only the source and the cost per order, as whole dollars, highest first.”
| Asked of raw tables | Asked of the Data Model | |
|---|---|---|
| What the assistant sees | every table in the warehouse | the published Data Marts |
| Which orders count | whatever it assumes | completed store orders, as the analyst wrote in the SQL |
| What you get | a plausible CAC | the CAC, and the query behind it |
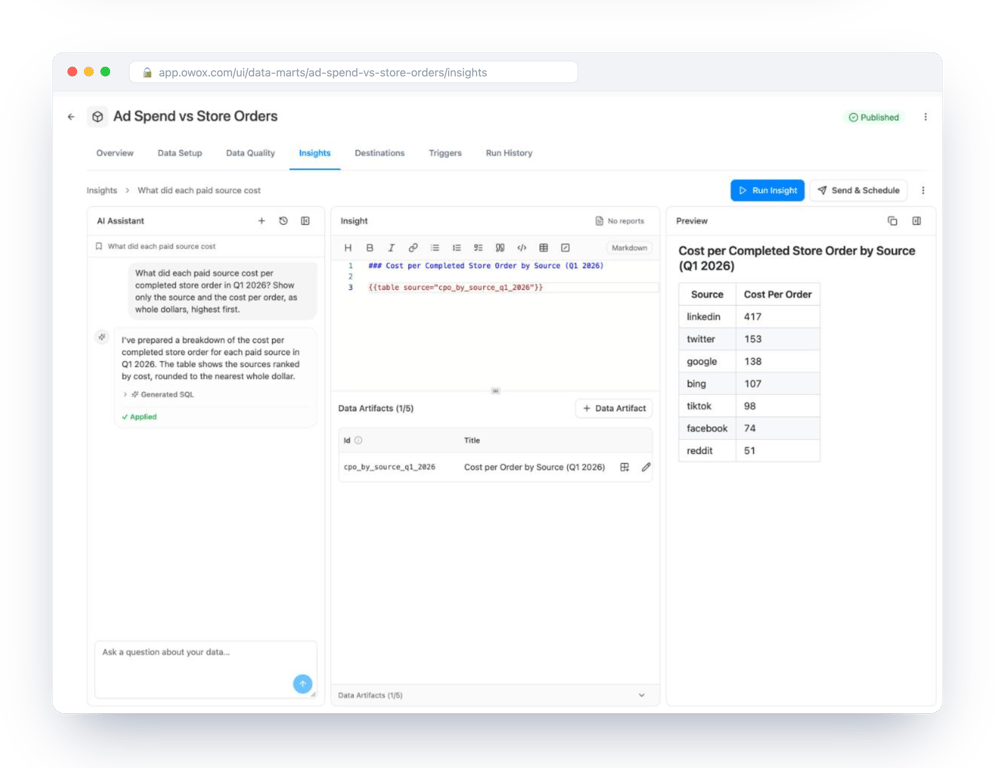
Divide each channel’s margin CLV from the query above by its figure here, and the channel split of the ratio is done.
It narrows the room for a wrong figure rather than closing it: the answer is as right as the Data Marts behind it. But it is one number, with its assumptions on view, instead of two.
How to increase customer lifetime value
How to increase customer lifetime value
Once you know which customers are worth more, the levers are the four inputs of the formula:
- Order value: bundles, thresholds for free delivery, relevant recommendations at checkout.
- Frequency: replenishment reminders, a loyalty programme that rewards the second and third purchase, not only the tenth.
- Margin: fewer discounts to customers who would have bought anyway. RFM segments show who they are.
- Lifespan: onboarding for subscription and software products, and support that resolves problems on the first contact.
And one lever outside the formula: acquire more of the customers who are worth more. The channel split above is where that starts. For more tactics, see eight strategies to increase customer lifetime value.
Turn your data into decisions.
Governed data marts give you the clean foundation ML needs to actually work.
- No AI hallucinations
- Analyst-governed definitions
- Every number traces to SQL
Frequently Asked Questions
What is the formula for customer lifetime value?
A common formula is average order value × purchases per customer per period × gross margin × average customer lifespan in periods. For example, $600 × 0.4 orders a month × 27% × 4 months gives a CLV of about $259.
Should CLV be calculated on revenue or on margin?
Use gross margin, net of refunds, whenever you compare CLV with acquisition cost. Revenue CLV is several times higher and makes almost every channel look profitable against its cost.
What is a good CLV to CAC ratio?
A ratio around 3:1 is the common rule of thumb for a healthy business. Below 1 a customer costs more to win than they return; well above 3 can mean you are under-investing in acquisition. The ratio is only comparable between channels if both sides use the same definitions and period.
Why does CLV differ between teams?
Teams often calculate it with different assumptions: revenue or margin, with or without VAT and refunds, over 6, 12 or 24 months. Each choice can move the number enough to change a budget decision, so the assumptions should be decided once and written into one query everyone uses.