
How to Build a CAC Report: Unify Ad Spend and CRM Data
Connect marketing spend and CRM performance to measure customer acquisition cost. Ensure reliable reporting and smarter budget allocation.

What if every client dashboard in your agency showed a different CAC number? It’s a common problem, ad costs live in one tool, CRM deals in another, and every analyst joins them differently. Before long, reporting turns into a guessing game instead of a decision tool.
This article shows how to build a unified CAC report by connecting ad spend from all platforms with CRM deal data inside a governed data mart.
.png)
This article shows how to fix that by unifying ad spend and CRM data into a governed CAC Data Mart. You’ll see how analysts can define CAC logic once, refresh it automatically, and deliver trusted, consistent numbers across every account and dashboard.
Why Reliable CAC Reporting Is So Difficult
Reliable CAC reporting often breaks down because data lives in silos, timestamps don’t align, and definitions differ across teams. These gaps create inconsistent numbers and endless confusion between dashboards.
Conflicting CAC Numbers Across Dashboards
Ad platforms record conversions when clicks occur, while CRMs register them when deals close. These mismatched timestamps distort CAC attribution. These small differences lead to large reporting gaps. Without a governed layer that standardizes filters, timeframes, and cost definitions, each dashboard ends up showing its own version of “truth,” which can confuse decisions and accountability.
GA4 Conversion Events vs. CRM Timestamps
GA4 captures conversions instantly when events trigger in the browser, whereas CRMs only record them once deals close. This timing difference creates inconsistent attribution windows, making conversions appear earlier in GA4 than in CRM data. Without aligning event timestamps, your CAC report may double-count or miss conversions, leading to inaccurate performance and budget insights.
Ad Platform Costs in Different Currencies
Ad platforms often report spend in local currencies. When this data is merged without conversion, totals become misleading. To keep CAC consistent, convert all spends to one base currency using daily exchange rates before combining with CRM data. A campaign performing well in one region may appear over- or under-budget elsewhere. Normalizing all ad costs to a single base currency at consistent exchange rates ensures CAC comparisons remain accurate and fair.
Lack of Governance Across CAC Logic
Without a shared, governed CAC definition, each team calculates it differently; one includes retargeting costs, another doesn’t; one uses deal creation date, another uses close date. These small inconsistencies multiply across reports, creating numbers that appear similar but don’t match. A centralized, governed layer is the only way to maintain clarity, consistency, and trust in CAC reporting.
Common Obstacles When Combining Ad Spend and CRM Data
When analysts try to merge ad spend with CRM data, they face recurring technical and structural challenges. Below are the most common obstacles that disrupt accurate joins and consistent CAC calculations.
Broken Joins from Non-Matching IDs
When campaign or lead IDs don’t match between ad platforms and CRM tables, joins fail or return NULL values. This breaks data relationships and causes missing or duplicated records in reports. Even a small mismatch in naming or formatting can distort CAC calculations, making accurate tracking across spend and revenue sources nearly impossible without standardized IDs.
Misaligned Time Windows Across Platforms
Ad platforms record clicks and conversions instantly, while CRMs log leads or deals hours or days later. These timing differences cause spend and revenue data to fall out of sync. Without aligning time windows across sources, you risk attributing costs to the wrong conversions, leading to inconsistent CAC values and unreliable performance reporting across campaigns.
Repeated SQL Joins in Scripts and Notebooks
Analysts often recreate the same ad spend and CRM joins for every CAC request, using separate scripts or notebooks each time. This repetitive work slows down analysis and introduces small variations in logic. Over time, these inconsistencies compound, leading to mismatched reports, wasted effort, and a lack of a single, reusable source of truth for CAC.
Why a Governed CAC Data Mart Solves These Problems
A governed CAC Data Mart addresses the fragmentation analysts encounter when integrating ad and CRM data. Below are the key ways it creates consistency, transparency, and trust in CAC reporting.
One Consistent Layer for CAC/LTV Metrics
A governed Data Mart stores your CAC and LTV logic in one central place. Every dashboard, report, or export pulls from the same definitions, removing confusion caused by different versions. This shared layer ensures all teams work with consistent numbers, reducing errors and debates over which metric is correct. It becomes the single source of truth for performance reporting.
Modeled Once, Reused Everywhere
With a governed Data Mart, you define your CAC logic once using SQL or a modeling layer, and reuse it everywhere, dashboards, spreadsheets, and exports. There’s no need to rebuild joins or rewrite formulas for each report. This approach saves time, prevents errors, and ensures that every team sees consistent, up-to-date numbers across all tools.
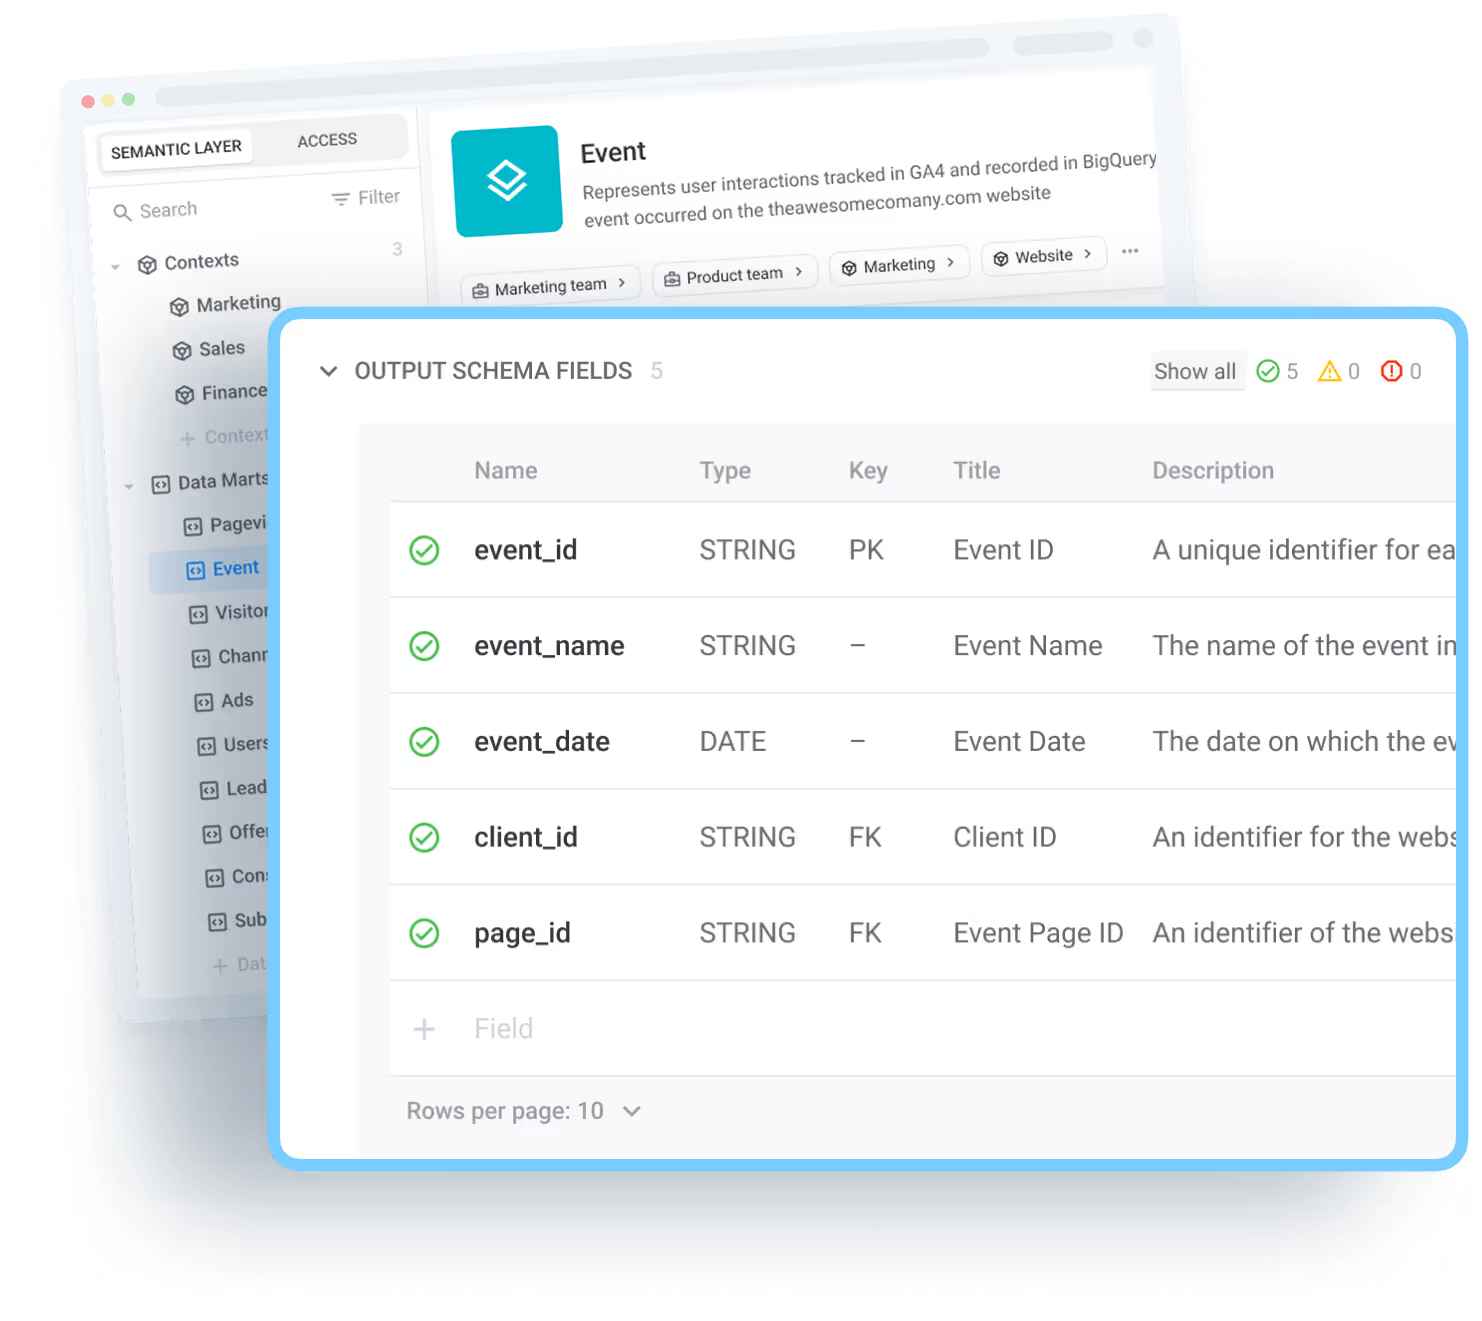
Transparent Pipeline with Spend-to-Revenue Traceability
A governed pipeline connects ad spend to leads, conversions, and revenue, making it easy to trace how each dollar turns into results. A governed CAC pipeline connects ad-platform spend directly to CRM deals, making it easy to trace how each dollar spent results in a closed customer.
This clear lineage helps analysts spot and fix issues quickly. Every field and join in the CAC Data Mart is documented, providing full visibility into data flow and ensuring easy reuse and maintenance.
Open-Source, SQL-First Framework
An open-source, SQL-first framework gives analysts complete control over how CAC is calculated. Using a SQL-first data mart ensures every CAC calculation is transparent and reproducible. Analysts can inspect or adjust logic directly in SQL while keeping full data-warehouse ownership.
There’s no hidden logic or vendor lock-in; every transformation happens in plain SQL, inside your data warehouse. This flexibility allows you to audit, extend, or adjust the logic at any time, ensuring your CAC model evolves with your business.
How to Build a Governed CAC Data Mart: Step by Step
This section walks through the key steps of building a governed CAC Data Mart. You’ll connect ad platforms and CRMs, define CAC in SQL, automate refreshes, and publish results, creating one consistent, governed reporting pipeline.
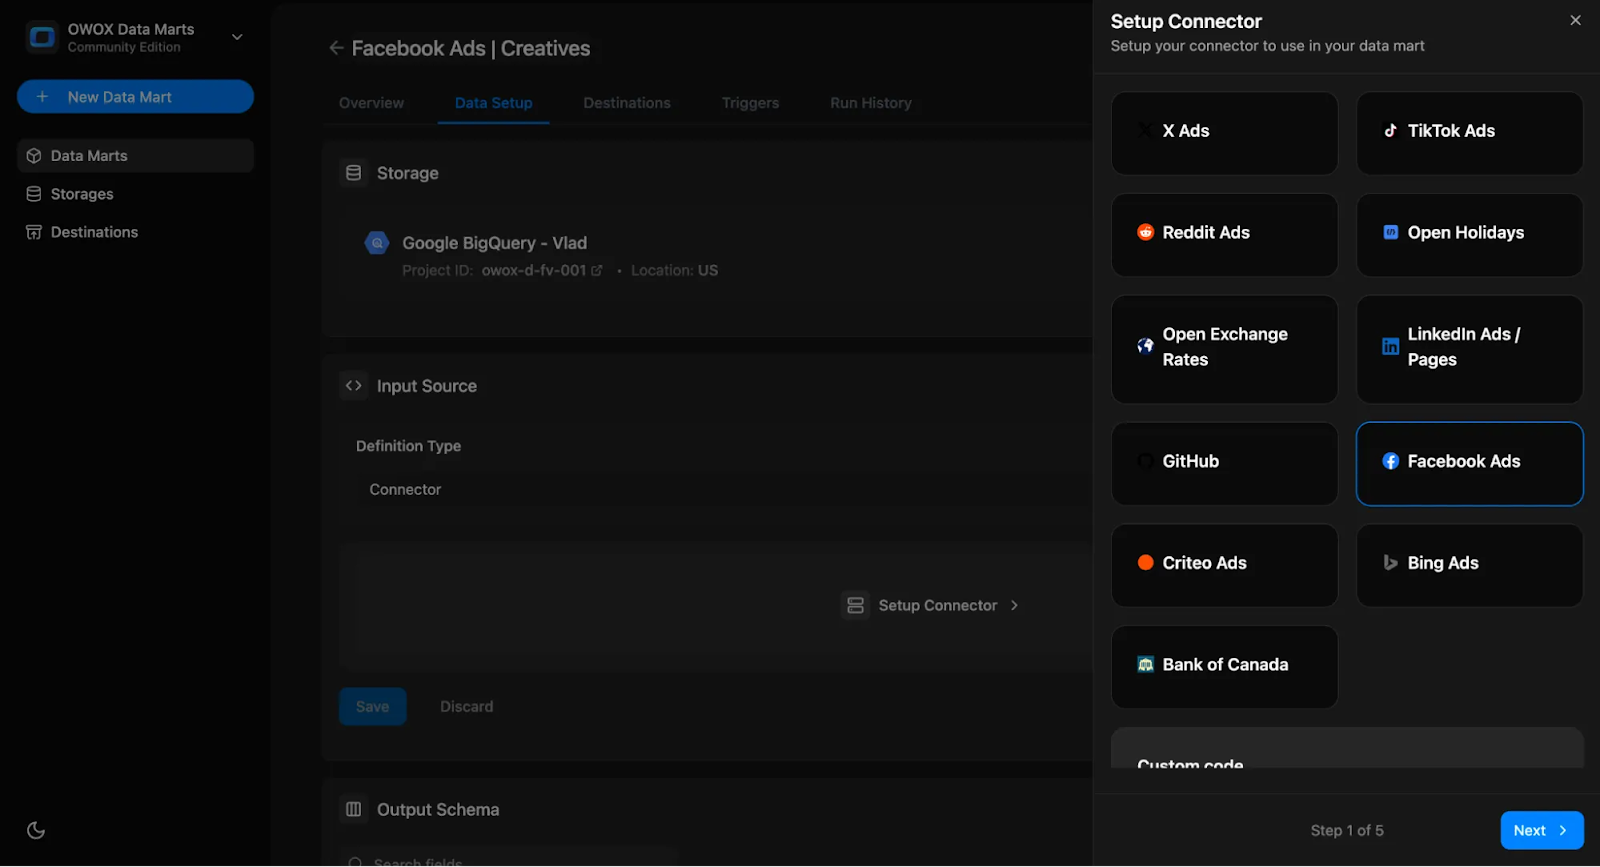
Bring in Ad Costs with Open-Source Connectors
Use open-source connectors to import ad spend from TikTok, LinkedIn, Meta, and other platforms into BigQuery. These connectors ensure data transparency and ownership while avoiding vendor lock-in.
Schedule recurring imports to keep ad tables current. OWOX Data Marts’ connector layer simplifies setup, logs schema and parameters, and ensures every data load is auditable, ideal for governed CAC reporting.
Load CRM Data into Your Data Warehouse
Bring CRM data like leads, opportunities, and deals into BigQuery using Salesforce Data Transfer. Set up regular or event-based syncs to automatically update new CRM records. This joined data makes your CAC model accurate and consistent, eliminating the need for manual CSV uploads and broken file fixes. It helps marketing and sales teams work from the same reliable data source every time.
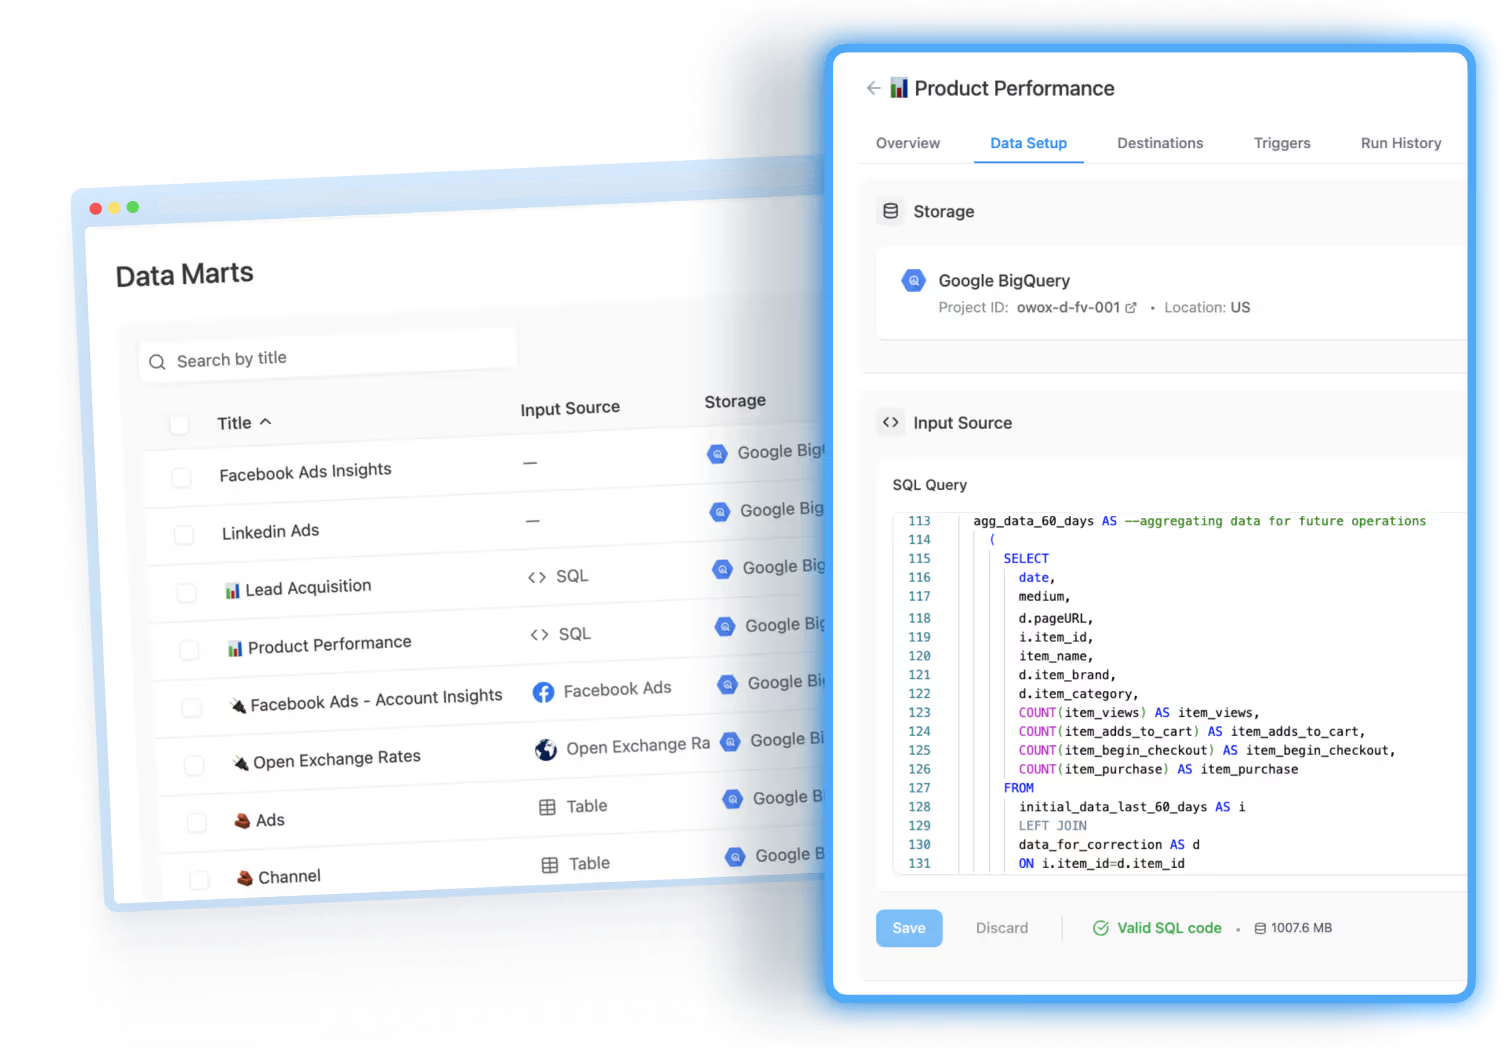
Define CAC Logic with SQL in the Data Mart
Define and store your CAC logic directly inside a SQL Data Mart. Instead of recalculating CAC separately in reports, define it once in SQL, so every tool uses the exact definition. This unified approach ensures consistency and transparency across your dashboards and exports. With OWOX, all SQL data marts are version-controlled, documented, and reusable across Sheets, Looker Studio, and other tools.
Example Query:
1SELECT
2  SUM(ad_cost) / COUNT(DISTINCT customer_id) AS CAC
3FROM
4  ad_spend
5JOIN
6  crm_deals
7ON
8  ad_spend.campaign_id = crm_deals.campaign_id
9WHERE
10  crm_deals.status = 'Closed Won';
Note: This is a simplified CAC formula. Real models should align date ranges and currencies across ad spend and CRM tables.
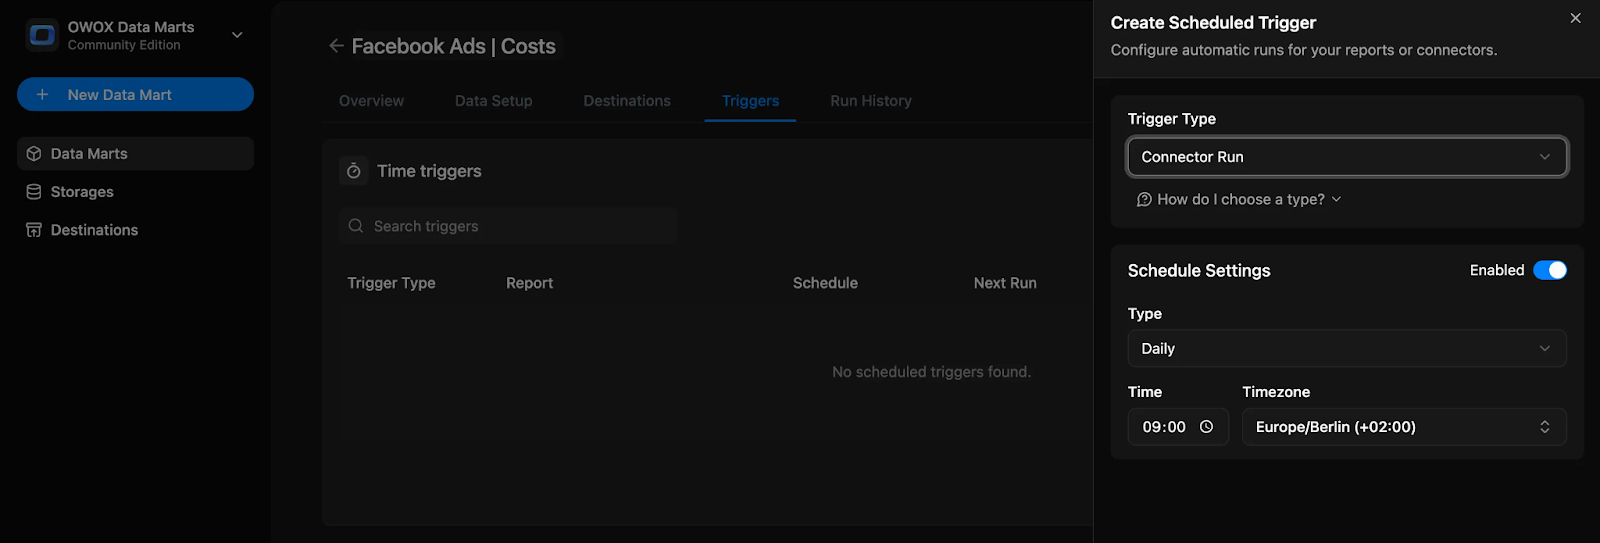
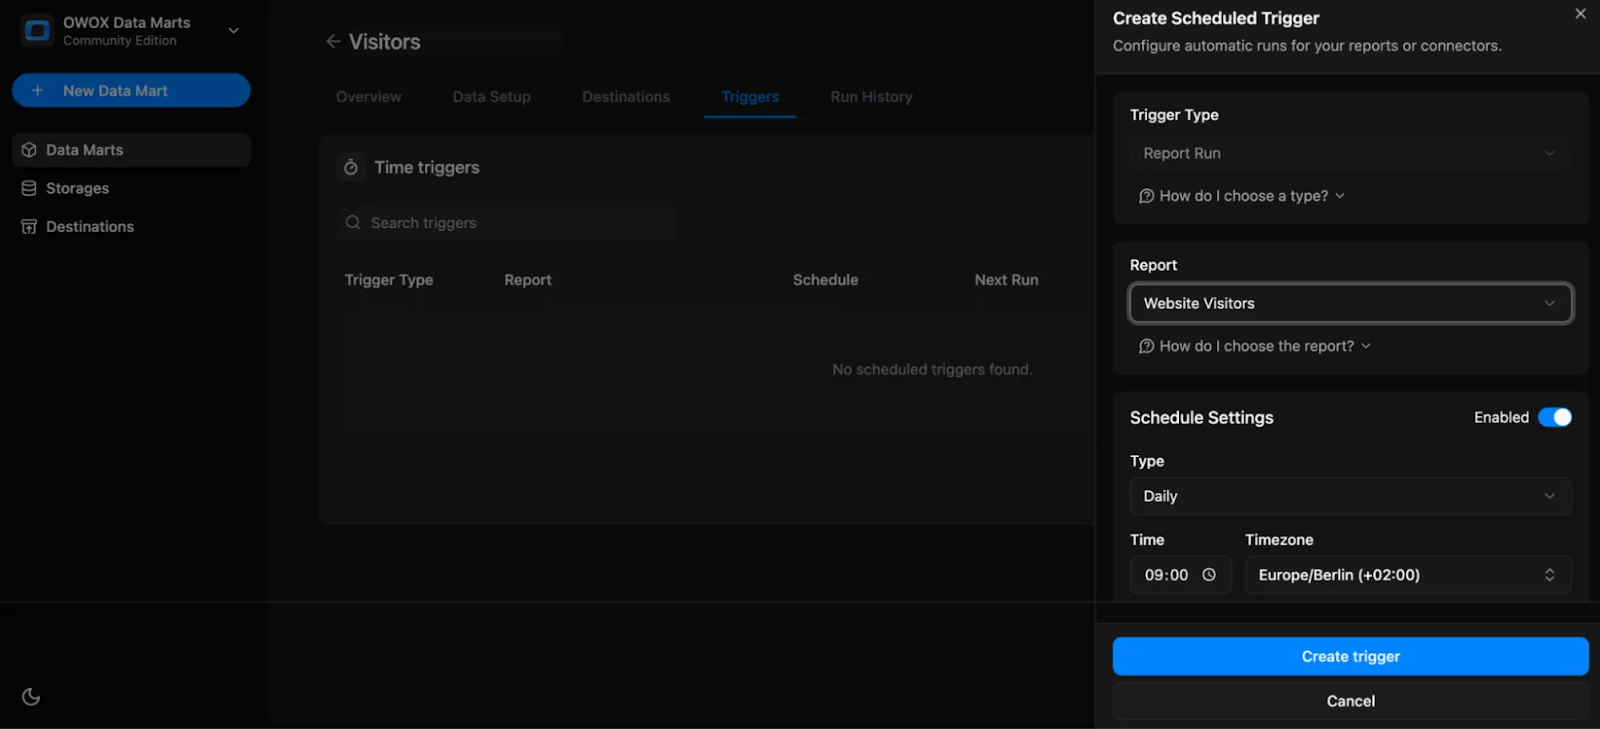
Automate Refreshes with Triggers and Scheduling
Automating CAC updates keeps your data accurate and saves time on manual refreshes. By setting up triggers, you can ensure your metrics are always current and ready for analysis.
- Connector Run Triggers: Automatically refresh ad and CRM data in your Data Mart on a set schedule, daily, weekly, or at custom intervals. This ensures all spend and revenue inputs stay updated.
- Report Run Triggers: Automate report and dashboard refreshes so outputs in Sheets or Looker Studio always show the latest CAC numbers. Every stakeholder sees up-to-date insights without rerunning queries manually.
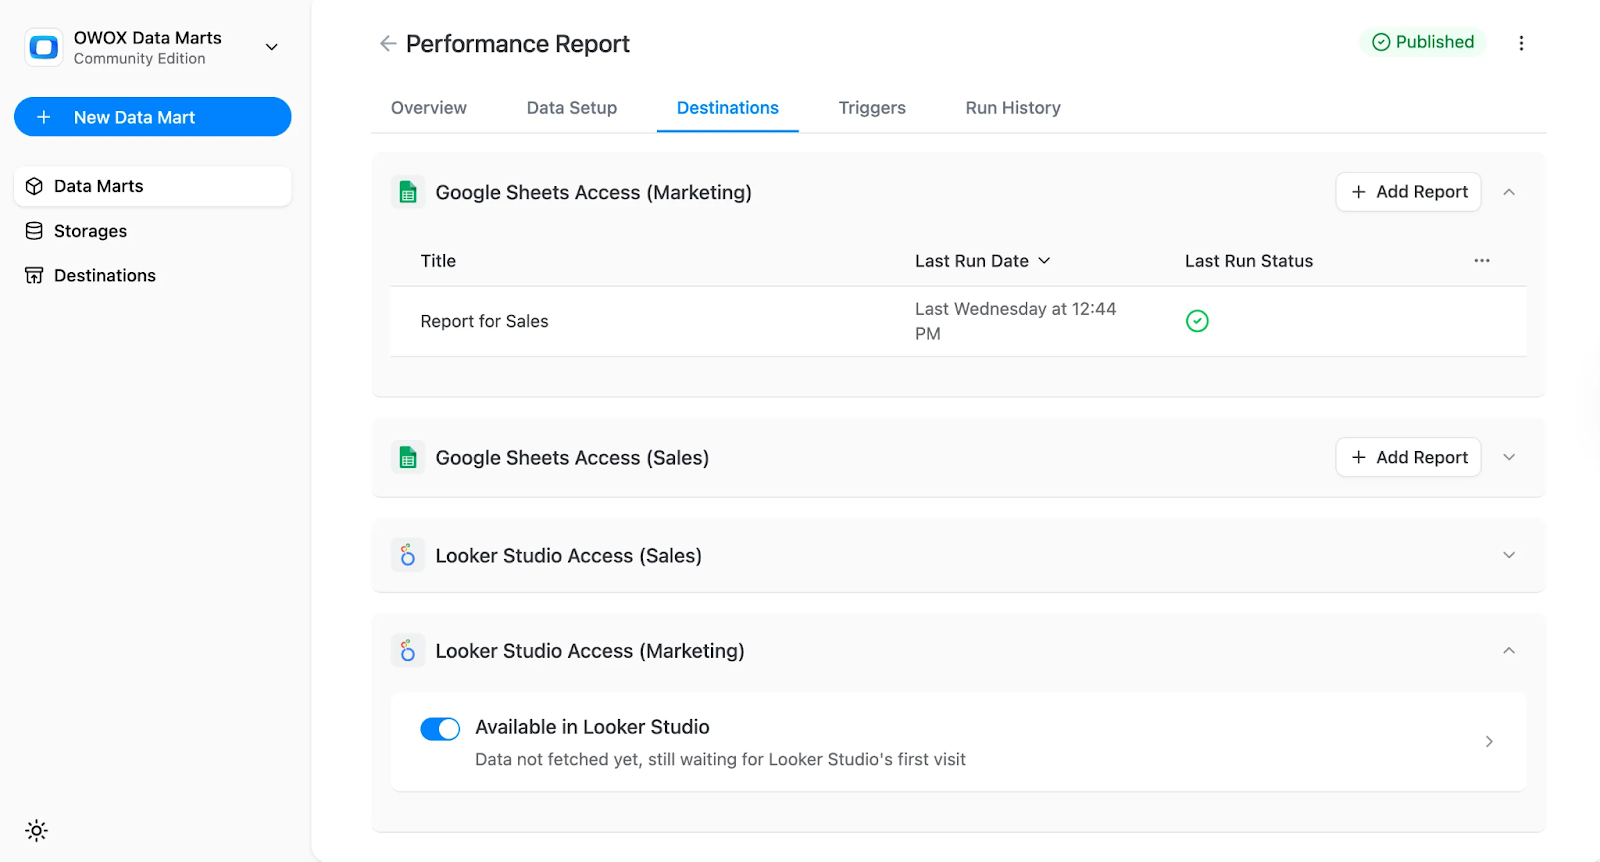
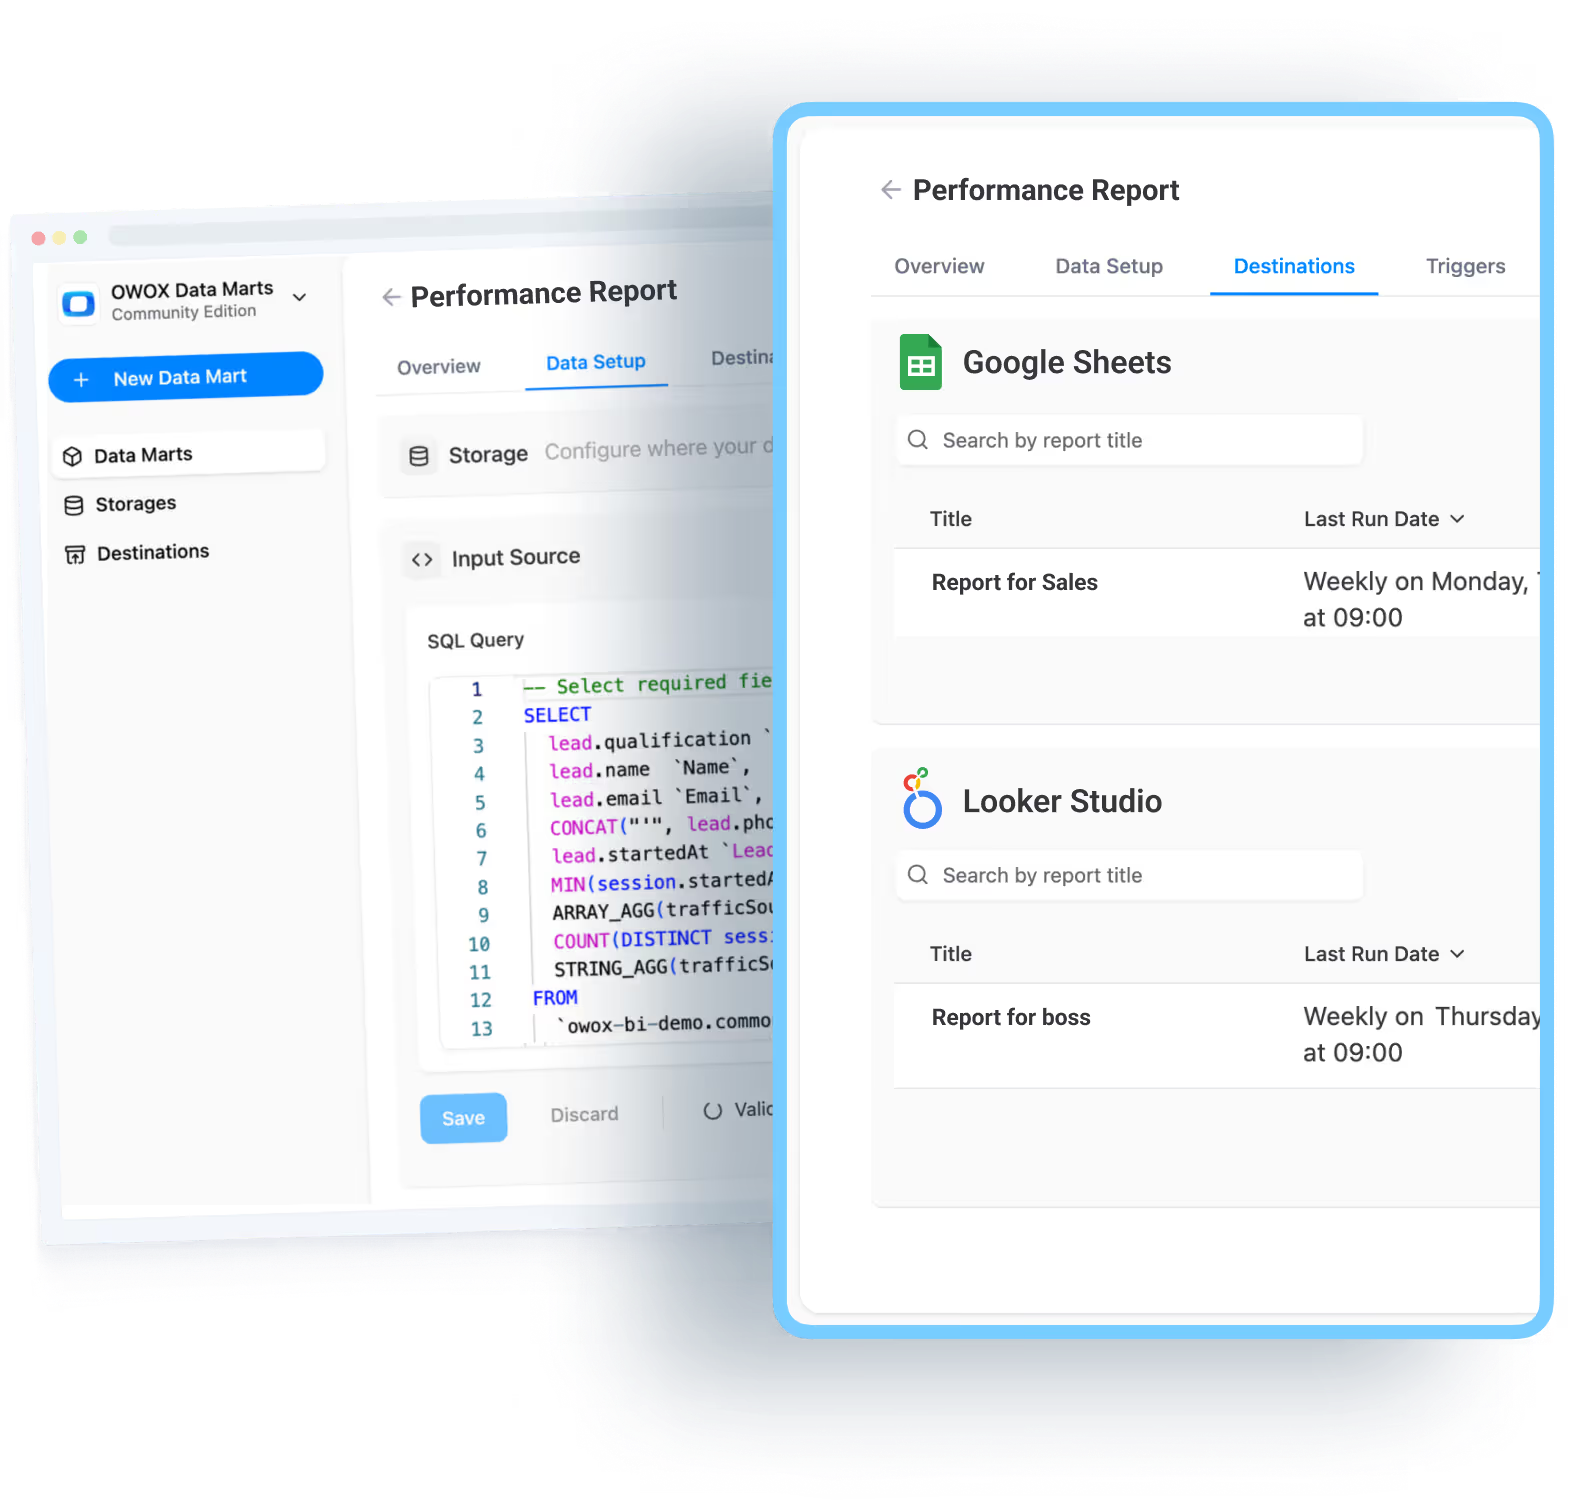
Push Outputs to Sheets and BI Tools
Automating data outputs makes CAC reporting faster and easier to access across teams. By connecting your Data Mart to familiar tools, you can share consistent, ready-to-use insights without extra effort.
- Google Sheets: Send CAC data straight into Sheets for quick analysis or collaboration. Teams can apply filters, formulas, or charts using the same governed metrics defined in your Data Mart.
- Looker Studio: Build interactive dashboards using consistent CAC definitions. Data flows directly from your Data Mart, ensuring all visuals stay up to date and aligned across reports.
Benefits of Using OWOX Data Marts for Consistent CAC Reporting
Below are the key benefits of using OWOX Data Marts to build consistent, reliable CAC reports, from centralizing logic to automating delivery across tools your teams already use.
Central Repository for CAC/LTV Logic
A central SQL repository stores all your CAC and LTV formulas in one place, with version control to track every change. Teams no longer rely on scattered spreadsheets or outdated logic. Instead, they reference a single source that’s updated, documented, and easy to maintain, ensuring consistent reporting across departments, tools, and time periods without confusion or duplication.
Ensure Alignment Across Analysts and Marketers
When CAC logic is defined in one central place, everyone pulls from the same version. Analysts and marketers no longer argue over filters, attribution windows, or cost breakdowns. Instead, all teams work with identical numbers. This alignment avoids confusion, speeds up reporting, and builds trust across departments by ensuring everyone views the same information.
Eliminate Patchwork Scripts and Hidden Calculations
One-off scripts and hidden formulas in dashboards make CAC reporting hard to trust and even harder to maintain. With a governed Data Mart, all calculations live in one central, visible layer. This makes the logic easy to review, update, and reuse. Analysts spend less time fixing broken reports, and marketing teams get consistent numbers they can rely on.
Open-Source Connectors for Cost and Revenue Data
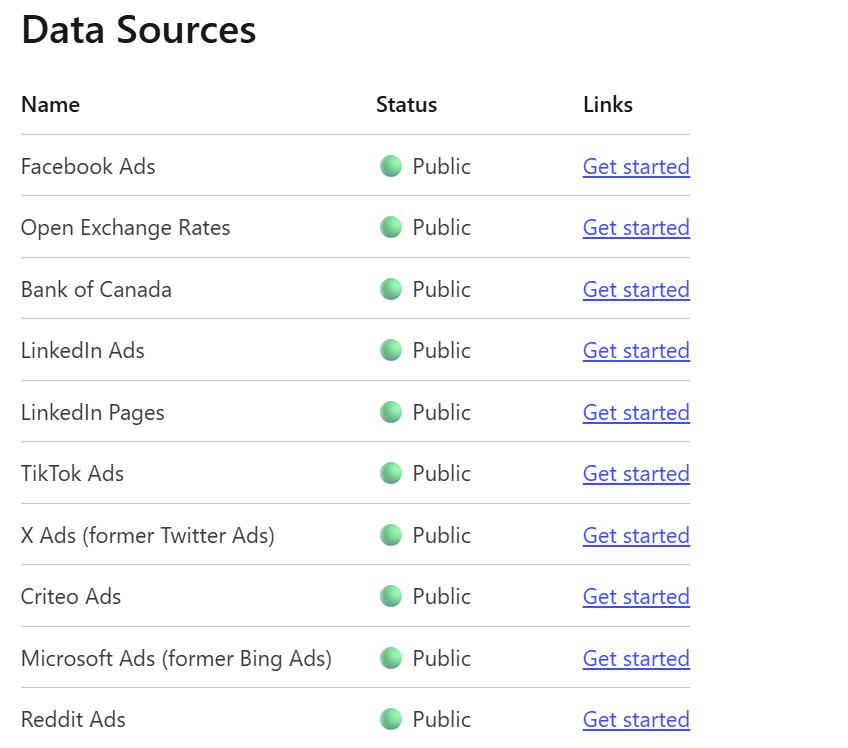
OWOX provides an open-source JavaScript connector library to bring in ad spend from platforms like Facebook, TikTok, Reddit, Criteo, Twitter, and LinkedIn directly into your data warehouse. Since the connectors are open and transparent, you’re not tied to a black-box SaaS. You control how the data flows, making it easier to build reliable, cost-effective CAC reports on your terms.
Governed SQL Marts for CAC/LTV Logic
With OWOX, your CAC and LTV logic is defined inside governed SQL Data Marts, not scattered across scripts or dashboards. These marts ensure that every calculation follows the same rules, with clear definitions and full version control. This makes your metrics consistent, auditable, and easy to maintain, so teams can trust the numbers and stop rebuilding logic from scratch.
Automatic Refresh and Distribution to BI Tools
With OWOX, you can schedule automatic refreshes for your CAC Data Marts and push the results directly to Google Sheets or Looker Studio. This keeps your reports up to date without manual exports or copy-paste steps. Business users always see the latest numbers, while analysts save time and ensure consistent, governed data reaches the tools teams already use.
Key Takeaways for Analysts and Marketing Teams
Building a governed CAC Data Mart enables both analysts and marketers to rely on a single, consistent, and transparent reporting layer. It removes repetitive work, aligns teams around shared definitions, and ensures everyone sees accurate, trusted numbers for smarter decision-making.
Clarity in CAC Numbers
When all reports use the same metric definitions, every team sees one version of CAC, no more mismatched figures across dashboards. A unified metrics layer eliminates data inconsistencies, fosters trust, and ends confusion about which number is correct. This alignment allows marketing, finance, and leadership teams to make decisions confidently, based on shared, accurate performance data.
Save Analyst Time with Reusable Logic
Defining CAC logic once and reusing it prevents analysts from repeatedly rebuilding joins or formulas for every new request. This saves hours of manual work and ensures uniform calculations across dashboards. Reusable logic also reduces human error and improves efficiency, freeing analysts to focus on insights and optimization instead of reengineering the same metric again and again.
Deliver Trusted Numbers to Business Users
When analytic models are governed and consistent, business users get CAC numbers they can trust. With CAC logic centralized in the semantic layer, analysts define once and reuse everywhere. This ensures every dashboard reflects the same definitions, boosting credibility and adoption across teams while enabling marketers and decision-makers to act confidently on unified, reliable data.
Build Your CAC Report with OWOX Data Marts
Ready to create a CAC report that’s consistent, governed, and easy to maintain? With OWOX Data Marts, you can unify ad spend and CRM data, define CAC logic once in SQL, and deliver accurate numbers to every team, without manual joins or repeated work. Use open-source connectors, automate refreshes, and publish directly to Sheets or Looker Studio.
Start building a trusted CAC reporting layer your entire organization can rely on.
Frequently asked questions
.png)


Finally, a tool that doesn't ask business users to learn a new dashboarding UI. Our marketing team already knows Sheets. OWOX just delivers the right data.
Joinable data marts concept was the thing that sold us. We can now use the semantic layer without building one.
Self-hosted the OSS version on Digital Ocean. Zero vendor lock-in. Contributed a Shopify connector back in week two.