Collect Facebook Ads data in Google BigQuery
Load Facebook and Instagram ad performance into your own BigQuery tables with OWOX Data Marts: ads, creatives and insights, each in its own table, refreshed on a schedule. Join it with web analytics and CRM to see which ads bring customers and deals.
Facebook Ads Endpoints
15 Facebook Ads endpoints you can import. Each lands in its own table in your data warehouse.
Ad
Individual ads with their creative, status, and links to their campaign and ad set.
32 fieldsAd Account
Your ad account settings, status, currency, and billing details.
61 fieldsAd Account User
Users with access to an ad account and their assigned roles.
2 fieldsAd Creatives
The images, videos, text, and other visual elements used in your ads.
63 fieldsAd Insights
Daily performance metrics for each ad — impressions, clicks, spend, and conversions.
100 fieldsTime seriesAd Insights by Ad Set
Daily ad set performance with reach deduplicated to match Meta Ads Manager.
92 fieldsTime seriesAd Insights by Age and Gender
Daily ad performance broken down by audience age range and gender.
102 fieldsTime seriesAd Insights by Campaign
Daily campaign performance with reach deduplicated to match Meta Ads Manager.
89 fieldsTime seriesAd Insights by Country
Daily ad performance broken down by the country where your audience is located.
101 fieldsTime seriesAd Insights by Device Platform
Daily ad performance broken down by the device type your audience used.
101 fieldsTime seriesAd Insights by Link URL Asset
Daily ad performance broken down by the link URL shown in your ads.
101 fieldsTime seriesAd Insights by Product ID
Daily ad performance broken down by individual product from your catalog.
101 fieldsTime seriesAd Insights by Publisher Platform and Position
Daily ad performance broken down by where your ads appeared — platform and placement position.
102 fieldsTime seriesAd Insights by Region
Daily ad performance broken down by the region where your audience is located.
101 fieldsTime seriesAds
Individual ads with their status, creative, and campaign hierarchy.
24 fields
Why join Facebook Ads with your web analytics and CRM
Ads Manager reports what Facebook and Instagram say they delivered, counted by Meta's own attribution. To see which ads brought customers and revenue, spend has to sit next to website touch points and CRM deals in one warehouse.
- Put Facebook next to Google, TikTok and Microsoft spend in one table
- Connect ad clicks and sign-ups to the orders and deals they became
- Keep spend, reach and ROAS in your own tables, not inside an ad account
 Facebook AdsAd spend, reach
 Your data warehouseAdTouch pointDealJoined by idAd seen or clickedDeal months laterOne query links the ad to the deal.
Step 1: Connect Facebook Ads and pick the fields
Create a Data Mart, choose Facebook Ads as the source, sign in with Facebook or add an access token, list your ad account ids and tick only the fields you need.
- 15 endpoints and 1172 fields to choose from
- Ad Insights alone has 100 fields: spend, reach, clicks, conversions, ROAS
- One Data Mart per endpoint, so each breakdown stays its own table
 Google AdsFacebook Ads
 TikTok AdsAuthorizeConnectedEndpointAd InsightsAdAd AccountAd Account UserAd Insightsdate_startspendimpressionsclicksreachpurchase_roas
Step 2: Load Facebook Ads into a BigQuery table
The dataset and table in your storage are pre-filled, and you can change them. Run it and the first load, from the start of the previous month through today, lands in your own BigQuery project.
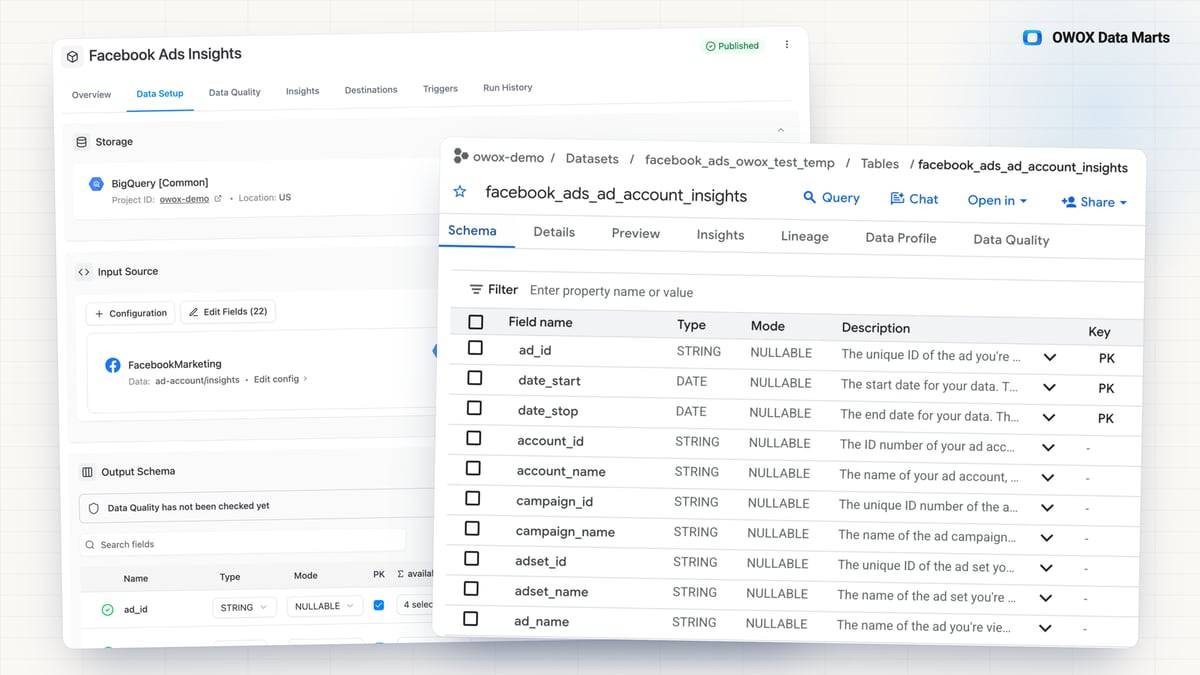
- Insights go to a table such as facebook_ads_ad_account_insights
- Every run is logged in Run History
DestinationDatasetfacebook_adsTablead_account_insightsRunTablefacebook_ads.ad_account_insig…Step 3: Get a business-friendly output schema
After the first run you get the output schema: every field with a readable description, not an API identifier. Your quality checks can read it too.
- Results such as actions and action_values are fields of their own, with descriptions
- Anyone on the team can read the table
facebook_ads.ad_account_insightsOutput schemaFieldDescriptiondate_startThe start date for your data…spendThe estimated total amount of…impressionsThe number of times your ads…clicksThe number of clicks on your ads.reachThe number of people who saw…purchase_roasThe total return on ad spend…Step 4: Keep the Facebook Ads tables linked
Ad accounts, ads, creatives and insights stay separate tables, joined by ids. Together they become one Facebook Ads model.
- ad_id in Ad Insights is the id of the ad, and creative_id on the ad points to its creative
- Campaign and ad set ids ride on every row, so spend rolls up to either level
Ad Accountnameaccount_idAd CreativesidnameAdsidaccount_idcreative_idAd Insightsad_idspendStep 5: Schedule the refresh and backfill history
Set it once. A daily scheduled refresh keeps the tables current, and a manual backfill loads any past period.
- Run it daily, weekly, monthly or on an interval
- Backfills longer than a month are split into segments of up to 31 days for you
Step 6: Reuse the same table everywhere
One table feeds your model, , , assistants like Claude and ChatGPT, and scheduled AI insights in Slack or email.
- Blend Facebook with Google and TikTok spend once
- Every report reads the same table
Facebook AdsData MartPublished Google Sheets
 Data Studio dashboards
 Claude, ChatGPT
 Slack, email





- 0.41.0Rotating a warehouse key is one change: Storages share reusable Credentials
- 0.41.0Dates from Google Sheets arrive as dates, not text
- 0.41.0Shared SQL logic stays in one place: build a Data Mart on top of another
- 0.41.0Rotating a connector key is one change: Sources share reusable Credentials
- 0.40.0Connecting a plan from Google Sheets takes fewer guesses
Why OWOX for Facebook Ads in BigQuery
Hand-built Marketing API scripts, a generic ETL tool or manual exports each get Facebook data out. OWOX also keeps it yours, readable and ready to model.
- You own the data. It lands in your own BigQuery project, in tables you control, not inside an ad account.
- One table per breakdown. Country, region, age and gender, device, placement and product breakdowns each load into their own table, so you take the cuts you need and leave the rest.
- Ready for a data model. Separate tables joined by ad, ad set and campaign ids, built to connect to web analytics and CRM.
- Maintained for you. No scripts to fix when Meta updates the Marketing API.
- Free to self-host. The open-source OWOX Data Marts runs in your own infrastructure.
You are booked. The invitation is on its way to , with the calendar invite and the meeting link.
Schedule in person meeting at Data Outpost San Francisco
You are booked. The invitation is on its way to , with the calendar invite and the meeting link.