Data mart vs dashboard vs chatbots: which analytics architecture actually wins?
Most analytics teams don’t choose an architecture – they inherit one. Someone sets up a few dashboards, a few more get requested, and before long you’re maintaining forty Looker reports that nobody fully trusts. Or maybe leadership bought an AI chatbot tool that promises “just ask your data anything” and now half the answers come back wrong.
The real question isn’t which BI tool is best. It’s which architecture sits between your warehouse and your business users – and whether that architecture actually scales self-service or just creates more work for your data team.
This article breaks down three dominant approaches – dashboard-first, chatbot-first, and data-mart-first – and makes the case for why the last one wins for most analytics teams. I’ve spent enough years fielding the “can you pull something quick?” requests to know that architecture choices have real consequences for how fast (or slow) a data team can move.
Three analytics architectures explained
Three analytics architectures explained
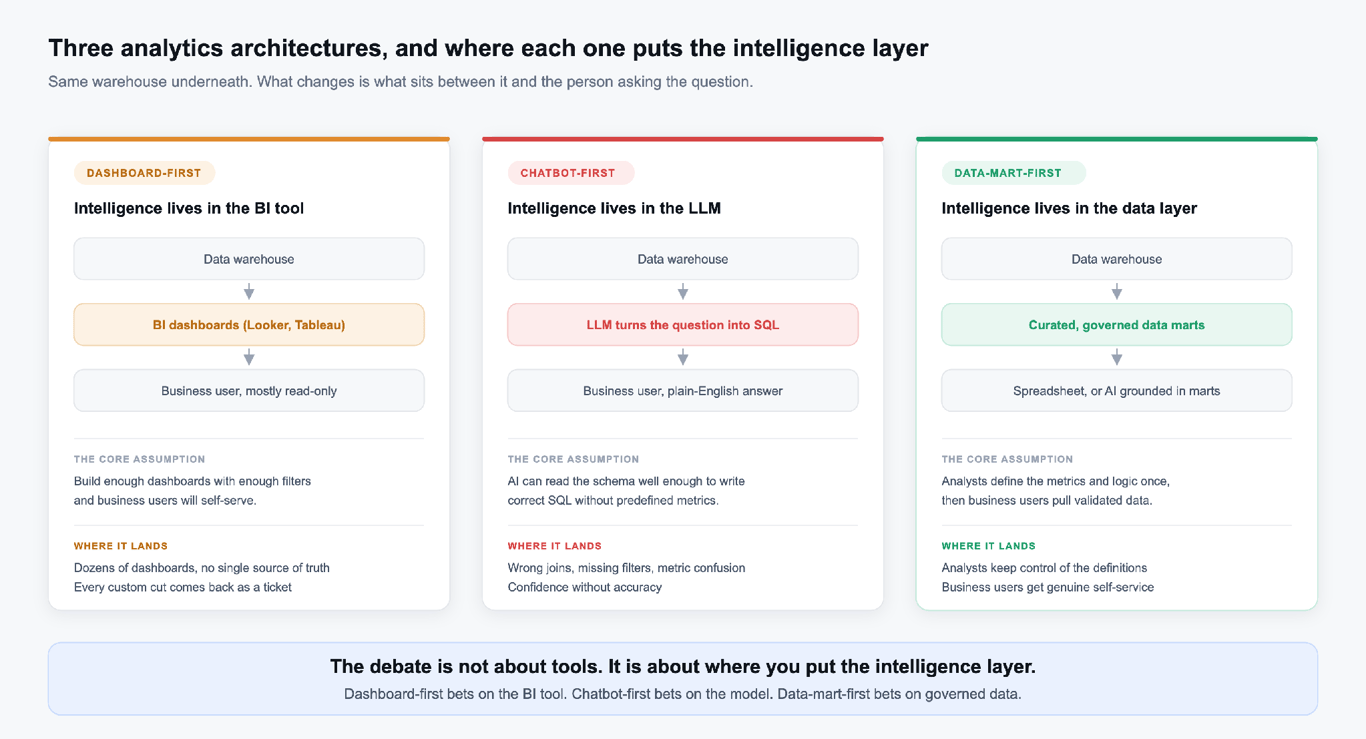
Before we compare trade-offs, let’s define what each architecture actually looks like in practice. Each one makes a different bet on where the “intelligence layer” lives between your warehouse and the people asking questions.
Dashboard-first architecture
This is the most common setup. Raw data flows into a warehouse, gets transformed (usually via dbt or stored procedures), and lands in a BI tool – Looker, Tableau, Power BI, or Looker Studio. The dashboard is the primary interface. Business users log in, pick a dashboard, and (in theory) find their answers.
The core assumption: if you build enough dashboards with enough filters, business users will self-serve. The data team’s job is to build and maintain those dashboards.
Chatbot-first architecture
A newer approach where an AI layer sits directly on top of the warehouse. Tools like ClickHouse’s AI-first warehouse concept or various text-to-SQL products let users type natural-language questions – “what was our CAC last quarter?” – and get answers generated on the fly.
The core assumption: AI can understand your schema well enough to write correct SQL and return trustworthy answers without predefined metrics.
Data-mart-first architecture
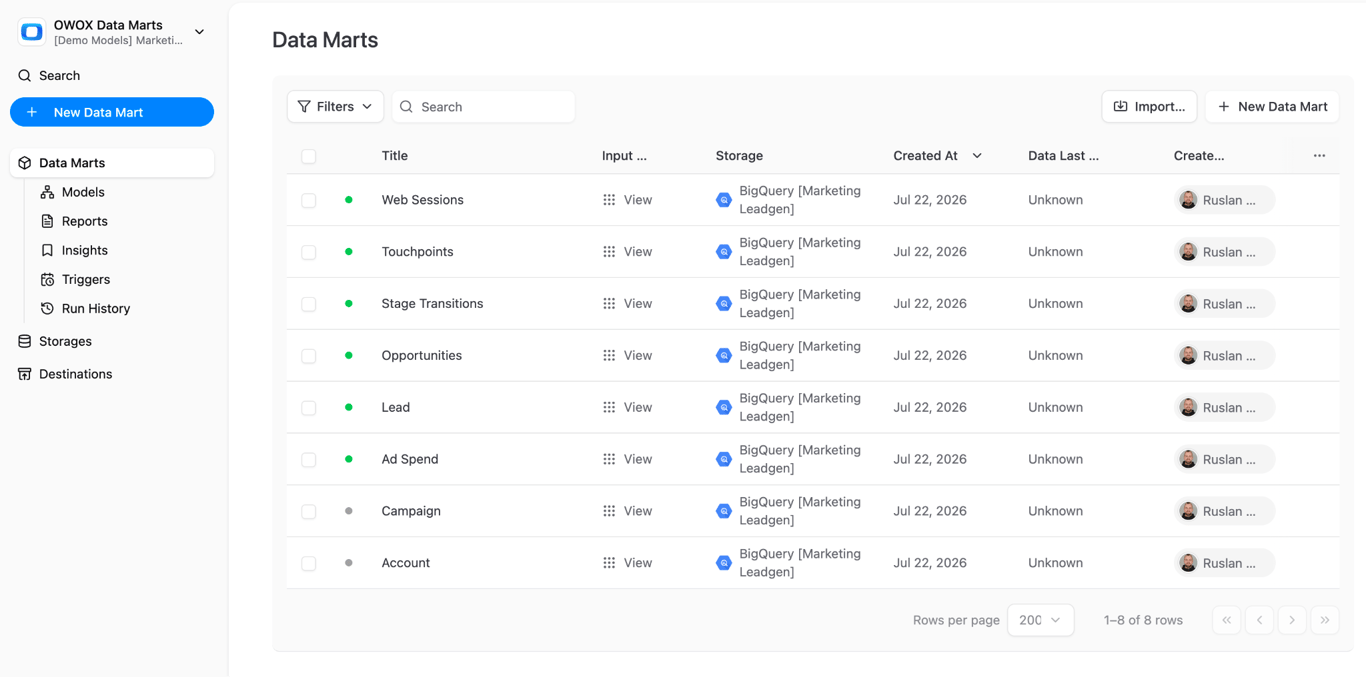
Here, the intelligence layer is a curated set of data marts – pre-modeled, business-ready datasets that analysts define and maintain. Business users consume these data marts through familiar tools like spreadsheets, or through AI that’s grounded in those trusted datasets rather than raw tables.
The core assumption: analysts should define the metrics and logic once, then let business users pull from validated, governed data – in whatever format they prefer.
Why dashboard-first analytics creates more problems than it solves
Why dashboard-first analytics creates more problems than it solves
Dashboard-first is the default for a reason – it’s intuitive and BI tools have decades of momentum. But after a certain scale, the cracks become structural, not cosmetic.
Dashboard sprawl and the trust deficit
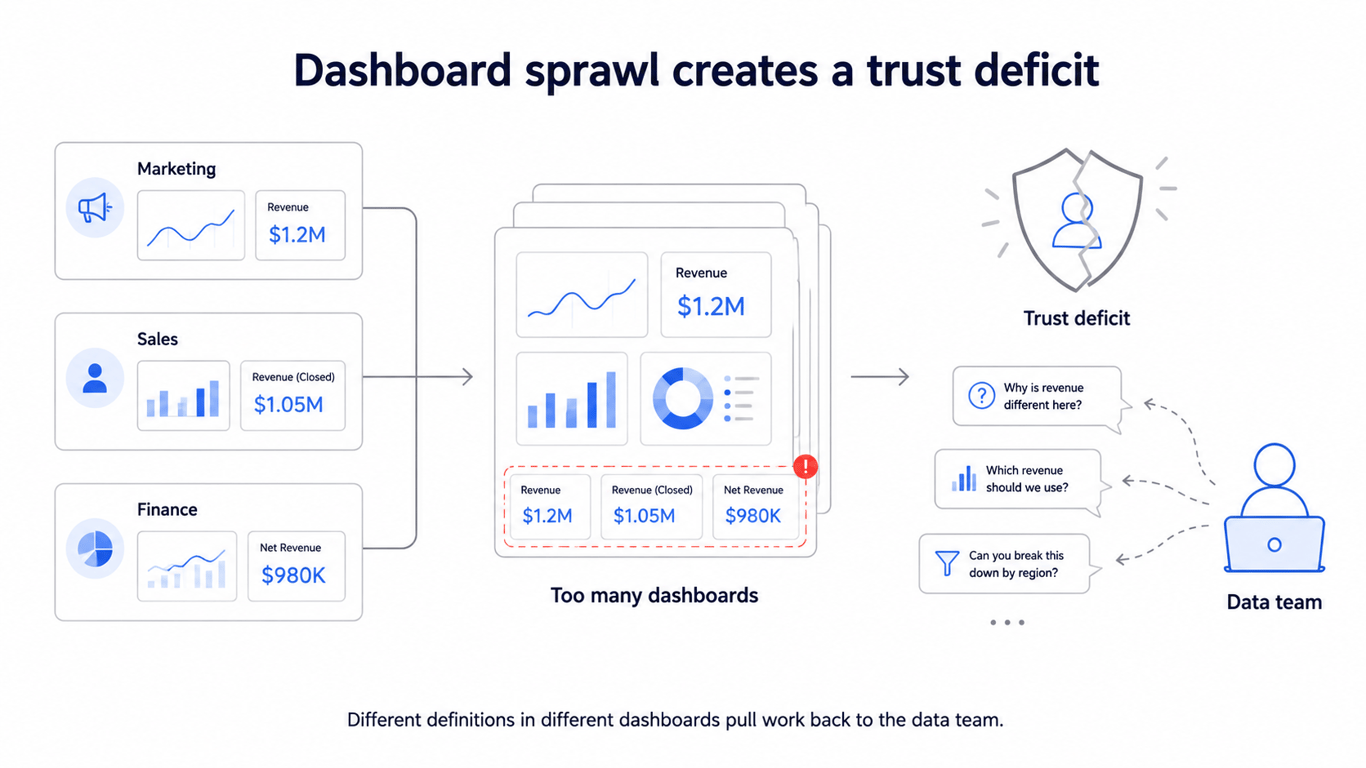
It usually starts innocently. Marketing wants a campaign dashboard. Sales wants a pipeline board. Finance wants a revenue tracker. Each one gets built, often by different people, with slightly different metric definitions.
Within a year, you’ve got dozens of dashboards and no single source of truth. “Revenue” means one thing on the CMO’s dashboard and something else on the CFO’s. Nobody remembers who built the Q3 retention report or whether the filters are still correct.
The result is a trust deficit. When stakeholders don’t trust the numbers, they stop using the dashboards – which means every question comes right back to the data team as an ad-hoc request. I’ve seen teams where 60% of analyst time went to answering Slack messages that a dashboard was supposed to handle.
The self-service illusion
BI vendors sell “self-service analytics” – the idea that business users can build their own views, apply their own filters, and answer their own questions. In practice, most business users interact with dashboards in read-only mode. They open a dashboard, glance at the top-line numbers, and close it.
The moment they need a custom cut – say, comparing campaign performance across two specific segments over a non-standard date range – they can’t do it. The dashboard doesn’t have that filter. So they ask the data team. Self-service becomes a queue.
The spreadsheet workaround
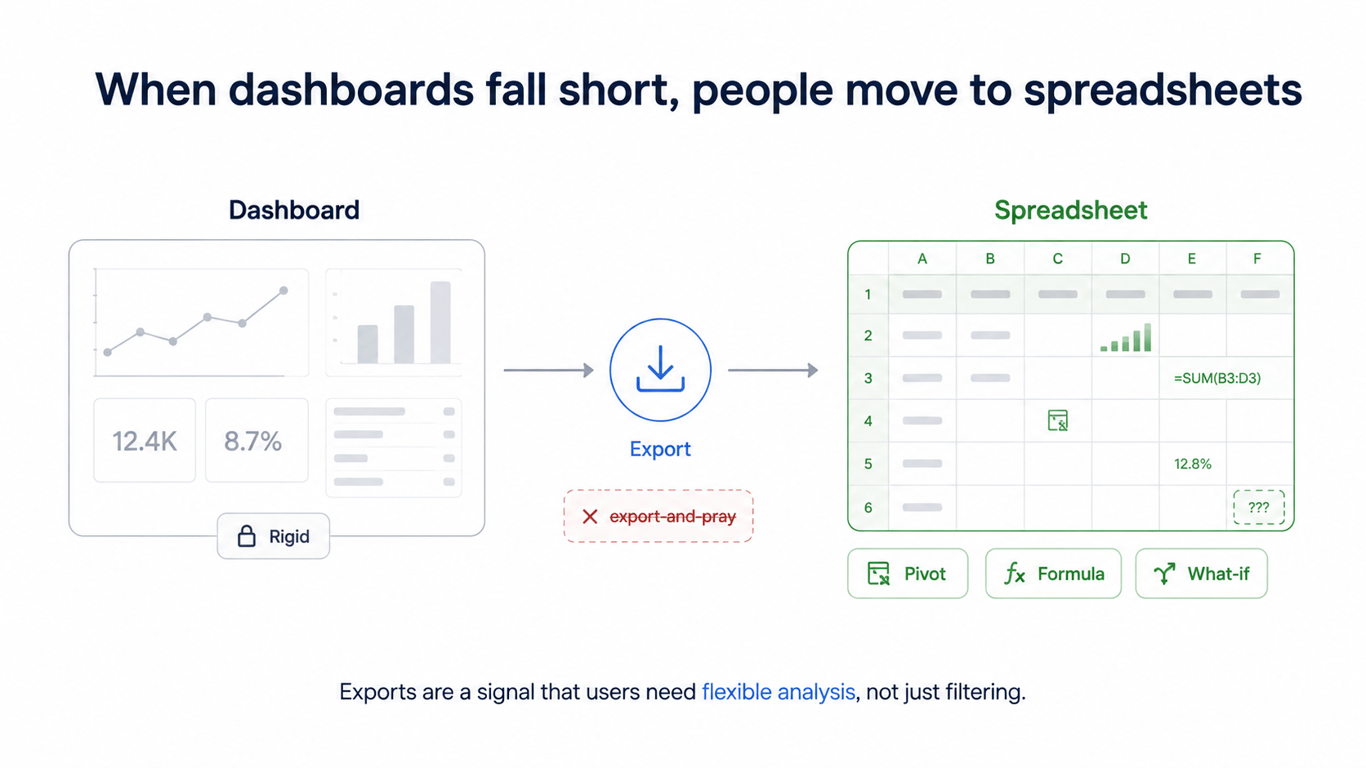
Here’s what actually happens when dashboards fall short: people export to spreadsheets. They download a CSV, open Google Sheets, and do the real analysis there – the pivots, the what-if scenarios, the custom calculations their dashboard can’t support.
This is a signal, not a bug. Spreadsheets are where business users actually think. They want rows and columns they can manipulate, not a locked-down visual they can only filter. Dashboard-first architecture fights this instinct instead of embracing it.
If your team is constantly exporting dashboard data into spreadsheets, that’s your architecture telling you it’s wrong. There are better ways to get BigQuery data into reports without the export-and-pray workflow.
OWOX Data Marts
See your first report built in real time. 15 minutes.
- Connect your data warehouse
- Pick your metrics
- Get a live Google Sheets report
In the time it takes to write a ticket. Then imagine never writing that ticket again.
Book a DemoWe'll use your actual use case
Chatbot-first analytics and the hallucination problem
Chatbot-first analytics and the hallucination problem
AI-powered analytics is the hot new architecture. The pitch is compelling – skip dashboards entirely, let people ask questions in plain English, and get instant answers. But the implementation has serious gaps.
How AI-on-warehouse tools work
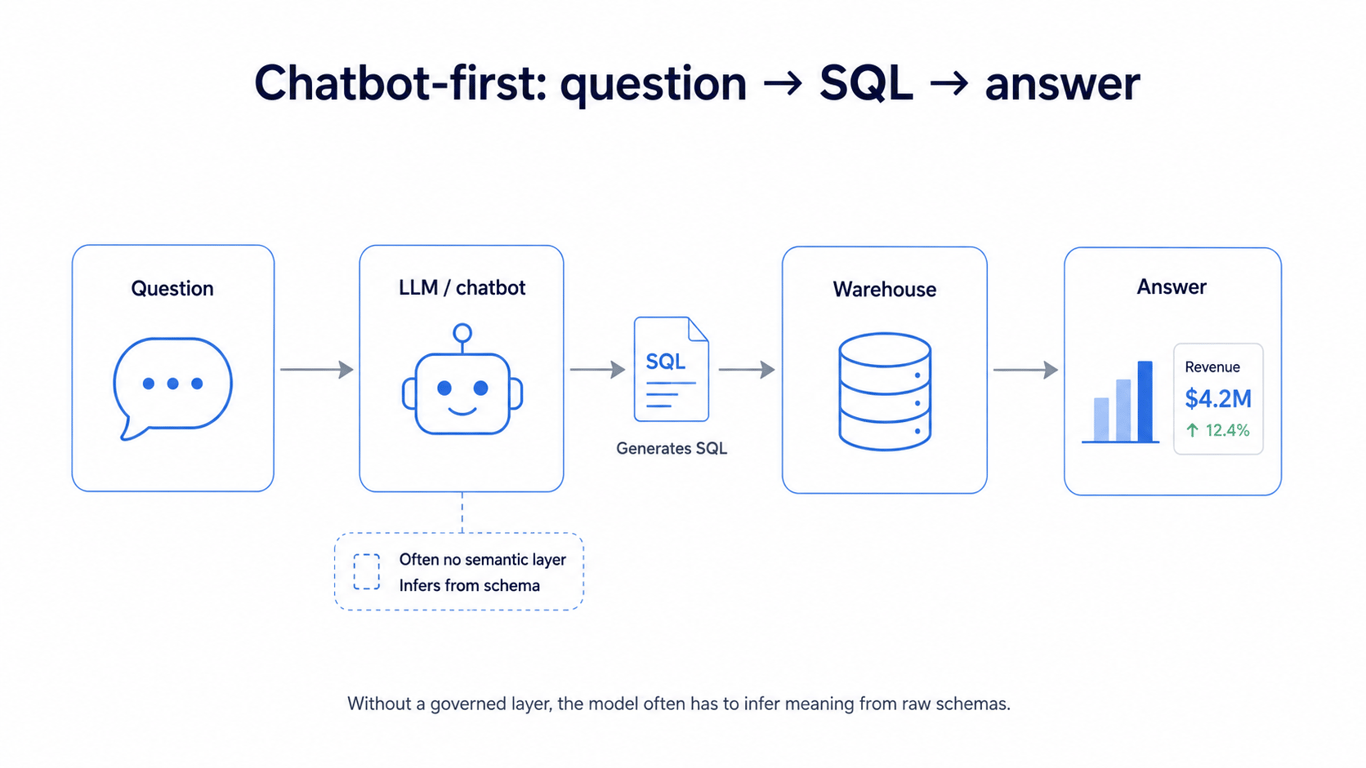
Most chatbot-first tools follow a similar pattern. They connect directly to your data warehouse, read your schema (table names, column names, sometimes sample data), and use an LLM to translate natural-language questions into SQL queries. The query runs, and the results come back as a chart or a number.
Some tools add a semantic layer on top – metadata about what each column means, how metrics are calculated, what joins are valid. But many ship without this, relying on the LLM to figure it out from column names alone.
Why they hallucinate metrics
The fundamental problem is that warehouse schemas weren’t designed to be self-documenting. A column called `revenue` might be gross revenue, net revenue, or recognized revenue depending on the table. A table called `users` might include test accounts. An AI that generates SQL from these schemas will produce answers that look right but are wrong.
Common failure modes include:
- Wrong joins – the AI joins tables that shouldn’t be joined, producing inflated numbers
- Missing filters – it forgets to exclude test data, internal users, or cancelled orders
- Metric confusion – it calculates a metric differently than your team’s agreed-on definition
- Confidence without accuracy – the answer comes back with a clean chart and no uncertainty indicator, so users trust it
This isn’t a solvable-with-better-prompts problem. It’s a structural issue. Without a curated layer that defines what “revenue” means and which filters always apply, the AI is guessing – and guessing with conviction.
When chatbot-first makes sense (and when it does not)
Chatbot-first works for exploratory questions against well-documented schemas – data teams poking at their own data, or analysts who can validate the generated SQL before sharing results. It also works when paired with a semantic layer that constrains what the AI can do.
It does not work as the primary analytics interface for business users who can’t read SQL and won’t know when the answer is wrong. For AI-ready analytics, you need governed data underneath, not a language model interpreting raw tables.
Why data-mart-first wins for self-service teams
Why data-mart-first wins for self-service teams
Data-mart-first architecture solves the core tension that the other two approaches can’t: analysts stay in control of metric definitions while business users get genuine self-service – not the “look but don’t touch” version.
Analysts define, business users consume
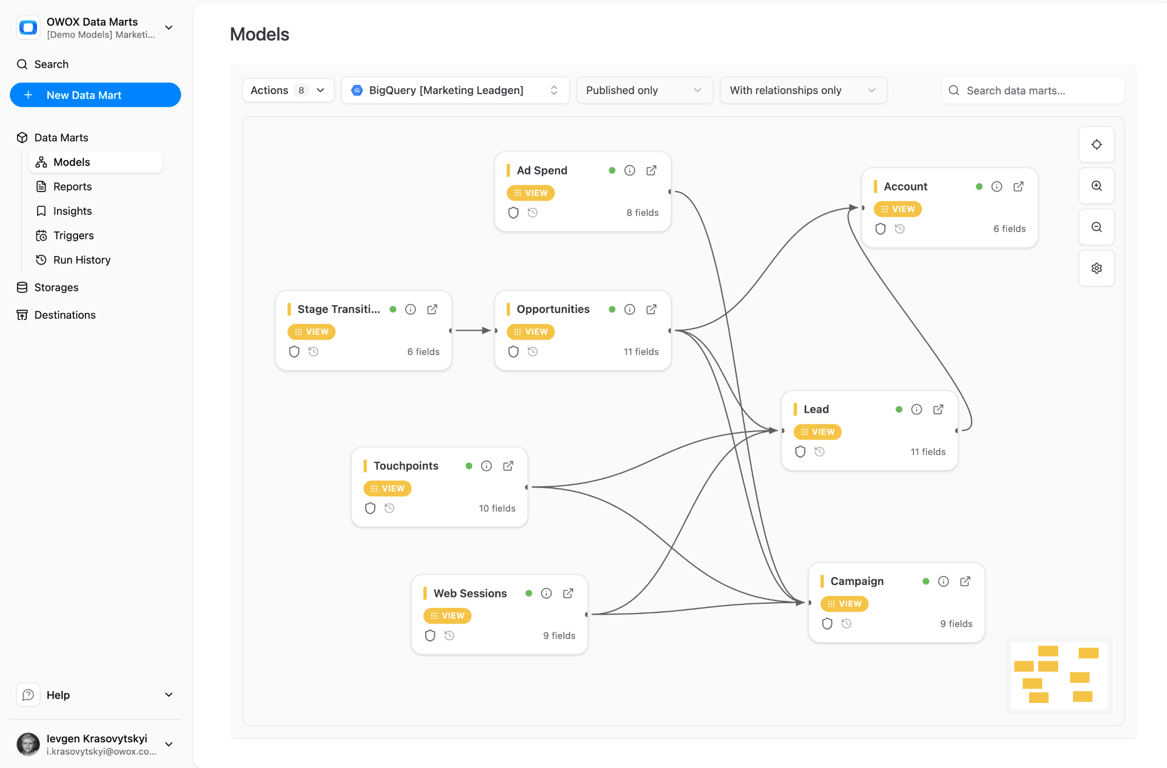
In this architecture, the data team’s primary output isn’t a dashboard or a SQL query – it’s a set of well-modeled data marts. Each data mart is a curated, business-ready dataset with clear metric definitions, proper joins, and appropriate filters already baked in.
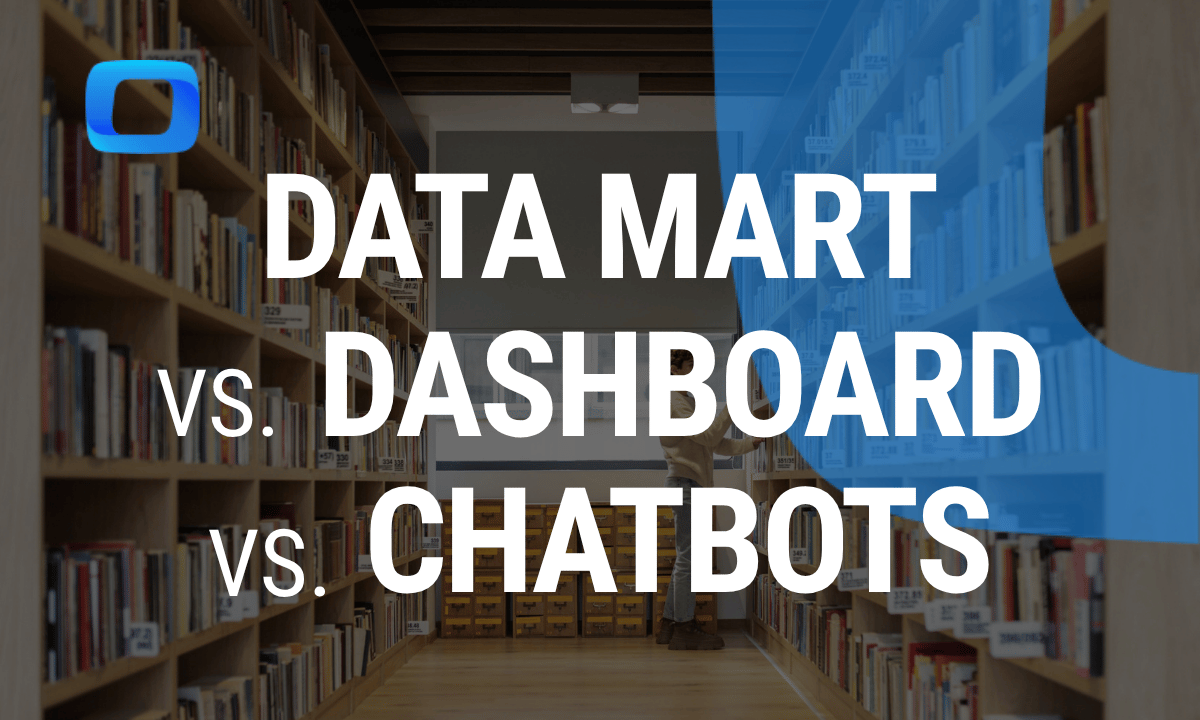
Think of it like a library. The analysts are the librarians – they organize, catalog, and validate the collection. Business users are the readers – they check out what they need and use it however they want. Nobody asks the librarian to read the book for them.
This separation of concerns is what makes self-service actually work. The analyst doesn’t need to build a new dashboard every time someone asks a new question. The business user doesn’t need to file a ticket to get a custom data cut. Both sides do what they’re good at.
Spreadsheets as the delivery layer
Instead of forcing business users into a BI tool they’ll barely use, data-mart-first architecture embraces the tool they already live in – the spreadsheet. Users pull governed data directly from data marts into Google Sheets or Excel, where they can pivot, chart, add formulas, and build the exact analysis they need.
This isn’t the same as exporting a CSV from a dashboard. The data stays connected – refreshable, governed, and traceable back to the data mart. The analyst controls the source; the business user controls the presentation. For marketing teams, this means automated reporting in Google Sheets without sacrificing data quality.
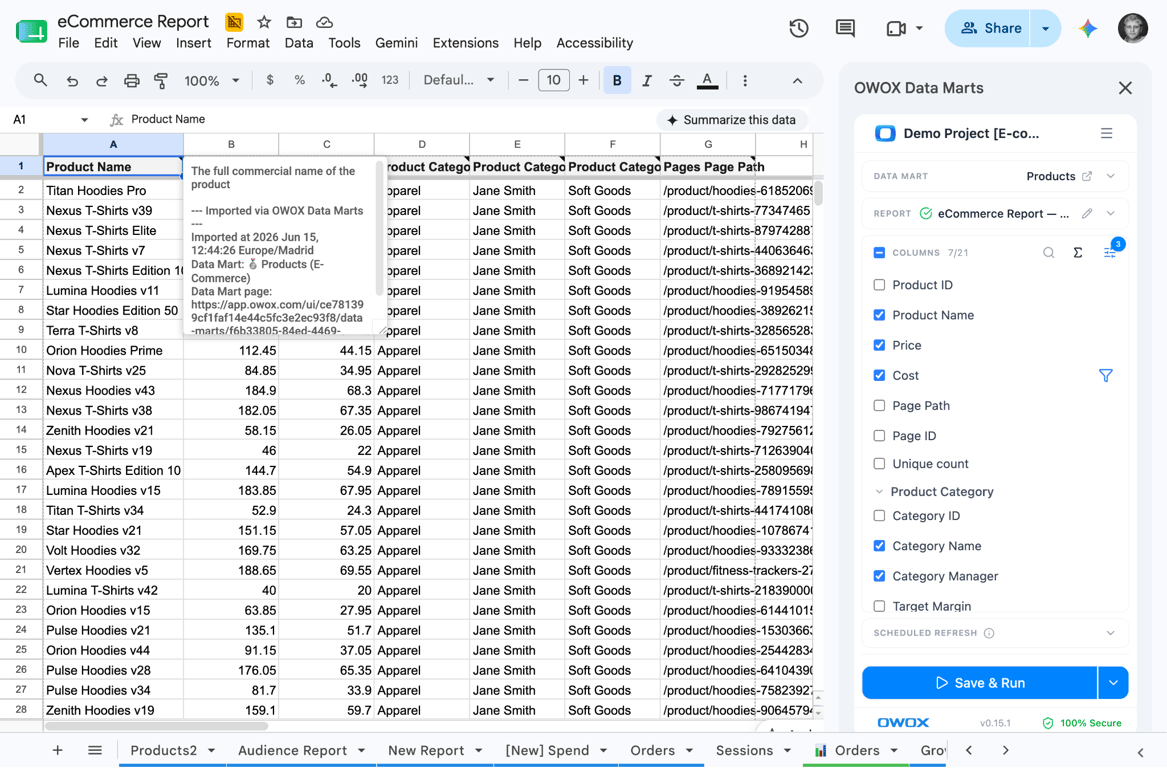
The difference matters. When a CMO asks “can we see this by channel and by week instead of by month?” – the marketer can do it themselves in the spreadsheet. No ticket, no waiting, no new dashboard.
AI grounded in trusted data marts
Here’s where data-mart-first architecture handles AI better than chatbot-first: when AI queries data marts instead of raw warehouse tables, it’s working with pre-validated, business-logic-enriched data. The metric definitions are baked in. The bad data is filtered out. The joins are correct.
This means AI-powered insights can actually be trusted – because they’re running against data that an analyst has already vetted, not against a raw schema that the LLM is interpreting on the fly. The hallucination problem largely goes away when the AI doesn’t have to guess what “revenue” means.
How the competitive landscape maps to these architectures
How the competitive landscape maps to these architectures
Every analytics tool implicitly picks an architecture. Understanding which one helps you evaluate whether a tool fits your team – or just adds another layer to the stack. Here’s how the major categories map.
dbt + BI tools (dashboard-first with better plumbing)
dbt transformed data modeling by making transformations version-controlled, testable, and modular. But dbt is a transformation layer, not a delivery layer. The typical dbt stack still ends in a BI tool – Looker, Tableau, or Power BI – which means you’re still dashboard-first.
The improvement: the data feeding those dashboards is better modeled and more trustworthy. The gap: business users still can’t do anything the dashboard designer didn’t anticipate. If you’re evaluating data transformation tools, dbt is excellent at what it does – but it doesn’t solve the last-mile delivery problem.
Cube, Looker semantic layer (semantic-first)
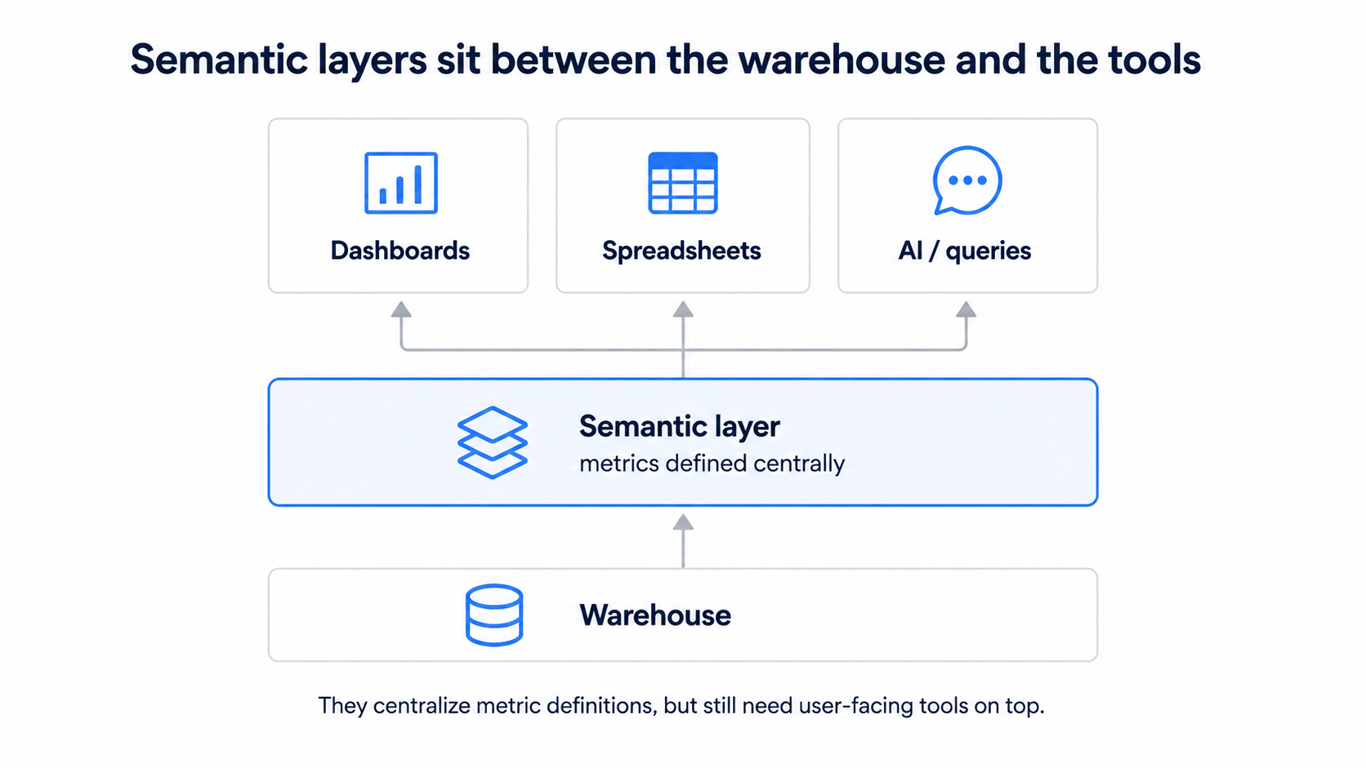
Semantic layers like Cube and Looker’s modeling layer define metrics centrally – revenue is calculated one way, everywhere. This solves the trust problem and gives AI a better foundation.
But semantic layers are infrastructure, not user-facing products. Someone still needs to build the dashboard or the query interface on top. And business users still can’t manipulate the output in the flexible way they get with spreadsheets. Semantic-first is a strong middle layer, but it’s not a complete architecture on its own.
Hex, Mode, Sigma (notebook/dashboard-first)
These tools blend code notebooks with dashboards – analysts write SQL or Python, build visualizations, and share interactive reports. They’re powerful for analyst-to-analyst collaboration and for presenting findings to stakeholders.
The strength: analysts love them because they can work in code and produce polished output. The limitation: the audience is still consuming a read-only artifact. When the VP of Marketing wants to tweak the analysis, they can’t – it’s a published notebook, not a malleable spreadsheet. For most business users, these tools are just better-looking dashboards.
Coefficient, Supermetrics (pipe vs library)
Spreadsheet connector tools like Coefficient and Supermetrics solve part of the problem – they pipe data into Google Sheets or Excel. Supermetrics focuses on marketing analytics data sources, pulling from ad platforms directly.
The difference from a data-mart-first approach is governance.
These tools are pipes, not libraries.
They move data from point A to point B, but they don’t enforce metric definitions, manage data freshness centrally, or provide a curated layer of validated datasets. Each user builds their own query, which means metric definitions can drift just as easily as with dashboard-first.
Decision framework: choosing your analytics architecture
Decision framework: choosing your analytics architecture
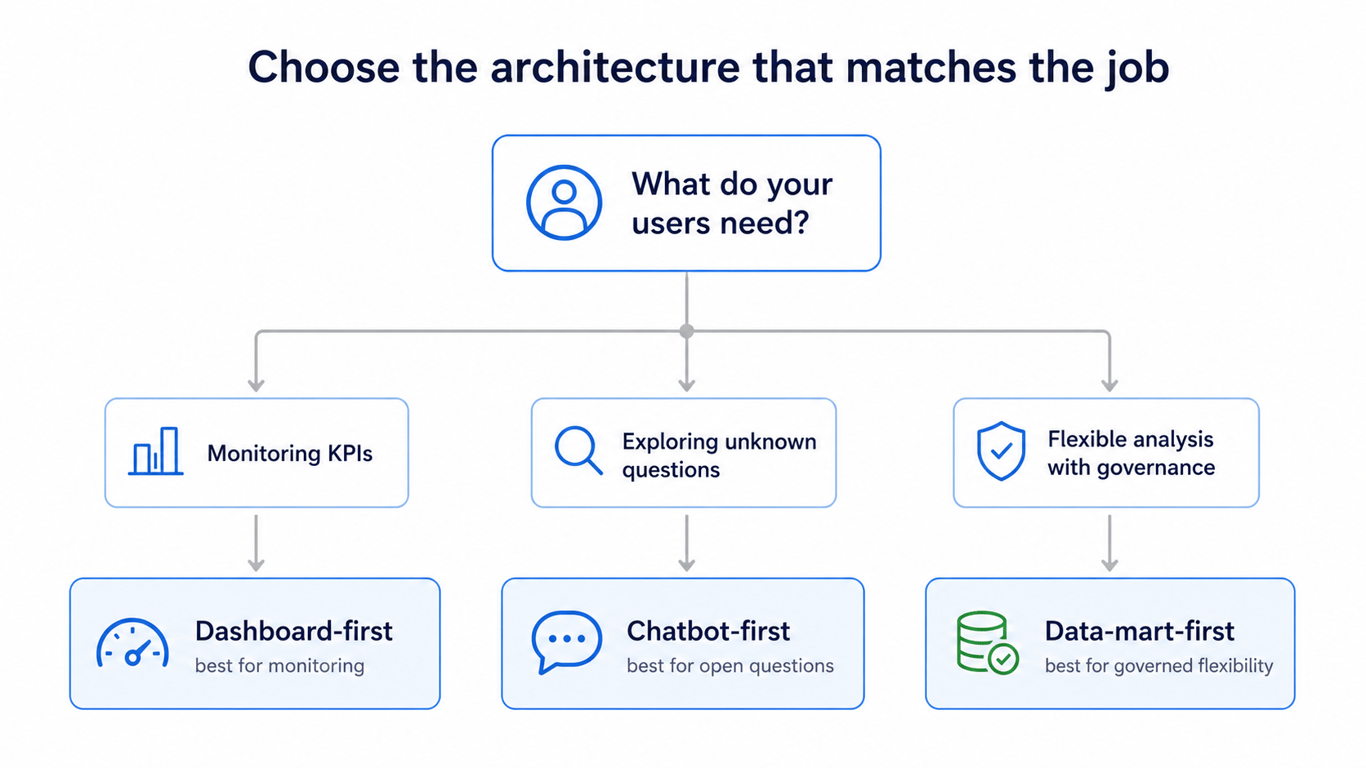
There is no universally correct answer – the right architecture depends on your team’s size, your users’ technical comfort, and the questions they need to answer. Here’s a framework for deciding.
When dashboard-first is the right choice
Choose dashboard-first when your primary use case is monitoring known KPIs – operational dashboards that track the same metrics every day. If your business users only need to glance at top-line numbers and your data team has the bandwidth to maintain the dashboards, this architecture works fine.
It also makes sense when you’re early-stage and have fewer than five regular report consumers. At that scale, dashboard sprawl isn’t a problem yet. Just know that it will become one.
Good dashboard-first tools include Looker (especially with its semantic layer), Tableau for complex visualizations, and Looker Studio for teams on Google Cloud.
When chatbot-first is the right choice
Choose chatbot-first when your users are data-literate enough to validate AI-generated answers – typically data teams doing exploratory analysis on their own data. It also works when you’ve already invested in a strong semantic layer that constrains what the AI can query.
If you’re considering this path, pair it with a governed data layer. A chatbot querying curated data marts is dramatically more reliable than one querying raw warehouse tables. The augmented analytics approach works best when the data underneath is already clean.
When data-mart-first is the right choice
Choose data-mart-first when your data team is drowning in ad-hoc requests and your business users need more than just reading dashboards. This architecture fits best when:
- You have analysts who can model data but are spending too much time building one-off reports
- Your business users are comfortable in spreadsheets and want to do their own analysis
- You need a governed layer but want flexibility in how data gets consumed
- You’re planning to add AI but want it grounded in trusted data, not raw schemas
This is the architecture that scales self-service for data teams without sacrificing governance. It’s also the one that turns your analysts from report-builders into data-product owners.
How OWOX implements data-mart-first analytics
How OWOX implements data-mart-first analytics
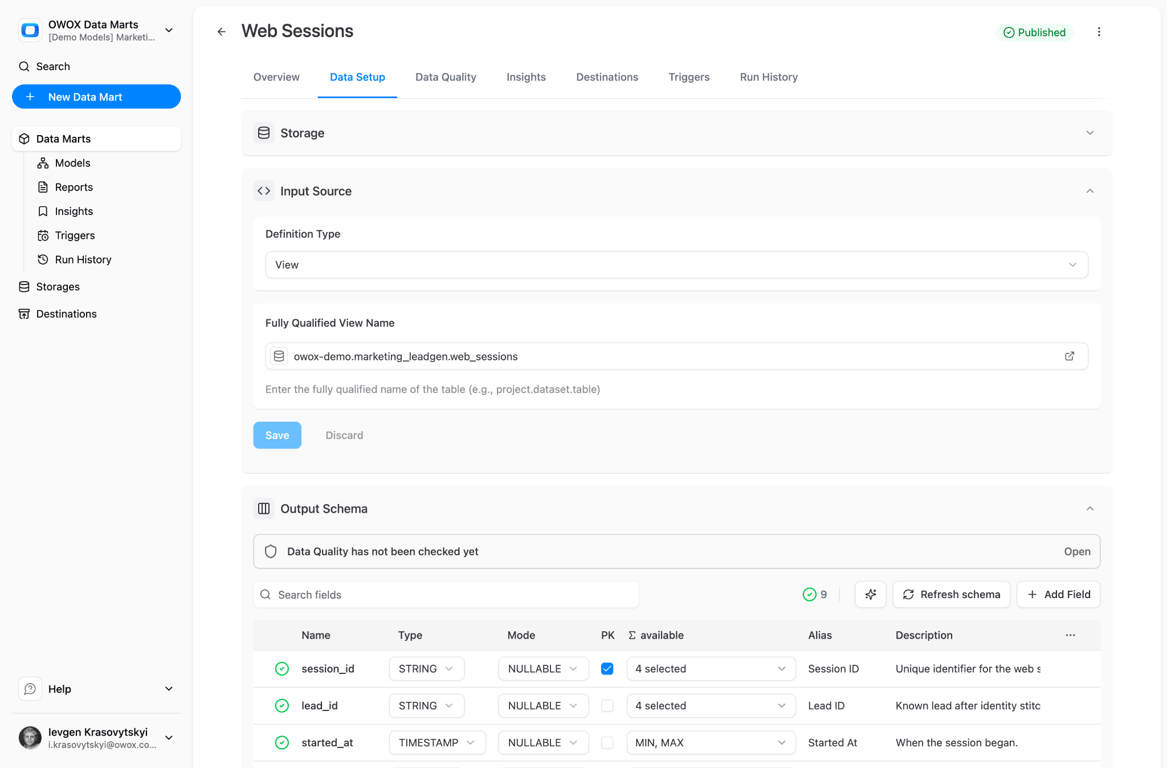
OWOX is built around the data-mart-first architecture. Instead of adding another dashboard layer or an ungrounded AI chatbot, it gives analysts the tools to model data marts and gives business users the ability to consume them in spreadsheets – with AI that stays honest because it queries governed data.
From data warehouse to spreadsheet in minutes
The workflow is straightforward:
- Connect your data warehouse – OWOX supports BigQuery, Snowflake, and other storage platforms as data sources
- Model your data marts – analysts use joined data marts to define metrics, set up joins, and apply business logic to the model.
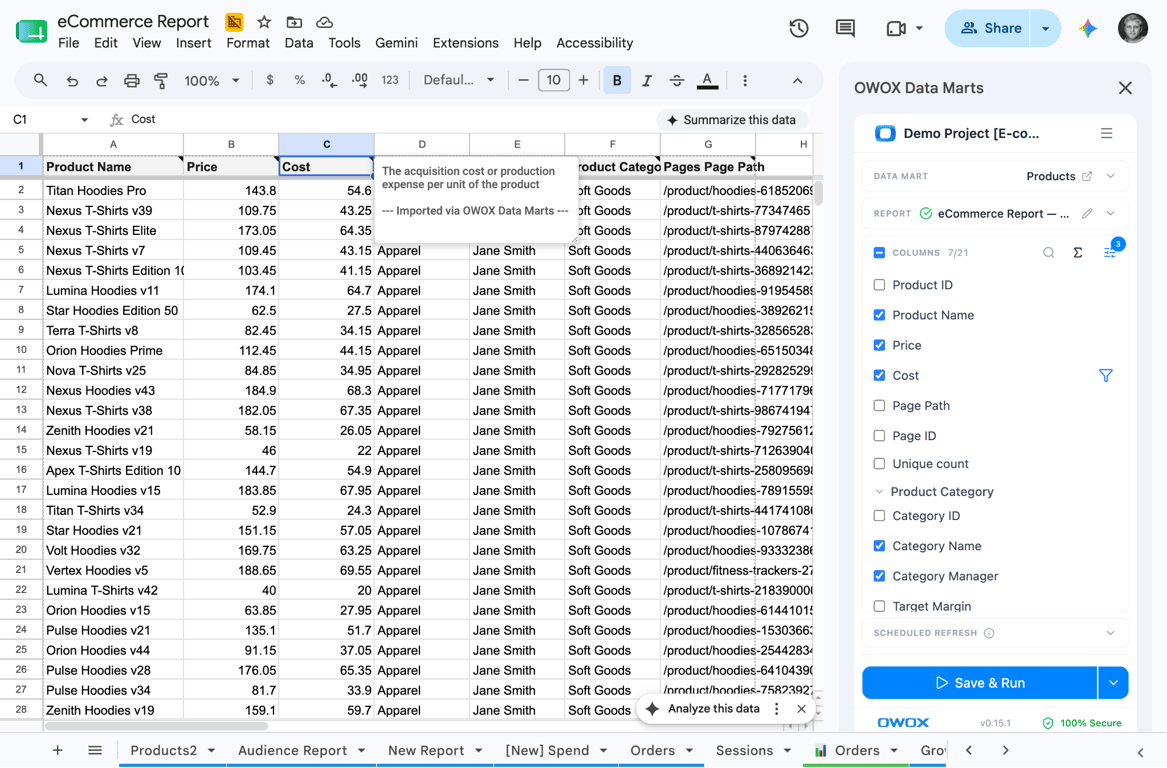
- Business users pull data – through spreadsheet reporting, users connect data marts to Google Sheets and refresh with a click
No exports, no CSVs, no broken formulas. The spreadsheet stays connected to the data mart, and the data mart stays governed by the analyst.
What makes it different
Three things separate OWOX from the pipe-to-spreadsheet tools:
Joinable data marts. You can join multiple data marts without writing SQL – combining marketing data with revenue data with product data in a single governed view. This is the library model: each data mart is a well-organized shelf, and users can pull from multiple shelves at once.
AI grounded in data marts. The AI insights layer queries data marts, not raw tables. It knows what “revenue” means because an analyst defined it – not because an LLM guessed from a column name.
Spreadsheet-native delivery. Instead of making business users learn a new tool, OWOX delivers data to the tool they already use every day. For a deeper comparison of this approach versus traditional BI, see the OWOX vs dashboards comparison.
Conclusion
The analytics architecture debate isn’t really about tools – it’s about where you put the intelligence layer between your warehouse and your business users.
Dashboard-first puts it in the BI tool, which works for monitoring but fails for flexible analysis. Chatbot-first puts it in the AI, which works for exploration but fails for trustworthy, repeatable answers. Data-mart-first puts it in the governed data layer, where analysts define metrics once and business users consume them however they want.
For teams that are tired of maintaining dashboard sprawl, fielding endless ad-hoc requests, or worrying about AI hallucinations – data-mart-first architecture is the path that actually delivers self-service analytics. Not as a marketing promise, but as a structural reality.
The winning architecture is the one where your analysts spend less time building reports and more time modeling data that the whole organization can trust. That’s what data-mart-first delivers.
Ready to see how it works? Start with OWOX Data Marts today or explore pricing to find the right fit for your team.
Turn your data into decisions.
Governed data marts give you the clean foundation ML needs to actually work.
- No AI hallucinations
- Analyst-governed definitions
- Every number traces to SQL