
Building a Unified Ad Report in Google Sheets with Free Connectors (No SaaS Needed)
Learn to unify ad performance data from Meta, LinkedIn, and more into Google Sheets using free, open-source connectors, no subscriptions needed.

Struggling to track ad performance across Facebook, LinkedIn, Twitter, and Bing without jumping between dashboards? If you’re tired of exporting CSVs or paying for pricey tools like Supermetrics, there’s a better way to unify your data, right inside Google Sheets.
.png)
This guide presumes you already aggregate ad metrics using free, open-source marketing API connectors into one place. Flow, design data transformations, create one combined report, and automate refreshing, with no need for writing a single line of code or using expensive tools! Much easier and cheaper to control reporting this way.
Why Marketing Teams Need Unified Ad Reporting
Examining ad performance, one platform at a time, only gives you part of the picture. When your data is unified, it’s much easier to see how channels work together and where they don’t. You might find, for instance, that LinkedIn is great for generating awareness, while Google Ads brings in the conversions.
Unified reporting also improves budget decisions. When all performance data is in one sheet, you can directly compare cost per acquisition and reallocate spend accordingly. Instead of guessing, marketers can optimize campaigns based on actual multi-platform performance and make smarter, data-informed decisions more quickly.
How Data Connectors Can Help Teams Create Unified Reports
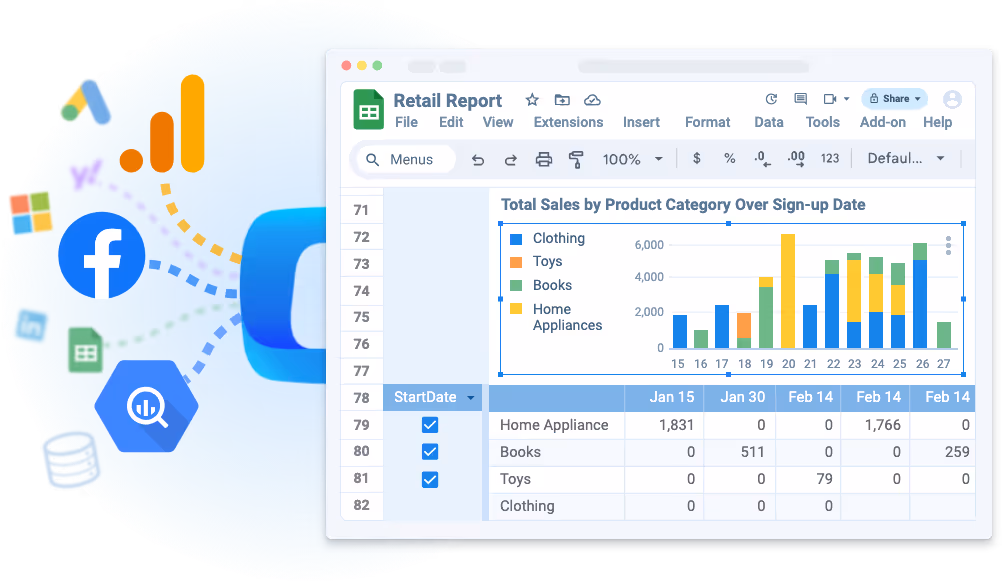
Ad campaign data typically resides in separate tools, such as Facebook, LinkedIn, TikTok, and Bing, among others. Pulling it all together manually can be tedious and prone to errors.
Data connectors handle the heavy lifting by automatically pulling data from each platform into one place, saving time and reducing the likelihood of errors.
Types of Marketing Data Connectors:
- Native connectors are built by companies that own both the tools being connected (such as Power BI and Azure). They’re seamless and stable, but rare in cross-platform marketing use cases.
- Built-in connectors are often user-friendly but typically come with limitations; they’re tied to vendor pricing plans and don’t offer the control you get with free, open-source connectors like those from OWOX, which run entirely in Google Sheets.
- Third-party connectors are developed by external companies, such as Supermetrics. They support many platforms, but can be expensive, and their reliability varies depending on the frequency of API changes.
- Open-source API connectors give you full control and are completely free. You host and run them yourself, making them ideal for marketers who want transparency without SaaS fees.
- Custom connectors are scripts or applications developed in-house or by agencies to meet specific data integration needs using APIs.
How to Use OWOX’s Free Connectors to Import Ad Data into Google Sheets
OWOX offers free, open-source connectors that let you pull ad performance data directly into Google Sheets. No subscriptions, no hidden limits, just clean data. Here’s how to set up each connector and start building unified reports.
Connect Facebook Ads to Google Sheets Using OWOX
OWOX’s Facebook Ads to Google Sheets connector allows you to pull campaign performance data directly into Google Sheets using a free, open-source template. The process involves copying the template, entering your ad account ID, selecting metrics, and generating an access token from Meta for Developers.

With minimal setup, you can automate daily imports and build a live dashboard to track spend, impressions, clicks, and conversions across multiple Facebook ad accounts.
The connector supports custom field selection, scheduling, and multiple account IDs, offering a powerful alternative to CSV exports or paid integrations, fully within the Google Sheets environment.
💡Want a full visual guide with the whole detailed Setup Instructions?
Check out our detailed article: How to Connect Facebook Ads to Google Sheets Using OWOX.

Import LinkedIn Ads Data with OWOX’s Free Connector
The OWOX LinkedIn Ads connector to Google Sheets helps you centralize campaign data without the need for manual downloads. After copying the provided template, you’ll configure your ad account URNs, define the start date, and select the necessary metrics and breakdowns.
To authorize the connection, you’ll create a LinkedIn developer app, verify your business, and generate a token with proper API scopes. Once credentials are added, you can schedule automated imports and track performance across campaigns.

This solution gives full control over your LinkedIn data with no recurring costs, making it ideal for marketers who want clarity, flexibility, and zero vendor lock-in.
💡For a comprehensive visual guide and detailed setup instructions, please refer to the complete documentation. Check out our detailed article: How to Connect LinkedIn Ads to Google Sheets Using OWOX.

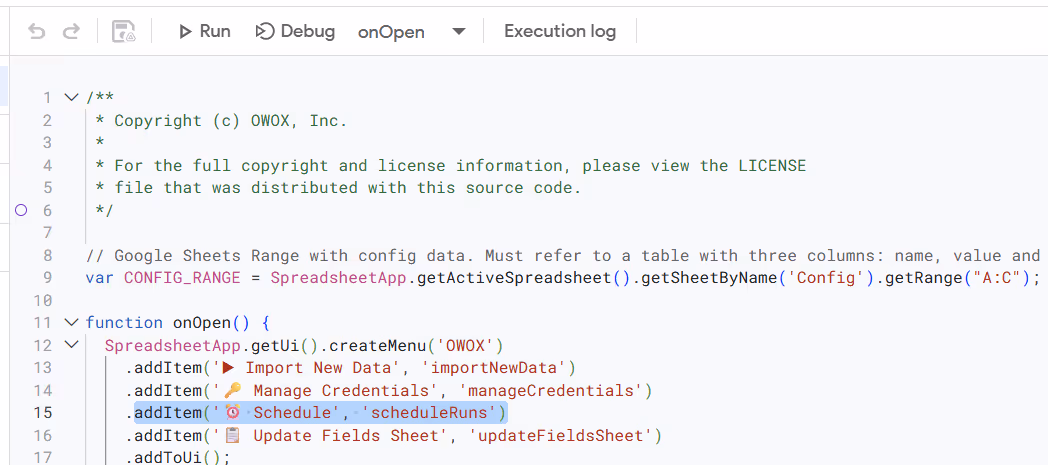
Send X Ads (Twitter Ads) Data to Sheets Without Paid Tools
With OWOX’s free X Ads (formerly Twitter Ads) connector for Google Sheets, you can bring your ad data directly into Google Sheets without relying on paid tools. The setup includes copying the pre-built template, configuring start dates and account IDs, and generating four required credentials through the X Developer Portal using OAuth 1.0.
Though the credential process involves multiple steps, it grants you full API access. Once connected, the template pulls structured data into categorized tabs, such as accounts and campaigns.

This approach eliminates the need for CSV exports and provides a cost-free, automated method to track Twitter ad performance using only Google Sheets and Apps Script.
💡To see a full visual guide and how to set things up, click the link below. Check out our detailed article: How to Connect X (Twitter) Ads to Google Sheets Using OWOX.

Connect Microsoft Ads to Google Sheets with OWOX Connector
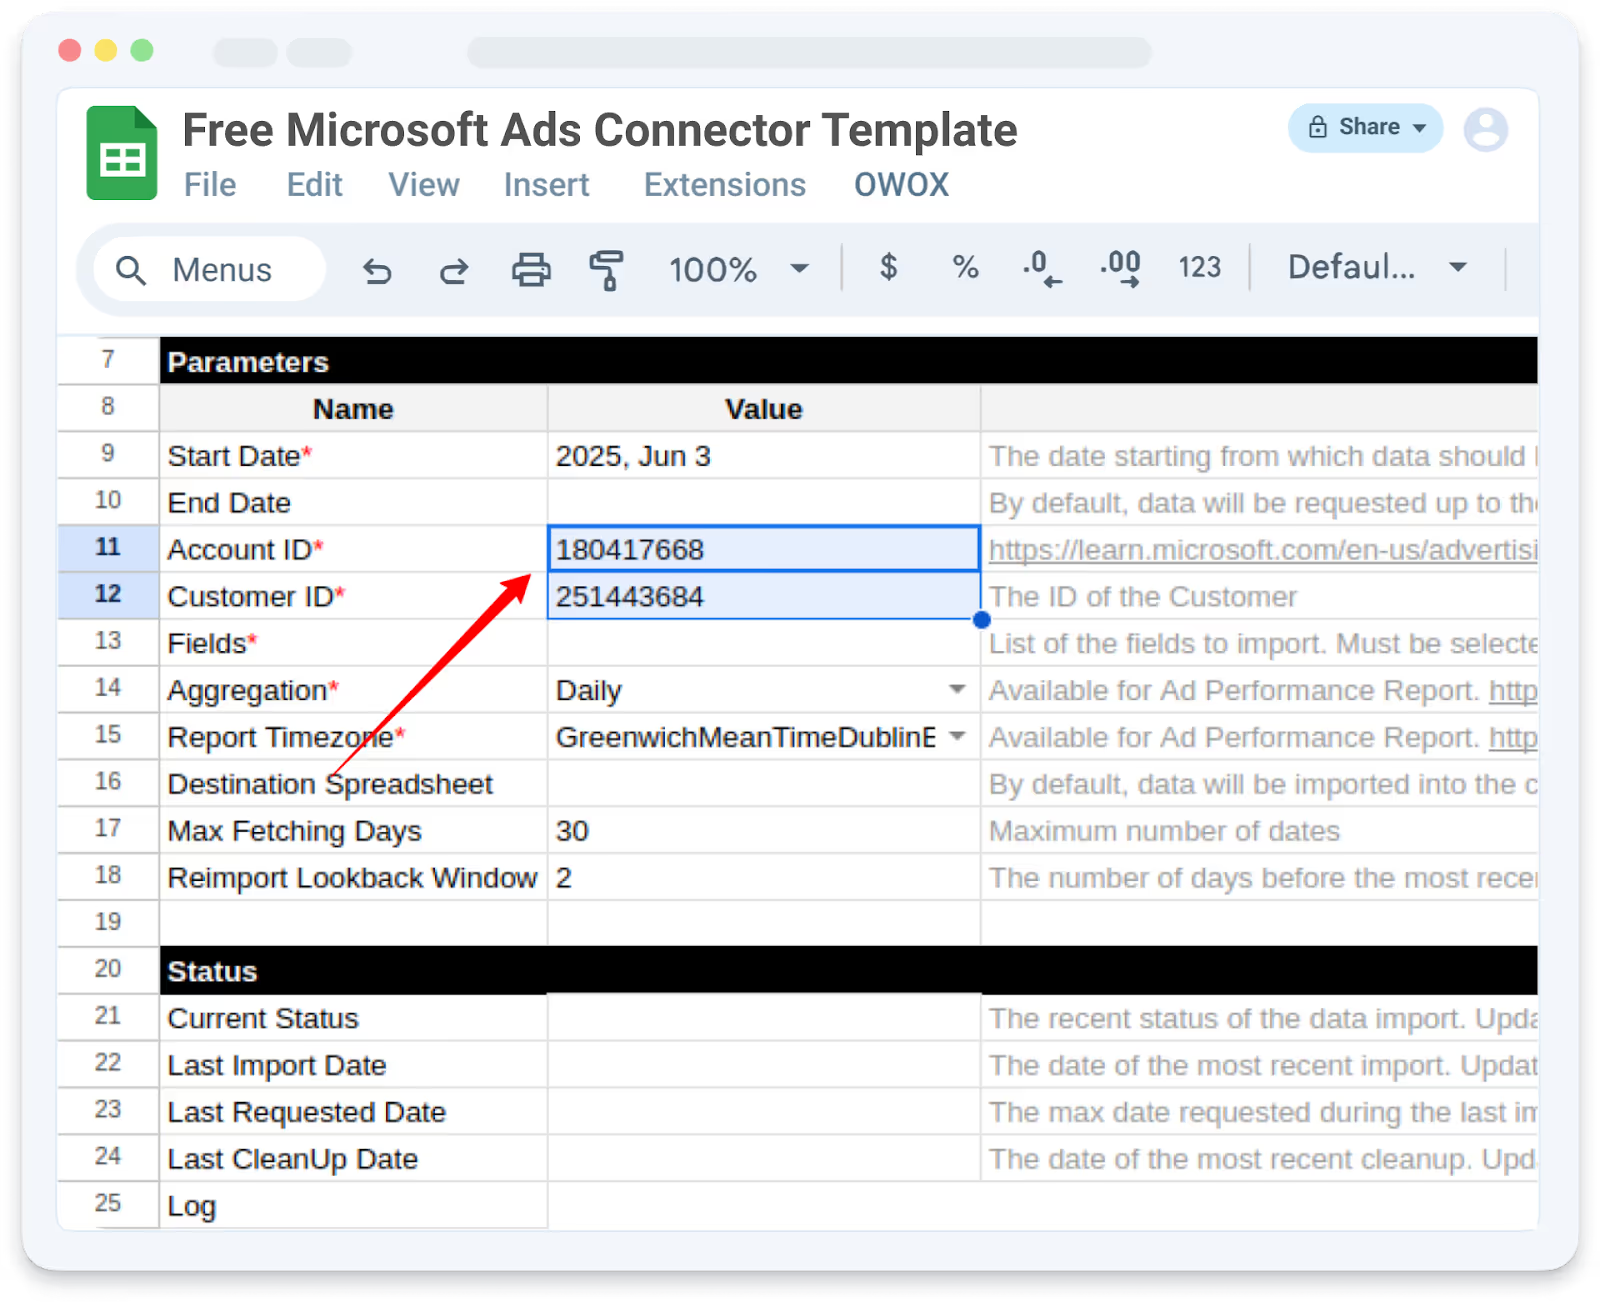
The Microsoft Ads connector from OWOX for Google Sheets makes reporting effortless by importing your ad data directly into spreadsheets. After duplicating the template, you’ll configure your start date, account/customer IDs, timezone, and metrics. To authorize access, you must register an app in Microsoft Azure, generate a client secret, and request an Ads API refresh token.
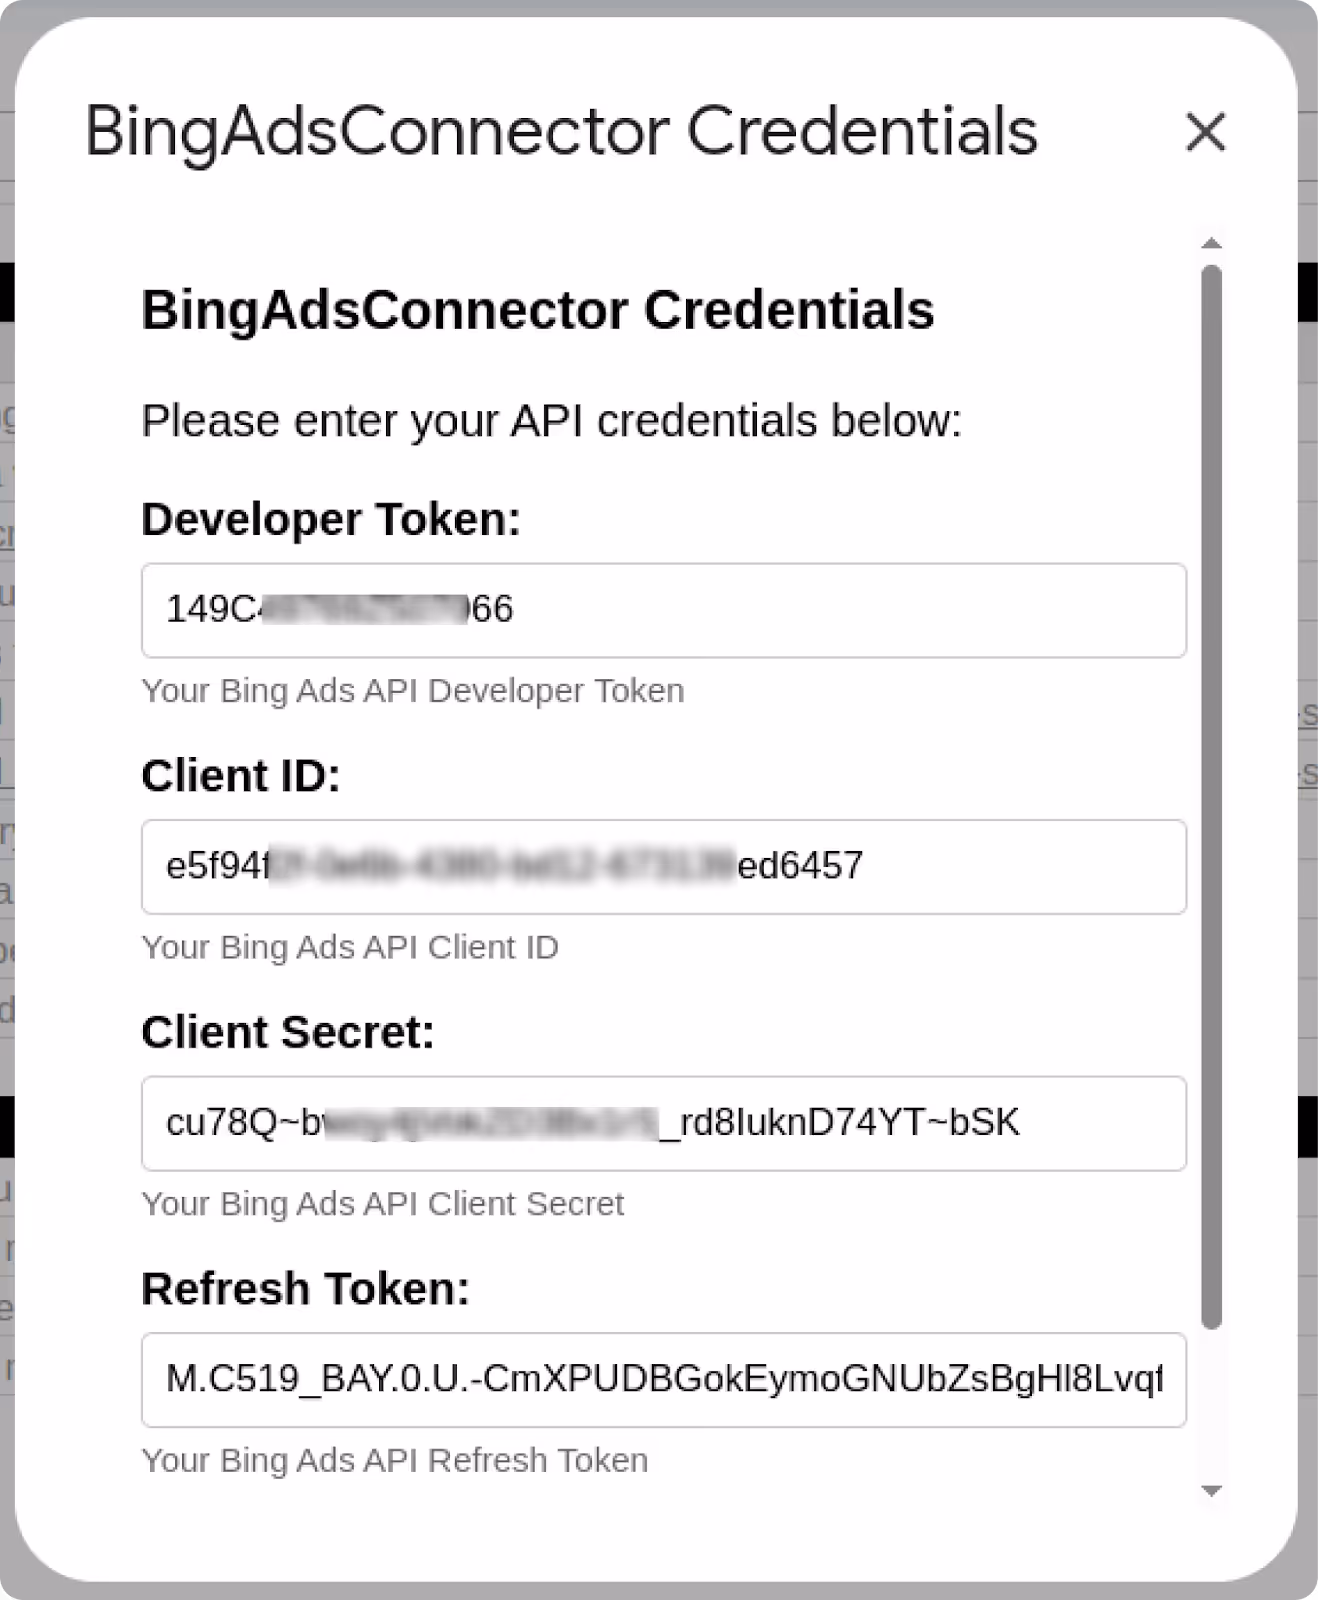
Although setup requires several credentials, it’s a one-time effort that unlocks secure, ongoing access. Once saved in the sheet, you can automate daily imports to update tabs with impressions, spend, and other relevant data. The result is a powerful, no-code solution for managing Microsoft Ads data on your terms.
💡 Curious how it all comes together, step by step, with visuals?
Dive into the full setup guide: Free Microsoft Ads to Google Sheets Connector.

How Do You Combine Ad Data from Multiple Platforms in Google Sheets?
After importing data from platforms such as Facebook, LinkedIn, and Microsoft Ads, the next step is to unify it for analysis. Combining this data helps you track performance across channels in one place.
Use a Template to Combine Multi-Channel Ad Data
Start with a pre-built Google Sheets template that brings data from Facebook, LinkedIn, Twitter (X), and Microsoft Ads into a consistent format. These templates help you map platform-specific fields into a unified structure for easier analysis and comparison.
Once your connectors are set up, combine the data from individual templates into a new Google Sheet document for security purposes.
This is a critical step for data security and integrity when consolidating advertising data from multiple template sheets for team reporting. This ensures that team members only have access to the consolidated report, preventing unauthorized access to the original template documents where the raw data is loaded.
Within this new document, dedicate a separate tab for each ad source (e.g., "Google Ads," "Facebook Ads") to maintain organization and simplify analysis. Sharing this centralized and secure view empowers your team with streamlined cross-platform reporting, fostering a unified understanding of advertising performance and facilitating more informed decision-making.
OWOX offers a ready-to-use template for each platform that eliminates the need to build reporting logic from scratch. It includes tabs for raw data, normalized views, and summary dashboards, giving you a head start toward cross-platform performance reporting in minutes.
Clean and Normalize Imported Ad Metrics for Analysis
To ensure accurate analysis, clean and standardize the data after importing. Align field names (e.g., “Ad Spend” vs. “Amount Spent”), date formats, and campaign naming conventions across platforms.
Use functions like ARRAYFORMULA to apply logic across ranges, SPLIT to separate values, and REGEX functions to strip extra characters or match patterns. Normalizing your data makes pivot tables and comparisons more reliable, reducing confusion when comparing metrics across ad sources.
Join Campaign Data Across Platforms Using Functions
Once your data is cleaned using OWOX’s connector templates in Google Sheets, apply formulas like VLOOKUP, QUERY, or INDEX-MATCH to blend campaign-level metrics across tabs, using shared keys such as campaign names or dates. Match on shared keys such as campaign names, dates, or regions. This enables you to calculate blended performance metrics, such as total spend or conversions per campaign, across multiple channels.
Automate Data Refreshes with Apps Script or Scheduled Triggers
Manual updates slow down reporting. Instead, automate your ad data refreshes using Google Apps Script or Sheets’ built-in time-based triggers.
You can schedule daily or hourly data pulls using the OWOX connectors, ensuring your reports are always up-to-date without the need for copy-pasting or exporting. Automating this step provides real-time insights for faster decision-making and helps teams stay aligned with the latest campaign performance.
Real-Life Example for Unified Ad Reporting in Google Sheets
Imagine you're a digital marketing analyst at a mid-sized e-commerce company running campaigns across Facebook, LinkedIn, Twitter (X), and Microsoft Ads. Your goal is to track performance, such as impressions, clicks, spend, and conversions, from all platforms in one place, to understand which channels drive the best return on ad spend (ROAS).
Instead of manually exporting CSVs from each platform every week and copy-pasting them into different sheets, you use OWOX’s free connectors. These pre-built Google Sheets templates pull data from each platform and normalize the field names (e.g., "spend" vs. "cost" vs. "amount_spent") into a consistent structure.
You set up separate tabs for each ad platform and a summary tab that automatically aggregates key metrics using formulas and pivot tables. With Apps Script triggers, your dashboards refresh daily, saving hours of manual work and reducing errors.
You can now share a unified report with your team, filter by platform or campaign, and make faster decisions, such as shifting budgets to high-performing ads or pausing underperforming ones.
Connectors vs. Paid SaaS for Marketing Data Integration
When building a unified reporting system in Google Sheets, marketers can avoid SaaS subscriptions altogether by using free, open-source connectors like OWOX. These give you full control and flexibility with no recurring cost.
Total Cost of Ownership: Free Code vs. Recurring Fees
Paid SaaS tools often charge based on data volume, the number of sources, or user seats, resulting in recurring monthly or annual costs that increase over time.
In contrast, open-source or script-based connectors have no licensing fees; your primary investment is in the initial setup and occasional maintenance. For teams comfortable managing scripts, the long-term savings can be significant.
Control & Transparency: Open Code Beats Black-Box Logic
Open-source API connectors give you full visibility into how data is fetched, transformed, and loaded. Unlike proprietary tools, you can inspect every line of code and understand exactly how metrics are calculated.
With open code, there’s no hidden logic or guesswork; teams can audit integrations, fix issues, and customize connectors confidently. This transparency builds trust in your data and ensures your reporting workflow remains robust, secure, and easy to maintain over time.
Customization & Flexibility: Tailor Connectors to Any Stack
Open-source connectors offer unmatched flexibility, enabling teams to tailor data flows to their specific stack. You can select specific fields, adjust data formats, or apply custom transformations, all within your connector code.
This level of control enables you to integrate niche platforms, add custom metadata, or adapt to internal data schemas. Whether you're using Google Sheets, a data warehouse, or a BI tool, open-source connectors let you build exactly what you need, without waiting on a vendor or paying extra for advanced features.
Vendor Lock-In & Portability: Future-Proof Your Pipeline
Relying on SaaS connectors often ties you to a specific vendor’s platform and pricing model. If the vendor changes access, pricing, or product direction, you may lose flexibility or face increased costs.
With free, open-source connectors, you own your data integration pipeline, the code lives in your environment, and you can migrate it anywhere. This helps ensure that as APIs, tools, and teams evolve, your reporting stack remains adaptable and under your control.
The table below outlines how OWOX compares to other popular marketing data integration tools in terms of cost, flexibility, and long-term value:
Comparison of OWOX with Other Marketing Data Integration Tools:
Best Practices for Maintaining Your Unified Ad Report
Once your ad report is set up, maintaining its accuracy and reliability requires some ongoing upkeep. The practices below can help you keep everything up to date, clean, and ready when needed.
Schedule Regular Data Updates and Backups
Automate your data refreshes by using Google Apps Script triggers. This way, reports will always stay current without you or anyone else having to update them. Set the schedule to run daily, or even every hour, depending on how often you need the latest ad data to be pulled into your unified sheet.
To set up time-based triggers that would create regular backups of your Google Sheets to a specific folder in Google Drive dedicated to this, to avoid data loss in case something breaks, or the data is changed inadvertently.
Monitor API Quotas and Script Limits
The frequency at which you can import data depends on the daily quotas and execution limits set by Google Apps Script. Due to these restrictions, it’s advisable to reduce the frequency of data refreshes and optimize your scripts for efficiency.
This means batching operations whenever possible and minimizing the number of API calls. You can also improve reliability by using caching, setting up more intelligent trigger schedules, and implementing proper error handling to prevent interruptions.
Validate and Reconcile Data Frequently
Continue to monitor your imported data to ensure it’s accurate and complete. These can be simple checks, such as row counts or totals, or even some conditional formatting, that will help you catch issues well ahead of time.
If you're working in Google Sheets, this can prevent errors due to related data, especially in shared files. It’s also good to reconcile data regularly. That means if an API changes or if one of the fields you have changes its spelling, your reports won’t break in silence.
Maintain Clear Field Mapping and Documentation
Consistent field names across platforms make your reports easier to read, join, and analyze. Clearly label columns like “Campaign Name,” “Spend,” or “CTR,” and apply the same structure across all source tabs.
Document any formulas, transformations, or lookup logic used; this helps collaborators troubleshoot issues and ensures long-term maintainability of your unified ad report.
Build a Unified Marketing Report in Google Sheets with OWOX Connectors
You don’t need pricey SaaS tools to pull together a unified marketing report. A solid set of connectors, a clean Google Sheets setup, and a few minutes of configuration are often all it takes. With OWOX’s free, open-source tools, you can:
- Connect different ad platforms to Google Sheets
- Automate daily data imports, no complex coding required
- Build a cross-channel report that’s fully customizable and cost-free
Start with OWOX’s open-source connectors on GitHub and take full control of your marketing data integration, no subscriptions, no lock-in.
Frequently asked questions
.png)


Finally, a tool that doesn't ask business users to learn a new dashboarding UI. Our marketing team already knows Sheets. OWOX just delivers the right data.
Joinable data marts concept was the thing that sold us. We can now use the semantic layer without building one.
Self-hosted the OSS version on Digital Ocean. Zero vendor lock-in. Contributed a Shopify connector back in week two.