
10 Essential Facebook Ads Report Templates in 2025
Explore the top 5 Facebook ads report templates that will boost your reporting and optimize ad spend. Learn how to choose the best tool for reporting


If you’re running Facebook Ads for your advertising campaigns, you understand how important it is to keep an eye on your ad performance and to integrate tools like Google Analytics 4 and a Facebook ad reporting template.

Just as Google Ads uses Looker Studio for analytics, Facebook Ads offers its toolbox for Facebook ads tracking. And rather than taking the long route of manually crafting reports and charts, there’s an easier way: you can use pre-designed templates built explicitly for Facebook Ads.
Just link them up with your Meta Ads data and relevant Facebook ads metrics, and it’s ready in just a few clicks! Formerly Google Data Studio, Looker Studio integrates data from various platforms to create cohesive reports.
In this article, we’ll be your guide, showing the most important Facebook Ads templates for reports. Whether scaling a new product or running seasonal promotions, having a structured Facebook Ads campaign ensures your reports reflect real business outcomes.
Why Facebook Ads Reporting Is Crucial for Campaign Success
When launching a Facebook advertising campaign, you invest time, money, and creativity in the perfect ad creatives, targeting a specific audience, and setting your campaign in motion. But the problem is that without effective Facebook Ads reporting, you’re essentially navigating in the dark.

Effective Facebook Ads reporting is a great way to track your campaign’s performance, as it holds you and your team accountable for the results.
Reports allow you to identify what’s working and what’s not. The Facebook ads targeting capabilities are precise, and with continuous analysis, you can modify messages to your audience and improve ad creatives for maximum impact.
Important performance metrics, such as click-through rates and conversions, are essential for understanding ad performance and optimizing future campaigns to achieve better results. Tracking how your Facebook Ads convert can also reveal whether your creative and messaging align with the audience's intent and expectations.
Demographic data plays a crucial role in understanding audience characteristics such as gender, location, and age, allowing agencies to tailor their strategies effectively and enhance the campaign’s reach and impact.
Also, reporting will provide you with real-time data, showing which ads drive immediate results and which might need to be changed or stopped.

And finally, this will help you stay ahead of the competition. Regular Facebook Ads reporting keeps you informed about emerging trends, enabling you to adapt your strategies promptly in the ever-evolving landscape of digital advertising.
Now, let's take a look at 10 Facebook ads report templates that will help to achieve more success.
Top 10 Free Facebook Ads Report Templates
There are various types of Facebook Ads report templates available, catering to different business needs and marketing objectives. These templates often organize ad sets to showcase metrics such as clicks, impressions, and costs associated with each set.
These include templates for campaign performance, ad spend, conversion rates, and ROAS, as well as templates for specific industries, such as e-commerce, lead generation, and brand awareness. Marketers can choose from pre-made templates or create custom templates to suit their unique requirements.
Some popular types of Facebook Ads report templates include campaign overview templates, ad performance templates, audience insights templates, and ROI analysis templates.
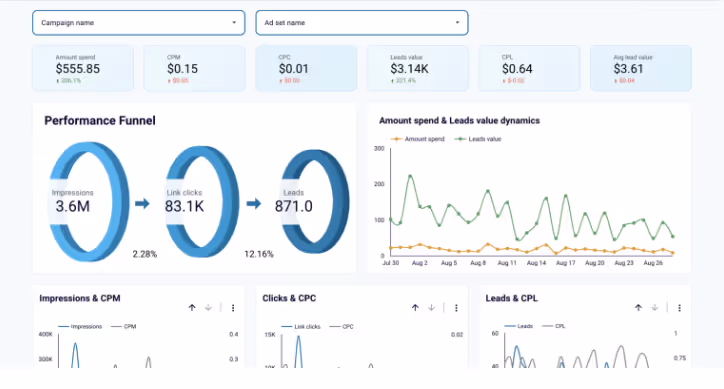
Template #1: Facebook Ads Performance Report Template by OWOX BI

The Facebook Ads Performance Report is a dashboard by OWOX BI that helps you understand how well your campaigns are doing. It keeps track of important data, such as how many people have seen your ads, how many likes your ads have gathered, and how many clicks you have.
But it's not just about numbers; Facebook Ads Performance Report is a tool to help you reach your business goals. If your ads aren't getting many clicks, it might be time to change your ad content or try targeting a different group of people. On the flip side, if your ads are getting clicks but it's costing a lot to get people to take action, you might need to adjust where your ads are shown or how much you're willing to spend.
Purpose
Help understand how well each Facebook ad campaign is doing.
Key Metrics
- Impressions: Measures how often your ad is seen on Facebook.
- CTR (Click-Through Rate): The percentage of users who click your ad.
- CPC (Cost Per Click): Average cost for each ad click.
- Conversion Rate: The percentage of users taking a desired action after clicking.
- ROAS: Measures revenue generated per advertising dollar, providing a clear picture of the financial return from your campaigns.
- Total Spend: The total cost of your Facebook advertising campaigns.
- Ad Data: Analyzing ad data provides insights into key performance indicators (KPIs) such as amount spent, impressions, and conversions. This allows marketers to assess campaign effectiveness and make data-driven decisions.
Key Features and Benefits
- Performance evaluation: Provides a quick snapshot of your campaign's effectiveness.
- Data visualization: Makes complex data easily understandable through visual elements.
- Audience insights: Offers demographic and behavioral information to improve targeting.
- Cost efficiency: Helps optimize budget allocation.
- Conversion tracking: Measures the effectiveness of ads in driving desired actions.
- Real-time adjustments: Allows for quick campaign optimization.
- Historical performance: Monitors trends and seasonality over time.
- Multi-channel integration: Provides a view by merging data from various advertising channels.
Template #2: CMO Report for Facebook Ads By OWOX BI

CMO Report for Facebook Ads is a structured dashboard included in an all-in-one performance CMO dashboard, showing the omnichannel performance and impact of Facebook advertising campaigns. It is especially useful for C-level managers or senior marketing professionals as it provides key insights and high-level information.
This report by OWOX BI has:
1) A concise summary of the most critical findings and KPIs;
2) Valuable details about the advertising campaigns, including objectives, target audience, ad budget, and timeline;
3) Historical data and trends to understand how campaigns have evolved;
4) Insightful suggestions for optimizing ad campaigns, improving ad creativity, targeting strategies, etc.
Purpose
Provide a top-level view of ad performance for the Chief Marketing Officer.

Transform your marketing efforts with OWOX BI's CMO Dashboard for instant KPI tracking. Get It Free!
Download Now
Key Metrics
- ROAS, Conversion Rate, CTR (see the details on these metrics in the Template #1 section above).
- CPA (Cost Per Acquisition): The average cost to get a new customer or achieve a specific goal, like a sale or sign-up.
- Ad Spend: This shows how much money you’ve used for your Facebook ads, including the budget, creating the ads, and extra costs.
- Engagement Rate: Includes likes, shares, comments, and other interactions with your ad. It tells you how much people like your ad.
- Total Revenue: Money made from the ads.
- Key Performance Indicators (KPIs): Essential metrics to effectively evaluate the present data which summarizes client campaigns and tracks essential metrics from Facebook Ads accounts provide insights into campaign effectiveness and ROI.
Key Features and Benefits
- Executive summary: An overview of campaign performance for quick insights.
- Campaign details: Information about ad campaigns, objectives, and targeting.
- Audience insights: Demographic and behavioral data about the ad audience.
- Performance trends: Historical data to spot long-term patterns.
- Competitor analysis: Comparison of ad performance against competitors.
- Budget allocation: Information for optimizing advertising budget.
- ROI analysis: Evaluation of ad revenue compared to advertising budget.
- Recommendations: Suggestions for ad campaign improvements.
- Multi-channel overview: Combining data from other advertising channels for a complete view.
Template #3: Facebook and Instagram Ads Campaign Performance Report Template by OWOX BI

Facebook and Instagram advertising performance dashboard by OWOX BI helps businesses and marketers track how well their ads are doing on these platforms. This template gathers important data about ad performance and displays it in an easy-to-understand way, so advertisers can see what's working and what's not.
Purpose
Bring together data from both platforms for analysis and campaign improvement.
This template collects and visualizes various key performance metrics:
Key Metrics
Engagement metrics:
- Likes, shares, comments
- Click-through rates (CTR)
- Conversion rates
Impressions and reach:
- Total impressions
- Reach
- Frequency (average number of times an ad is seen)
Click metrics:
- Total clicks
- Click-through rate (CTR)
- Cost per click (CPC)
Conversion metrics:
- Conversion rate
- Cost per conversion (how much it costs to achieve a specific goal, such as making a sale or acquiring a lead)
- ROAS
Ad position and ranking:
- Ad placement
- Ad position in the feed
- Ad relevance score
Tracking ad placements and creative formats is crucial for understanding which combinations yield the best performance, helping advertisers refine their strategies for better results.
Native Facebook ads benefit from specific reporting templates designed for Facebook Ads, simplifying performance tracking and enabling marketing agencies to communicate results effectively to clients.
- Ad placement
- Ad position in the feed
- Ad relevance score
Audience demographics:
- Age and gender of the audience
- Location and language
- Device and platform breakdown
Content performance:
- Best-performing ad creatives
- Video views and completion rates
- Ad format effectiveness
Key Metrics:
- Integration of data from Meta Ads with other platforms like Google Ads for comprehensive performance analysis
- Monitoring impressions, clicks, and engagement to optimize ad creatives and budget allocation across campaigns

Analyze the core KPIs of your Facebook and Instagram campaigns in one dashboard
Key Features and Benefits
- Daily performance tracking: Monitoring how ad campaigns perform daily to track engagement and trends over time.
- Top performing campaigns: Identifying which ad campaigns are delivering the best results.
- Click Analysis: Providing data on the number of clicks ads receive, helping advertisers understand which content gets more responses.
- Budget management: Tracking ad campaign spending to ensure it stays within budget.
- Cost-efficiency insights: Helping users identify which campaigns drive results at a lower cost.
- Customization: Allowing users to change the dashboard to their specific needs and preferences.
- Data visualization: Presenting data through charts, graphs, and visual elements for easy analysis. An effective Facebook Ads report template should offer customization options, be user-friendly, and provide data visualization features.
- Historical data: Storing and displaying data over time for trend analysis and decision-making.
- Integration: Connecting with Facebook and Instagram Ads accounts for real-time data.
- Export and sharing: Allowing users to export data and share reports with team members or stakeholders.
Template #4: Facebook Ads Audience Insights Report Template

The Facebook Insights Audience report provides a detailed look at the users who liked the tracked Facebook page. This report allows you to see information about the age, gender, origin, and language preferences of your page's fans.
Note that Facebook creates insight metrics, including age, gender, and location, only when a page has gathered at least 100 likes. Once your page reaches this milestone, you can access this demographic data to deepen your knowledge about your audience.

Purpose
Provide important details about the people engaging with your ads.
Key Metrics
- Audience reach: Measures the total number of unique users who have seen your ads, giving you a glimpse of your campaign’s exposure and potential reach. Understanding page performance is crucial for analyzing social media engagement metrics to optimize advertising strategies.
- Audience engagement (likes, comments, shares): Show how actively your audience interacts with your ads.
- Demographic data (age, gender, location): Provide information about the age groups, gender distribution, and geographical locations of the users engaging with your ads, allowing you to tailor your targeting. For example, schedule your ads to appear when your target demographic is most active on the platform, adjust the language and tone of your ad copy, etc.
- Interests and behaviors: Reveals the interests, preferences, and online behaviors of your audience, helping you understand what topics or activities resonate with your target demographic.
- Top-performing audiences: Identifies which specific audience segments or demographics respond most positively to your ads. This helps refine your targeting strategies and focus on the most responsive groups.
- Detailed insights: Provides in-depth advertising performance analysis, particularly for Facebook and Instagram ads. Using templates that compile essential metrics and present them in an easily digestible format, these insights help agencies optimize their campaigns and achieve better client results.

Key Features and Benefits
- High relevance: Targeting direct ads to the most interested audience, increasing engagement and metrics by changing content according to the audience's needs.
- Cost efficiency: Reduces costs and optimizes return on investment.
- Higher CTR: Results in more clicks from genuinely interested viewers.
- Improved conversions: Leads to better conversion rates as content directly addresses the audience's needs.
- Improved ROI: Increases return on investment, making campaigns more profitable.
- Data-driven insights: Provides data to refine ad strategy based on audience behavior continually.
Template #5: Facebook Ads Ad Spend and Budget Report Template by Catchr

This Facebook Ads Ad Spend and Budget Report Template shows exactly where your advertising budget is going and how much you spend on ad campaigns. Connecting directly to your Facebook Ads account enables real-time spending visibility across each campaign and objective.
If you see that one ad campaign is costing a lot but not bringing in many customers, you might decide to shift more of your budget to a campaign that's performing better.
Purpose
Show where the advertising budget is going and help manage spending.
Key Metrics
- Daily ad spend: This shows the amount of money spent on your ad campaigns daily, providing a detailed view of your daily advertising expenses.
- Daily/weekly/monthly budget allocation: Demonstrates how your advertising budget is distributed across various periods.
- Remaining budget: Displays how much of your budget is left to spend, allowing you to manage your spending effectively and avoid overspending.
- Cost Per Conversion (see the details on this metric in the Template #3 section above).
- Estimated Reach: Estimates the potential audience size your ad campaigns can reach.
- Spend by objective and Revenue by objective: Breaks down your spend/revenue based on campaign goals (conversion, page views, etc.). The total spend should be monitored and compared to other KPIs for insight into campaign effectiveness.
- Cost metrics: Incorporating cost metrics in your reports provides a comprehensive understanding of ad performance. Analyzing these metrics alongside other key performance indicators (KPIs) helps evaluate the effectiveness and efficiency of your advertising campaigns, ultimately connecting these insights to business goals.
Key Features and Benefits
- Ad spend tracking: Monitor your total spending across various campaigns and periods.
- Cost analysis: Breakdown of costs, including CPC, CPA, and other cost-related metrics.
- Budget allocation: Understand how your budget is distributed among different campaigns and objectives.
- ROI: Calculate the profitability of your ad campaigns.
- Customization options: Change how the report looks and what data shows to focus on specific parameters.
- Historical data: Track spending and budget trends over time.
Access your free Google Looker Studio dashboard templates today!

Get Your Templates
Template #6: Facebook Ads Attribution Report Template by Porter Metrics

The Facebook Ads Attribution report helps marketers track and understand how Facebook Ads contribute to conversions across different touchpoints. Instead of relying on last-click models, it offers a multi-touch attribution view that better reflects real customer journeys. This clarity empowers teams to adjust campaigns and credit the right sources.
Purpose
Measure and analyze the actual attribution of Facebook Ads to improve campaign credit assignment and strategy.
Key Metrics
- Attribution Window: Time period within which conversions are credited to ad interactions.
- Conversion Paths: The sequence of user actions that led to a conversion.
- Assisted Conversions: Conversions where Facebook played a supporting role.
- Attributed Revenue: Revenue directly influenced by Facebook campaigns.
- Touchpoint Count: Number of interactions before conversion.
Key Features and Benefits
- Multi-touch analysis: Go beyond last-click to capture the full impact of Facebook Ads.
- Cross-channel visibility: See how Facebook works with other channels in conversion paths.
- Attribution model comparison: Evaluate different models (first-click, linear, etc.).
- Custom lookback windows: Adjust attribution settings based on your business cycle.
- Integration-ready: Easily connect to CRM or GA4 to align attribution with business KPIs.
Template #7: Facebook Ads Creatives Performance Report Template by Porter Metrics

The Facebook Creative Performance report focuses on measuring how different ad creatives perform. It helps marketers understand which visuals and messages drive the most engagement and conversions. By analyzing creative-level metrics, this template supports smarter A/B testing and helps improve campaign results by focusing on what works.
Purpose
Assess the effectiveness of different ad creatives to inform future design and messaging strategies.
Key Metrics
- Engagement Rate: Likes, shares, and comments per impression, showing creative impact.
- Click-Through Rate (CTR): Percentage of impressions that led to a click.
- Conversion Rate: Percentage of clicks that resulted in a sign-up, purchase, or goal.
- Cost Per Result: Average spend per conversion or action tied to the creative.
- Ad Frequency: How often does the same user see the creative during the campaign?
Key Features and Benefits
- Creative comparison: Spot high-performing and underperforming designs quickly.
- Audience insights: Reveal how different segments respond to specific visuals.
- Performance trends: Understand when creative fatigue or momentum kicks in.
- Optimization recommendations: Get data-backed ideas to improve ad creatives.
- A/B testing support: Run and measure experiments for different visuals or messages.
Template #8: Facebook Ads Leads Breakdown Dashboard Report Template by Coupler.io
Facebook Ads Leads Breakdown Dashboard Report Template focuses on the leads generated from Facebook ads. It breaks down lead volume, cost, source, and quality, helping marketers identify what’s working and where to improve. It’s especially useful for campaigns on lead generation, customer acquisition, or conversion funnel efficiency.
Purpose
Analyze the quality and source of leads generated through Facebook advertising to enhance lead generation strategies.
Key Metrics
- Lead Volume: Total number of leads acquired through Facebook ad campaigns.
- Cost Per Lead (CPL): Average cost to acquire each lead.
- Lead Conversion Rate: Percentage of leads who completed a purchase or goal.
- Lead Source: Breakdown by campaign, ad set, or creative responsible for lead generation.
- Lead Quality Score: A rating or tag that evaluates lead readiness or potential value.
Key Features and Benefits
- Source analysis: Understand which campaigns or creatives drive the best leads.
- Cost efficiency: Find lead-gen tactics that deliver the most value per dollar.
- Quality assessment: Identify high-intent vs. low-quality leads in your funnel.
- Segmentation: Group leads by behavior, location, or demographics for better targeting.
- CRM integration: Sync with your lead management system for real-time tracking and follow-up.
Template #9: Facebook Ads Performance for Mobile Apps Report Template by Coupler.io

Facebook Ads Performance for Mobile Apps Report is tailored for mobile app marketers, focusing on user acquisition and in-app behavior. It offers a clear picture of how Facebook Ads drive app installs and post-install actions, helping optimize campaigns for quality users and long-term engagement.
Purpose
Evaluate the effectiveness of Facebook Ads in driving mobile app installs and in-app actions.
Key Metrics
- App Installs: Measures how many users downloaded the app through Facebook campaigns.
- In-App Purchases: Tracks the revenue generated by users who purchased after installing the app.
- Cost Per Install (CPI): Calculates the average amount spent to acquire one app install.
- ROAS: Evaluates revenue earned for every dollar spent on mobile-focused Facebook Ads.
- Retention Rate: Indicates how many users stayed active after the install, helping measure long-term app engagement.
Key Features and Benefits
- Real-time data syncing: Keeps install and engagement metrics updated without manual refresh.
- Tracks User Behavior Beyond Install: Measures in-app actions like purchases and logins.
- Customizable dashboard: It lets marketers track goals like installs, revenue, or retention.
- Integrates with Mobile Analytics Platforms: Merges Facebook data with Firebase, Appsflyer, etc.
- Scheduled reporting: Automates delivery of insights to team members and stakeholders.
Template #10: Facebook Ads & Brand Awareness Report Template by Coupler.io

The Facebook Ads & Brand Awareness Report Template helps brands measure the impact of Facebook Ads on visibility and audience interaction. It focuses on key awareness metrics to understand whether your campaigns increase recognition, interest, and engagement across demographics.
Purpose
Assess the effectiveness of Facebook Ads in enhancing brand awareness and audience engagement.
Key Metrics
- Reach: Total number of unique individuals who viewed your ad at least once.
- Impressions: Total number of times your ads were displayed, including repeat views.
- Engagement Rate: Percentage of users who liked, shared, commented, or interacted with the ad.
- Ad Recall Lift: Estimates how many users will remember your ad 2 days after viewing.
- Frequency: Shows how many times, on average, each person saw the ad.
Key Features and Benefits
- Visual data representation: Uses graphs and charts to present data in a digestible format.
- Demographic insights: Breaks down audience engagement by age, gender, and location.
- Brand lift trend tracking: Monitors changes in brand visibility over time.
- Custom filters: Allows sorting data by campaign, audience segment, or date.
- Automated data refresh: Keeps awareness data current without manual updating.
How to Choose Facebook Ads Reporting Templates and Tools for Maximum Impact
First of all, define your goals and KPIs. If you plan to increase website traffic, your KPIs may include click-through rate (CTR) and website visits. Your goal can be “to boost website traffic, and KPIs are a 5% CTR and 10,000 website visits per month.”
If you're running Facebook Ads, you need a reporting template that’s functional and built for speed, clarity, and automation. The right report should simplify your workflow and let you act on data, not just view it. Choose templates with seamless Facebook integration to automatically sync the latest ad data, no manual updates or CSVs. Tools like OWOX connect directly to Facebook and refresh data in real time.
A clean, interactive layout is essential for navigating insights quickly. Look for document-style templates with drag-and-drop elements that can be embedded into tools like Notion or Confluence. Built-in automation is another must, automated templates save hours by eliminating repetitive tasks like data entry and combining multiple ad platforms into a single view.

When selecting a report template, customization is key. Whether you need to track form submissions, highlight conversions, or spotlight ROI, flexible layouts help tailor your report to the audience, internal stakeholders or clients.
Actionable insights derived from these reports are crucial for optimizing your marketing strategies, improving campaign effectiveness, and enhancing your online presence.
Then, select relevant templates that align with your goals and KPIs. If you’re focused on lead generation, select a template that tracks form submissions and measures the number of leads acquired. To track leads, you need third-party analytics tools, and you may need to set up custom tracking and reporting for this specific purpose.
When choosing Facebook Ads reporting tools, find ones you can adjust to fit your needs. For example, by uploading cost data into Google BigQuery, you can connect costs with user actions on your website, calls to your call center, emails, and CRM system orders. This helps you analyze the impact of all your marketing efforts, both online and offline.
Customizable Facebook Ads Analytics Vs. Regular Facebook Ads Reporting Templates
Facebook Ads reporting templates are starting points for analyzing your marketing campaigns. They come with standard metrics and KPIs that most businesses use. However, custom reports are the way to go if you want to have a more detailed view of your ads’ performance and match it with your unique business goals.
You can even start with a blank page to design your report from scratch, offering flexibility in creating custom reports. Customizable reporting solutions enhance overall reporting processes for marketing teams, especially in displaying metrics that matter most. Like with Google Ads, custom reporting in Facebook campaigns gives you flexibility to monitor performance in ways that align with your specific goals.

With custom reports, you can focus on the metrics that matter most for your business. Custom reports are adaptable and can change as your company grows and your goals change. You can set up an automatic import of data from Facebook Ads to Google Analytics 4, which will save you time in the future.

Book Your Demo Call Now
To make the most of your Facebook Ads reporting, you might want to explore advanced marketing analytics solutions like OWOX BI.
Why OWOX BI is One of the Best Facebook Ads Reporting Tools
OWOX BI offers a seamless solution for Facebook Ads and multi-channel marketing analytics, ensuring your data is not just accessible but also business-ready.
What does it mean?
You can merge it with data from other sources, creating a complete view of your marketing activities and their results. Whether you want to prepare custom reports or use pre-built templates, OWOX BI allows you to do so.
And it doesn’t stop there - you can visualize your data, be it Google Looker Studio, Power BI, or Google Sheets.
With OWOX BI, you can access the information you need and get more out of your FB Ads campaigns.

Ready to Take Your Facebook Ads Analytics to the Next Level?
Book Your Demo Call Now
Frequently asked questions


Finally, a tool that doesn't ask business users to learn a new dashboarding UI. Our marketing team already knows Sheets. OWOX just delivers the right data.
Joinable data marts concept was the thing that sold us. We can now use the semantic layer without building one.
Self-hosted the OSS version on Digital Ocean. Zero vendor lock-in. Contributed a Shopify connector back in week two.