Facebook advertising dashboard template
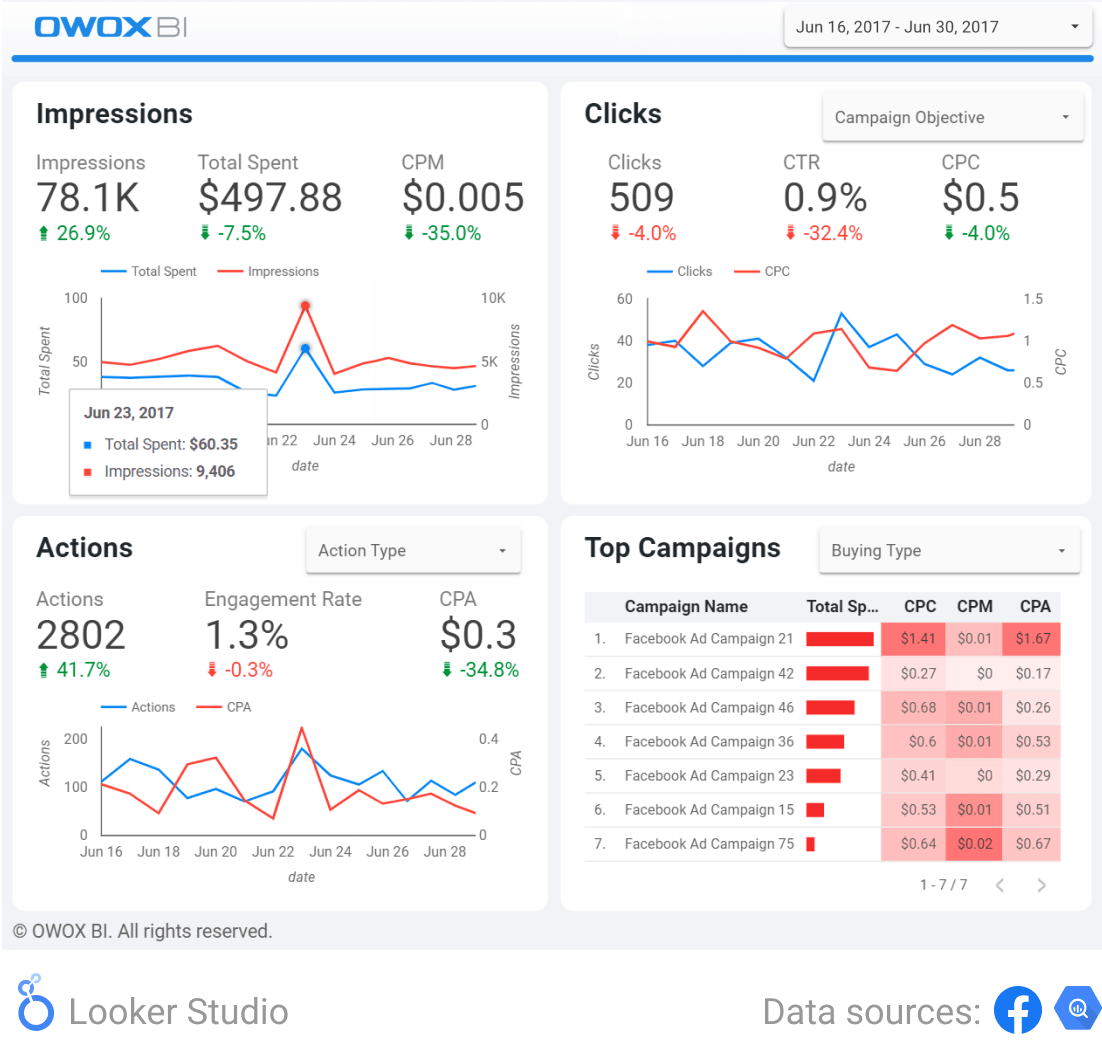
Analyze the core KPIs of your Facebook campaigns on one dashboard. Find the most effective campaigns and smartly allocate your budget.
Analyze the core KPIs of your Facebook campaigns on one dashboard. Find the most effective campaigns and smartly allocate your budget.


Thanks to this dashboard, you will see a complete picture of the costs of advertising campaigns and understand how to adjust your budget. Focus your efforts on campaigns that work better than others — that is, campaigns that have a low cost per action or click but at the same time motivate users to perform targeted actions.

Track the impressions, clicks, CPM, CTR, and CPC of your Facebook ads. Respond to changes in metrics in time and optimize campaigns.
Analyze how advertising costs have changed compared to the number of ad shows. Find days when there were more impressions and clicks and lower costs for impressions. Perhaps it’s on these days of the week that most of your target audience is online, in which case you can schedule your ads accordingly.

Analyze statistics on all actions: likes, reposts, clicks on links to the website, page subscriptions, comments, etc. Find out how much you pay on average for certain user interactions with ads and on which days users are the most and least active.
This dashboard will show which KPIs are getting worse so you can improve your ads in time. For example, if the Engagement Rate is down, you can change your CTA or offer rewards to users for the actions you want to encourage.


Get complete data in the right structure
Benefit from a dashboard built on complete data collected into Google BigQuery. OWOX BI merges your marketing data with your business data and avoids sampling and other Google Analytics limitations.

Ensure data quality
OWOX BI contractually guarantees not only data collection but data processing. It also automatically monitors data at each level of collection so you can confidently make data-driven decisions.

Don’t limit yourself to templates
Work with data in OWOX BI is based on your business model, not a set of tables you have to merge each time using SQL. You can create reports from understandable parameters and metrics in the OWOX BI interface as well as in Data Studio, Power BI, and Google Sheets.

Absolutely Fantastic!

Automated Reporting, Unmatched Precision

Great Service!

A leap forward to better analytics

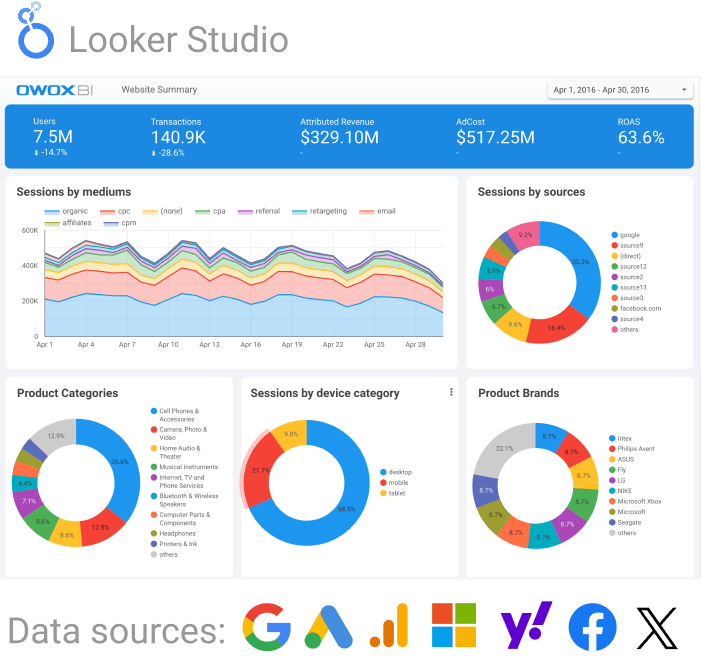
Find out how users from various traffic sources behave, how much it costs to attract them, and what profit they bring in.
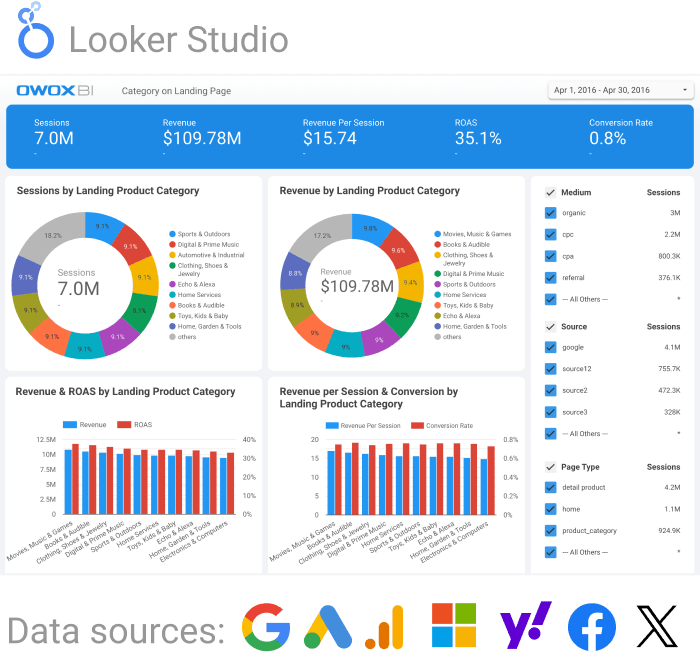
Evaluate the effectiveness of advertising channels for various categories and landing pages in order to plan your budget and increase sales.
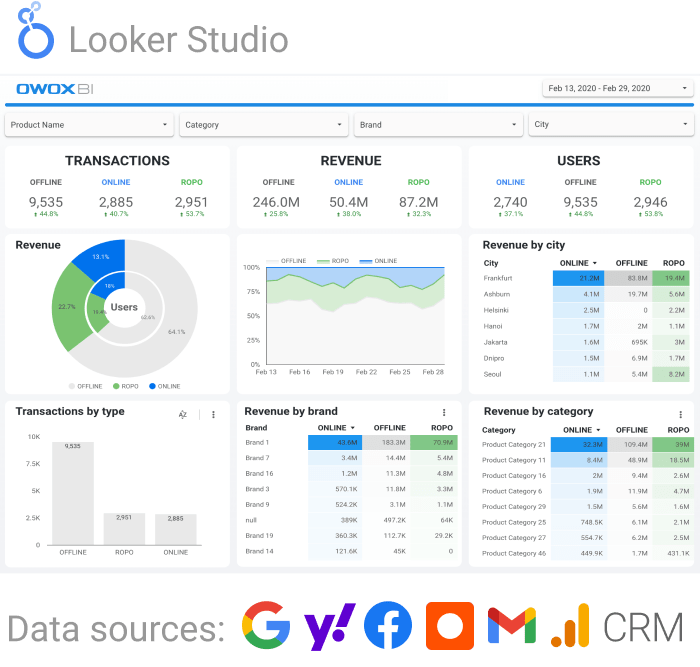
Learn how your online marketing affects sales in physical stores. See which campaigns and categories of goods bring more purchases offline and which work better online.
Subscribe to marketing analytics digest
By submitting this form I agree with Terms of service and Privacy policy.