MCP analytics limitations: why cross-tool joins need a data warehouse
Every week brings another announcement: a SaaS vendor ships an MCP server, and suddenly Claude can read your GA4 events, pull CRM records from HubSpot, and query Salesforce pipeline data – all in the same conversation. The demos look magical. You type a question in natural language, and the AI returns numbers from tools that used to require three browser tabs and a data team.
But here is the question nobody asks during the demo: “What happens when you need to combine that data?”
The moment you want to know which ad campaigns drove closed-won deals by region, or how website behavior correlates with customer lifetime value, you need data from multiple systems joined on shared keys at matching granularity. And that is precisely where MCP hits a wall.
This article walks through the exact boundary between what MCP handles well and where the data warehouse remains essential. By the end, you will understand the specific failure modes of cross-source joins via MCP, why LLMs hallucinate plausible-looking analytics, and how warehouse-backed data marts solve the problem in minutes rather than months.
Why MCP feels like the end of the data warehouse
Why MCP feels like the end of the data warehouse
The enthusiasm is understandable. For years, connecting to live business data required custom integrations, APIs, and fragile middleware.
MCP tools collapses that complexity into a single open standard – chat interface – and adoption has been explosive.
What MCP is (and why everyone is excited)
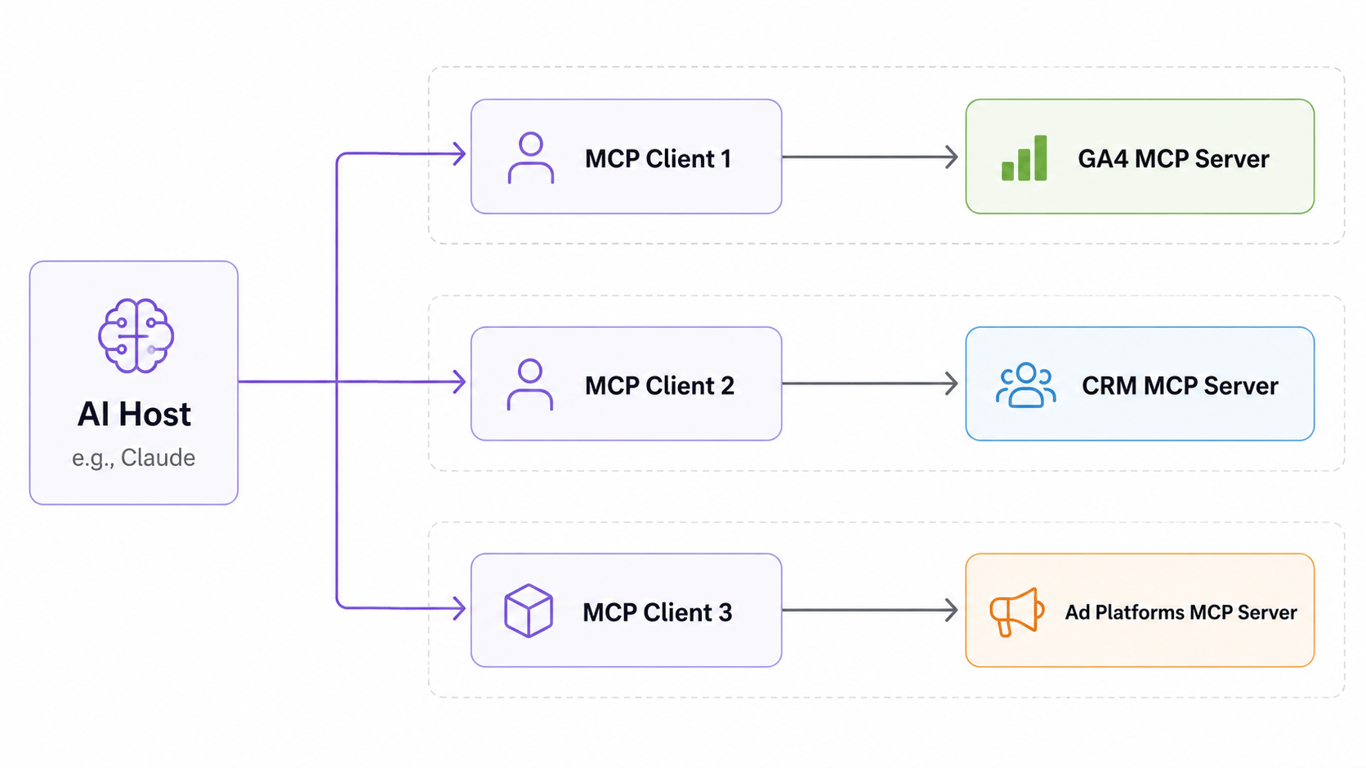
The Model Context Protocol is an open standard that defines how AI models connect to external data sources and tools. Think of it as a universal adapter: instead of building a custom integration for every SaaS tool, developers build one MCP server, and any compatible AI client can connect. The protocol uses JSON-RPC 2.0, with servers exposing resources (data), tools (functions), and prompts (templated workflows).
The adoption numbers behind the hype
The numbers are hard to ignore. By March 2026, MCP SDK downloads surpassed 97 million per month across Python and TypeScript – a 4,750% increase from launch.
The Stacklok State of MCP report, surveying 300 senior technical leaders, found that 41% of software organizations are already running MCP servers in limited or broad production.
Over 10,000 public servers are listed in the official MCP registry, with independent counts exceeding 17,000. OpenAI, Google, and Microsoft have all adopted the protocol, along with tools like VS Code, Cursor, and ChatGPT.
This is not a niche experiment. MCP is becoming infrastructure.
The promise – AI reads from every tool, no ETL is required
The pitch writes itself: connect MCP servers to your analytics stack, and the AI pulls live data from every source without extraction pipelines, transformation logic, or warehouse overhead. No more waiting on the data team. No more stale dashboards. Just ask a question and get an answer.
According to Google Cloud, MCP solves the problem that LLMs have frozen knowledge and cannot interact with the outside world. It enables active interaction and task execution, going beyond passive retrieval.
For single-source queries, this promise delivers. For anything involving multiple sources, it breaks down fast.
What MCP actually does well
Before dissecting the limitations, it is worth being specific about where MCP genuinely works. Dismissing it entirely would be as wrong as treating it as a warehouse replacement.
Single-source queries
When you ask Claude to pull yesterday’s session count from GA4, or to list all deals in your CRM that closed last quarter, MCP does exactly what you would expect. The AI connects to one MCP server, issues a query, and returns structured results. No pipeline, no transformation, no delay.
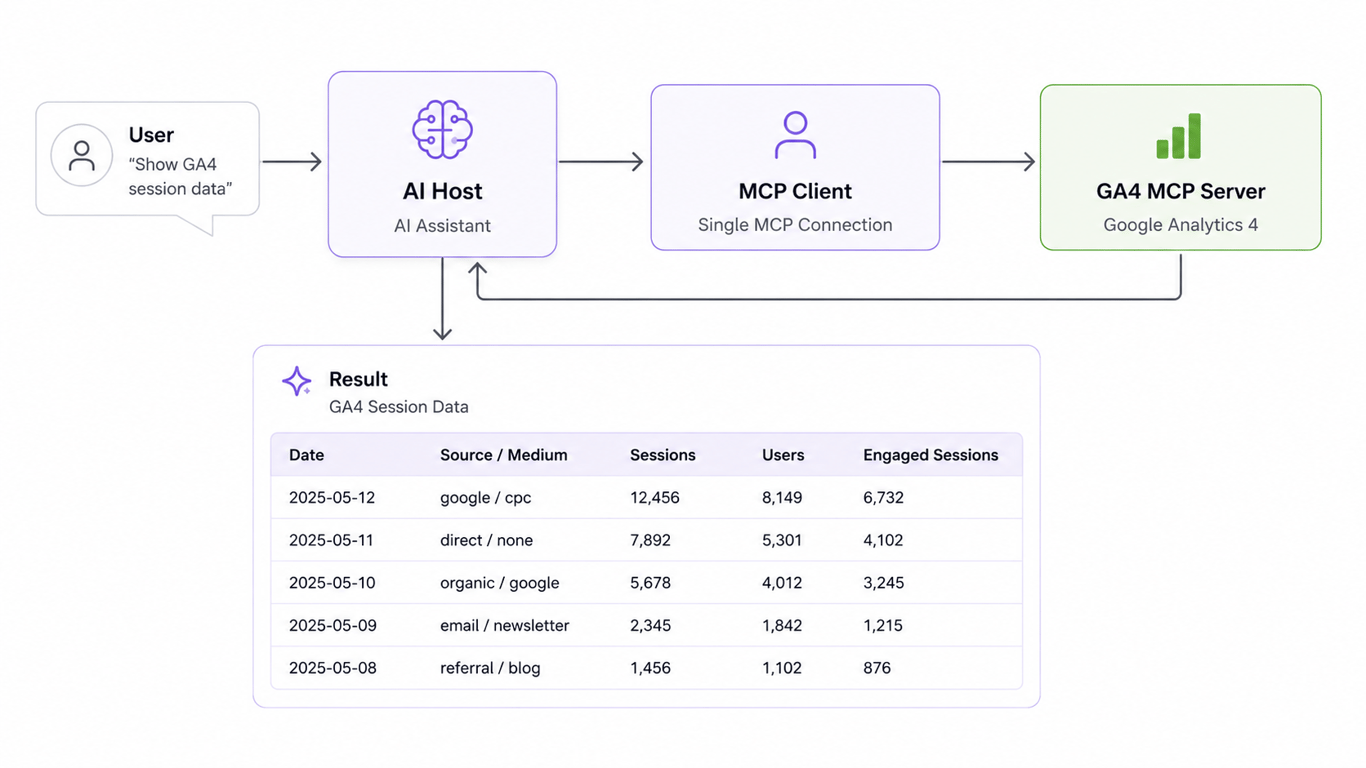
I have seen teams use this workflow to replace dozens of ad hoc Slack requests – the ones that start with “hey, can you pull something for me?” – and it works remarkably well. An analyst who used to spend two hours a day fielding quick-lookup requests can redirect that time to actual analysis.
Real-time tool access without ETL
MCP servers connect to live data. There is no batch extraction schedule to manage, no transformation jobs to monitor, no pipeline to debug at 3 a.m. For operational questions – “Is the checkout flow throwing errors right now?” or “What is our current ad spend for THIS platform for THIS day?” – this immediacy is genuinely valuable.
Where MCP genuinely replaces manual work
The sweet spot is single-tool operational queries that used to require logging into a platform, navigating to a report, applying filters, and copying the result. MCP automates the access layer. For teams drowning in self-service analytics requests, it removes the friction of getting to the data.
But accessing data from one tool at a time is not the same as analyzing data across tools. And analysis – the work that actually drives decisions – almost always requires cross-source joins.
OWOX Data Marts
See your first report built in real time. 15 minutes.
- Connect your data warehouse
- Pick your metrics
- Get a live Google Sheets report
In the time it takes to write a ticket. Then imagine never writing that ticket again.
Book a DemoWe'll use your actual use case
The joins problem MCP cannot solve
The joins problem MCP cannot solve
This is where the MCP-as-warehouse-replacement narrative falls apart. Not because MCP is poorly designed, but because cross-source joins require capabilities that sit outside MCP’s architecture entirely.
What analytics requires – shared join keys, aligned grains, deduplication
Consider what happens when you join GA4 web analytics with CRM revenue data. You need a shared join key – typically a user_id or client_id – that exists in both systems and means the same thing.
You need aligned granularity – session-level web data cannot be directly joined to account-level CRM data without aggregation.
And you need deduplication logic – the same user might appear three times in your CRM under slightly different names.
These are not formatting problems. They are data quality problems that require deterministic, auditable logic.
The GA4 + CRM + ad spend example
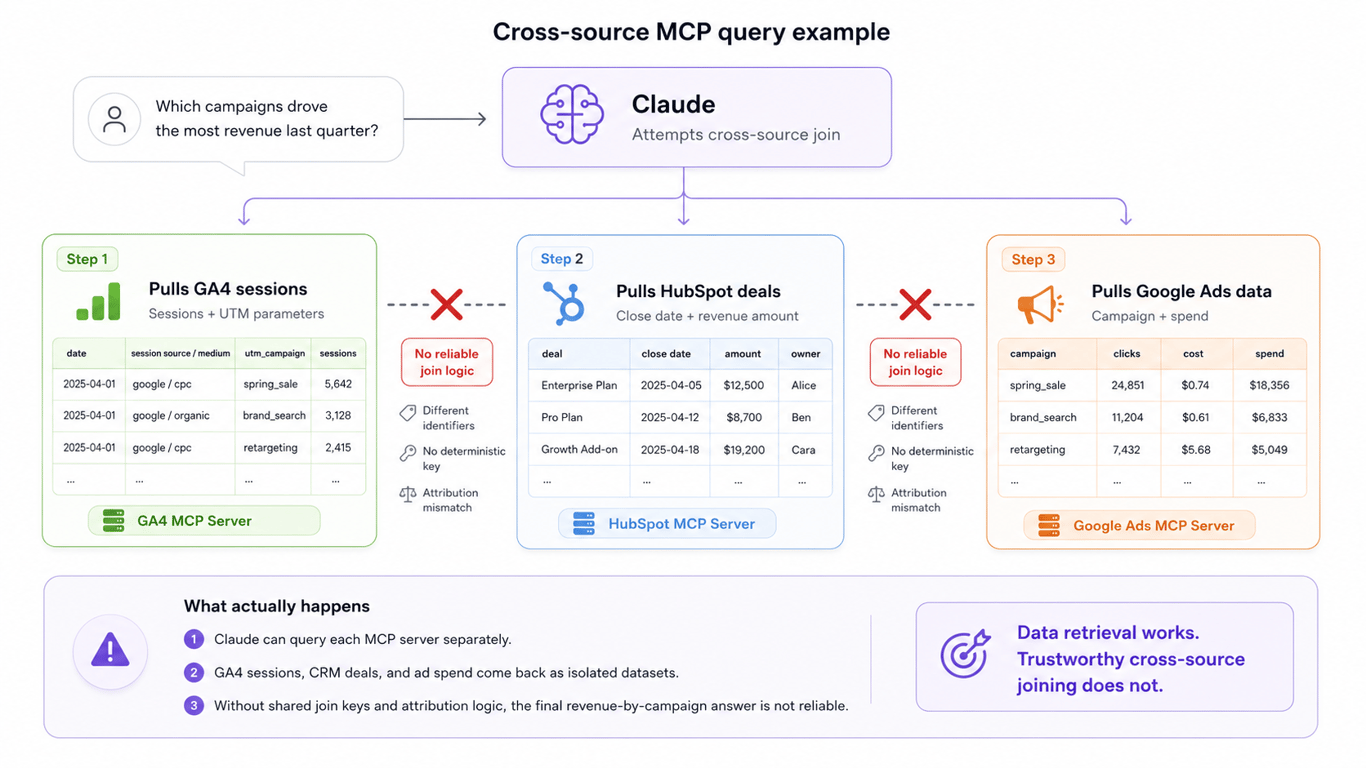
Walk through what actually happens when you ask Claude, connected to MCP servers for GA4, HubSpot, and Google Ads, to answer: “Which campaigns drove the most revenue last qua
Step 1: Claude queries the GA4 MCP server and retrieves sessions with UTM campaign parameters. The data is session-scoped with anonymized client IDs.
Step 2: Claude queries the HubSpot MCP server and retrieves deals with close dates, amounts, and contact emails. The data is deal-scoped with company associations.
Step 3: Claude queries the Google Ads MCP server and retrieves campaign names, spend, clicks, and impressions. The data is campaign-scoped with daily granularity.
Step 4: Claude tries to connect these datasets. There is no shared key. GA4 has client IDs and UTM parameters. HubSpot has emails and company names. Google Ads has campaign names.
The AI must guess that the UTM campaign name in GA4 matches a campaign name in Google Ads and then somehow link GA4 sessions to HubSpot deals – without a user-level identifier that spans both systems. This is simply impossible.
Why LLMs guess join keys instead of computing them
Here is the structural problem: MCP defines a one-to-one client-server relationship. There is no protocol-level mechanism for joining data across servers. No query optimizer spans the connection. No referential integrity checks validate the join. When Claude tries to correlate data from Server A with Server B, the join logic happens entirely within the LLM’s reasoning – which means it is probabilistic, not deterministic.
The MCP specification itself does not define cross-server data operations. Each server is an isolated context provider.
The result is that the AI picks what looks like a reasonable join key based on column names and values, without any guarantee that the key is correct, unique, or semantically equivalent across sources.
| MCP server | Data returned | Primary key | What’s missing for joins |
|---|---|---|---|
| GA4 | Sessions, events, page views, UTM parameters | client_id (anonymized) | No CRM identifier, no ad spend, no revenue attribution |
| HubSpot CRM | Contacts, deals, companies, lifecycle stages | contact email / deal ID | No session data, no campaign cost, no web behavior |
| Google Ads | Campaigns, ad groups, keywords, spend, clicks | campaign_id / ad_group_id | No downstream conversion data, no CRM outcomes |
| Salesforce | Opportunities, accounts, leads, activities | opportunity_id / account_id | No marketing touchpoint data, no ad spend allocation |
Each server provides a complete view of its own domain. None provides the connective tissue between domains. That connective tissue – the blending layer – is exactly what a data warehouse delivers.
What hallucination looks like in analytics
What hallucination looks like in analytics
When an LLM hallucinates in a creative writing task, the output is obviously fictional. When an LLM hallucinates in analytics, the output looks like a perfectly formatted table with plausible numbers. That is what makes it dangerous.
Three failure modes – wrong keys, misaligned grains, double-counting
Wrong join keys. Claude matches records on “campaign_name” between GA4 UTMs and Google Ads, but the naming conventions differ slightly – “spring_sale_2026” in GA4 versus “Spring Sale 2026” in Google Ads. The join silently drops 30% of records, and the resulting revenue figures are understated without any error message.
Misaligned granularity. The AI joins daily ad spend data with monthly CRM revenue, dividing monthly revenue by 30 and allocating it evenly across days. The actual revenue closed on three specific days. Every daily metric in the resulting table is wrong, but the monthly totals happen to look correct – masking the error.
Double-counting. A single deal in HubSpot is associated with three contacts. When the AI joins contacts to deals, it counts the deal revenue three times – inflating total revenue by the duplication factor. Research on AI analytics hallucination shows this pattern is one of the most common and hardest to detect.
Why hallucinated analytics looks plausible
The numbers are always formatted correctly. The column headers make sense. The totals are internally consistent within whatever flawed logic the AI applied. Unlike a SQL query that throws an error on a bad join, the LLM produces a confident, well-formatted answer every time.
Studies on text-to-SQL tasks show that on complex enterprise schemas with over 1,000 columns, even the best agent frameworks solve only 21.3% of tasks correctly. Schema misinterpretation accounts for 41.3% of errors, and semantic errors – misunderstanding the question or the data structure – account for another 36.1%.
The part most guides skip is this: 75% of these failures are silent. They do not trigger error messages. They produce results that look right but are wrong. The only way to catch them is manual inspection or deterministic validation.
The cost of decisions based on wrong data
When a marketing leader reallocates budget based on an AI-generated campaign performance table that double-counted CRM revenue, the damage compounds. The wrong campaigns get more spend. The right campaigns get cut. And the original analysis sits in a Slack thread, never questioned, because the numbers looked reasonable.
Compounding error rates make multi-step analytics particularly fragile. Research shows that a 1% per-token error rate compounds to 87% cumulative failure by token 200. A 10-step analytical workflow at 5% per-step failure rate succeeds only 60% of the time.
The spreadsheet workaround (and why it fails)
The spreadsheet workaround (and why it fails)
When MCP cannot join data across sources, teams often default to the oldest workaround in analytics: export everything to a spreadsheet and VLOOKUP it together.
Export + VLOOKUP – the path of least resistance
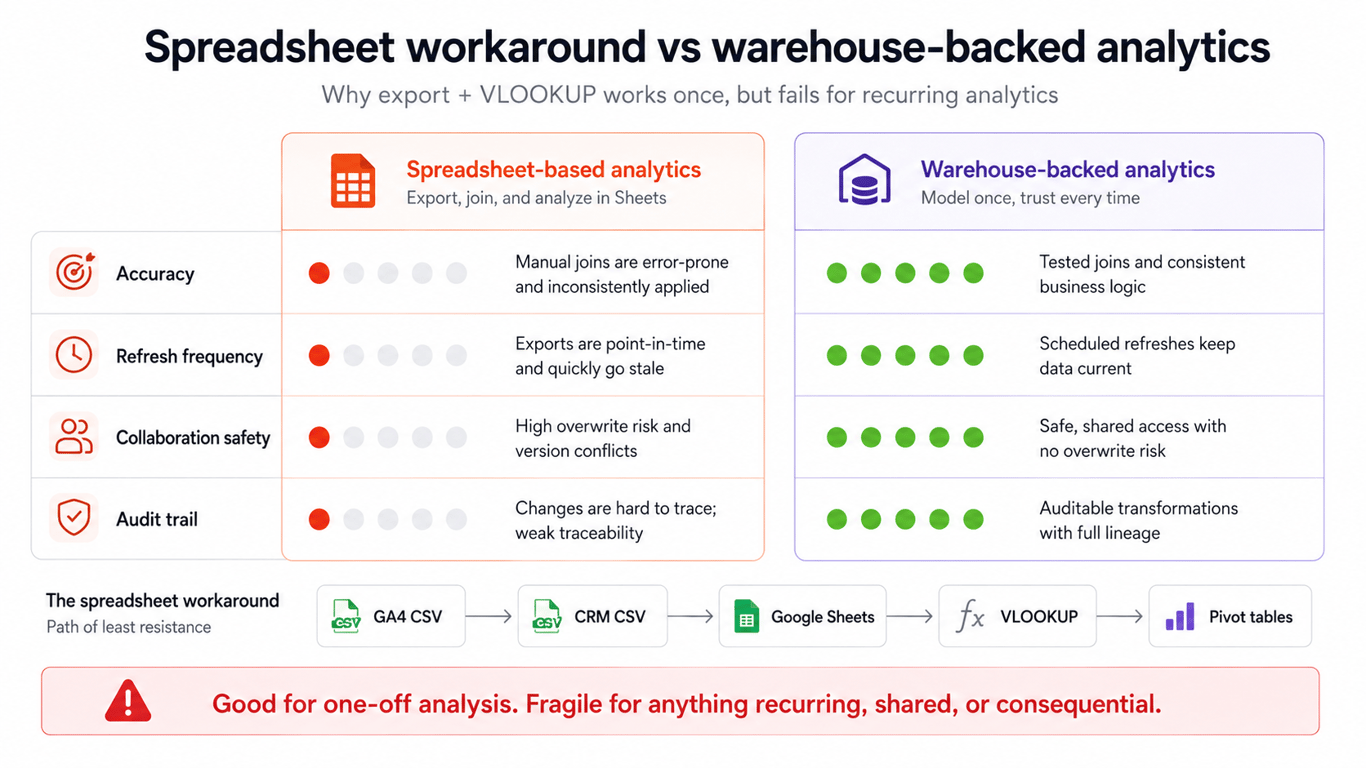
The workflow is familiar. Export GA4 data to a CSV. Export CRM data to another CSV. Open both in Google Sheets. Write a VLOOKUP to match records on whatever field looks like a shared key. Add some pivot tables. Share the link.
It works for a one-time analysis. It falls apart for anything recurring, shared, or consequential.
Version control, refresh cycles, broken formulas
Honestly, I have seen teams where five people are working from five different copies of the same spreadsheet, each with slightly different VLOOKUP ranges and filter criteria. The numbers in a Monday meeting do not match the numbers in a Tuesday email, and nobody can figure out why.
The problems with spreadsheets as analytics tools are well-documented: no version control for data changes, no automatic refresh when source data updates, formulas that break silently when rows are inserted or columns shift.
Why spreadsheets are a data governance regression
If your organization invested in a data warehouse, data governance policies, and access controls, exporting data to personal spreadsheets undoes all of that work. There is no audit trail, no access logging, no transformation documentation. A VLOOKUP join cannot be validated, tested, or reviewed the way a SQL transformation can.
For teams under regulatory or compliance requirements, this is not just messy – it is a governance risk. The data leaves the controlled environment and enters an untracked one.
The architecture that actually works
The architecture that actually works
The question is not whether to use MCP or a warehouse. It is where each tool belongs in the stack. The answer is straightforward: MCP handles access, the warehouse handles joins.
Data warehouse as the join layer
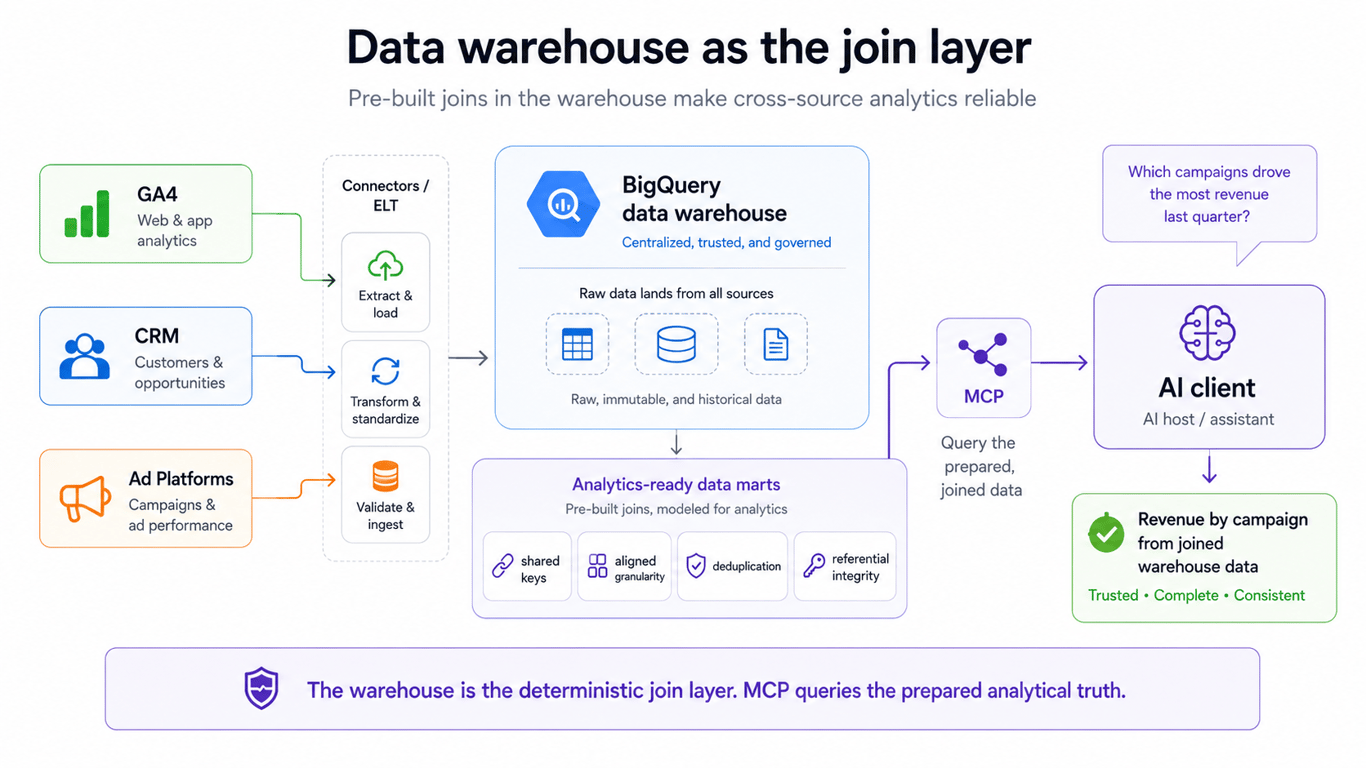
A data warehouse exists specifically to solve the problems MCP cannot: shared keys across sources, aligned granularity, deduplication, and referential integrity. When GA4 session data lands in BigQuery alongside CRM deal data and ad spend data, the join logic is written in SQL – deterministic, testable, version-controlled, and auditable.
Pre-built data marts – correct keys, aligned grains, zero guesswork
A data mart is a pre-built, purpose-specific dataset that has already solved the join problem. The keys are mapped. The grains are aligned. The deduplication logic is applied. When an analyst – or an AI – queries a data mart, the answer is deterministic because the transformation logic was defined once, tested, and maintained.
This is the difference between asking an LLM to guess how GA4 sessions relate to HubSpot deals and querying a table where that relationship is already computed correctly.
How OWOX data marts deliver warehouse-backed analytics
OWOX Data Marts provides joinable data marts that bring data from marketing and analytics sources into BigQuery (or other data warehouse of your choice - we support 5 and growing quickly) with correct join keys and aligned granularity.
The analytics-ready data is structured so that cross-source queries return accurate, deterministic results no matter who requests them from Google Sheets or OWOX MCP through claude of chatGPT.
Instead of asking an LLM to figure out how to connect campaign UTMs to CRM revenue, OWOX data marts deliver a table where that connection is already made – with documented transformation logic that your data team can audit and modify.
Setup in 2–5 minutes, not weeks
The typical objection to warehouse-based analytics is setup time. Traditional approaches can take weeks of schema design, pipeline configuration, and testing.
OWOX data marts can be configured in minutes because the join logic, key mapping, and grain alignment are so easy to setup and maintain for every analytics use cases.
You can start free and have your first cross-source data model running for self-service analytics before the top of the hour.
MCP and data warehouses are complements, not competitors
MCP and data warehouses are complements, not competitors
The framing of MCP versus the data warehouse is a false dichotomy. These tools solve different problems at different layers of the analytics stack, and the strongest architectures use both.
MCP for real-time single-source reads
MCP excels at giving AI models live access to individual tools. Need to check current ad spend? Query the Google Ads MCP server. Want to see today’s support tickets? Connect to the Zendesk MCP server. For operational, single-source questions, MCP provides immediacy that a batch-loaded warehouse cannot match.
This is especially valuable for the AI-augmented analytics team, where analysts use AI assistants for quick lookups while reserving structured analysis for the warehouse.
Warehouse for cross-source analytical truth
The warehouse is where analytical truth lives – the single place where data from multiple sources is joined, deduplicated, validated, and made available for reliable cross-source queries. This is not redundant with MCP. It is the layer that makes cross-source analysis possible at all.
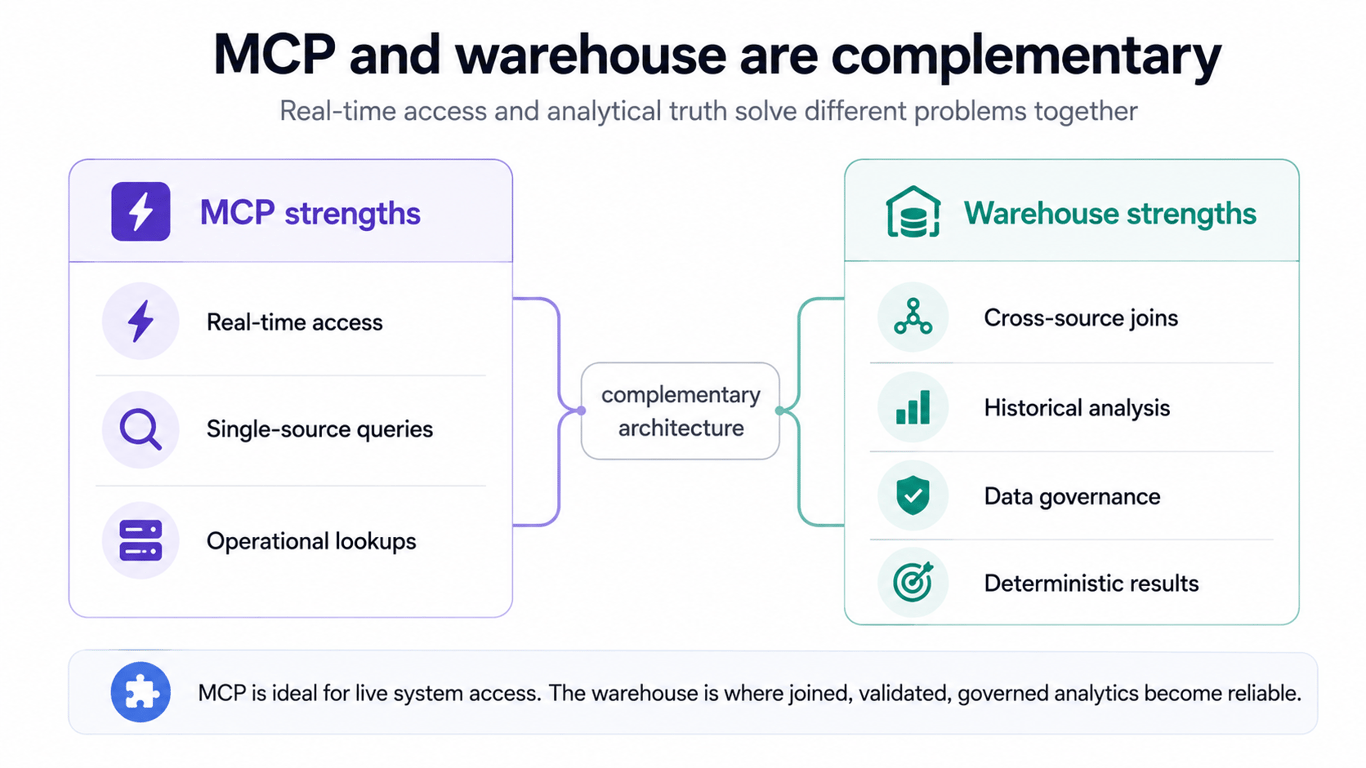
When you connect BigQuery to Claude via MCP, you get the best of both worlds: the AI reads from the warehouse where cross-source joins have already been computed correctly. The MCP connection provides the access. The warehouse provides the accuracy.
The future – MCP feeds warehouse, AI reads warehouse
The architecture that is emerging across mature analytics teams follows a clear pattern: MCP serves as a real-time data access layer, feeding data into the warehouse alongside traditional connectors. The warehouse handles the heavy lifting – joins, deduplication, historical storage. And AI reads from the warehouse through MCP, getting answers that are both immediate and correct.
This is not a compromise. It is the architecture that eliminates hallucination from analytics by ensuring that every cross-source answer is backed by deterministic SQL, not probabilistic reasoning.
What to do next
The gap between MCP’s capabilities and cross-source analytics requirements is structural, not temporary. Here is how to address it without overcomplicating your stack.
Audit your MCP-to-analytics workflow
List every analytics question your team answers regularly that requires data from more than one source. For each question, identify whether the answer currently comes from a warehouse-backed query, a spreadsheet join, or an AI guess. The questions in the third category are your highest-risk analytics outputs.
Identify cross-source join dependencies
For each multi-source question, document the join keys required, the granularity of each source, and the deduplication rules. This is the specification for your data mart. Without it, any solution – warehouse, spreadsheet, or AI – will produce unreliable results.
Start with one data mart
Pick the cross-source question your team asks most frequently – often campaign performance by revenue, or cost data blending across ad platforms – and build one data mart that answers it correctly. OWOX provides data marts management platform for the most common cross-source analytics self-service analytics scenarios, with AI insights and MCP server layered on top of YOUR warehouse-backed data.
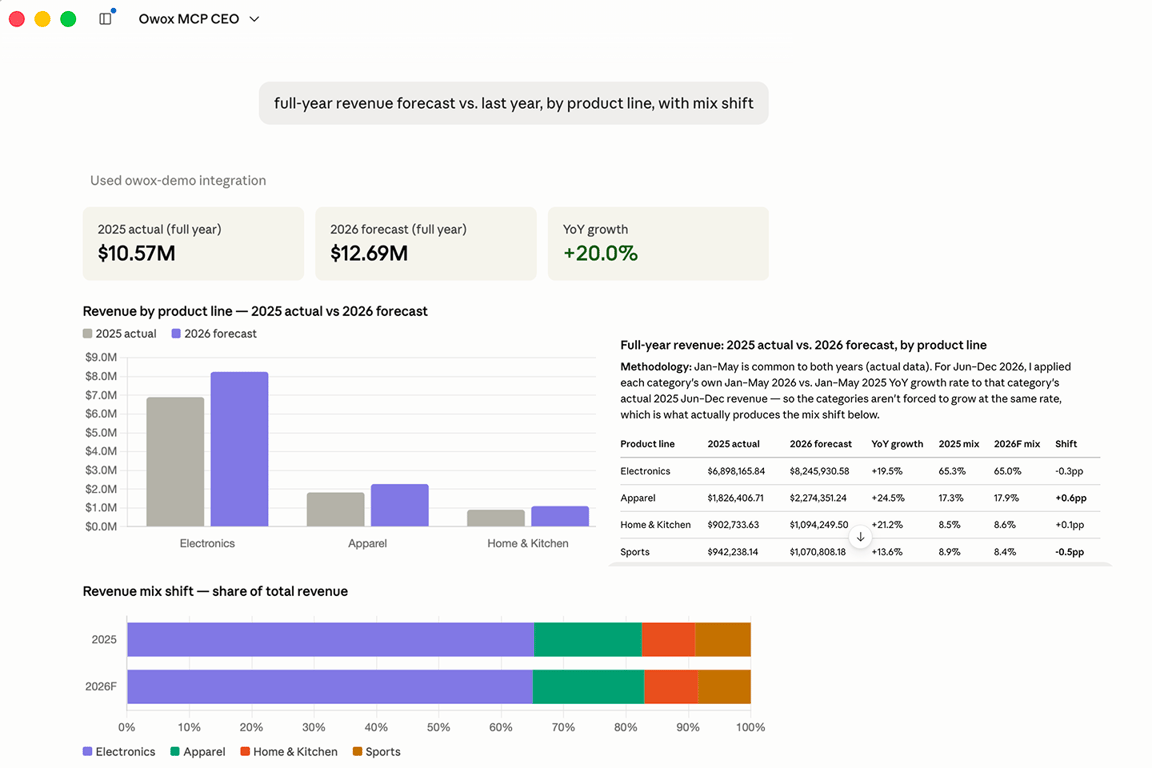
Once you see the difference between an AI-guessed join and a warehouse-computed join, the architecture decision makes itself.
Turn your data into decisions.
Governed data marts give you the clean foundation ML needs to actually work.
- No AI hallucinations
- Analyst-governed definitions
- Every number traces to SQL
Frequently Asked Questions
Is MCP safe for enterprise analytics data?
MCP is safe for accessing individual data sources, but using it for cross-source analytics introduces accuracy risks rather than security risks. Enterprise concerns include session state management (MCP is a stateful protocol that limits horizontal scaling), the lack of cross-server referential integrity checks, and the risk of hallucinated joins producing plausible but incorrect analytics outputs that inform business decisions.
What is a data mart and how does it prevent hallucinations?
A data mart is a pre-built, purpose-specific dataset in a data warehouse where data from multiple sources is already joined with correct keys, aligned granularity, and applied deduplication logic. It prevents hallucinations because when an AI queries a data mart, the cross-source joins are computed by deterministic SQL rather than guessed by an LLM. The transformation logic is defined once, tested, and maintained.
Can Claude join data from multiple MCP servers accurately?
Not reliably. When Claude queries multiple MCP servers and tries to combine the results, it must guess the join keys, align different data granularities, and handle deduplication – all using probabilistic reasoning rather than deterministic SQL. The MCP specification defines one-to-one client-server relationships with no protocol-level mechanism for cross-server joins, making accurate multi-source analysis structurally impossible through MCP alone.
What is the difference between MCP and a data pipeline?
MCP provides real-time read access to individual tools without extracting, transforming, or storing data. A data pipeline (ETL/ELT) extracts data from multiple sources, transforms it with defined join logic, and loads it into a warehouse where cross-source queries are possible. MCP replaces the access layer but not the transformation or join logic that pipelines provide.
How does MCP connect to analytics tools like GA4?
MCP (Model Context Protocol) uses a standardized JSON-RPC 2.0 interface that defines how AI models connect to external data sources. A GA4 MCP server exposes analytics data as resources that any compatible AI client can query. The connection is one-to-one: each MCP server provides access to one tool, making it excellent for single-source queries but unable to join data across multiple tools.
What is the hallucination rate when LLMs join data from multiple sources?
Research shows hallucination rates of 40–80% for open-ended generation tasks and over 33% for multi-step reasoning. In analytics specifically, LLMs frequently guess join keys, misalign time grains, and double-count records when combining data from multiple MCP servers. These errors are especially dangerous because the output looks like a properly formatted table with plausible numbers.
Can MCP replace a data warehouse for analytics?
No. MCP gives AI models read access to individual tools like GA4, CRM, and ad platforms, but it cannot join data across those sources. Analytics that compares performance across tools requires shared keys, aligned granularity, and deduplication logic – capabilities that only a data warehouse provides. MCP and warehouses complement each other: MCP handles real-time single-source access, while the warehouse handles cross-source joins.