
Self-service analytics doesn't exist. Here's the architecture that works.
BI dashboards, spreadsheet chaos, AI chatbots, semantic layers — four failure modes, one root cause. The data-mart-first fix.

You've seen this play before.
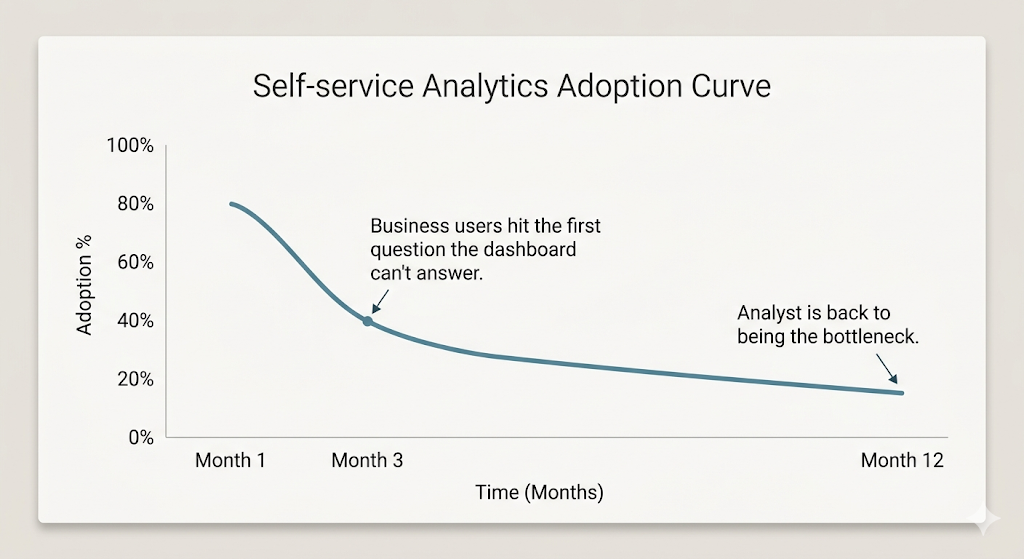
A data team deploys Tableau, Looker, or Power BI. There's a rollout plan, training sessions, a Slack channel for questions. Month one, adoption looks great – 80% of the target users have logged in. By month six, it's 15%. By month twelve, the data team is still the bottleneck, and now they also maintain an expensive tool that nobody opens.
The post-mortem always lands on the same conclusion: "Our business users aren't data-literate enough." The vendor suggests more training. The data team suggests a simpler dashboard. Leadership suggests trying a different tool.
None of them are right. The problem isn't the users, the training, or the tool. It's the model. Every self-service analytics initiative forces a tradeoff that guarantees failure – and until you name that tradeoff, switching tools is just rearranging deck chairs.
The tradeoff nobody names
Here's the structural problem every data leader eventually hits: analyst control and business-user freedom are in direct tension, and every self-service approach privileges one at the expense of the other.
When you optimize for analyst control – governed dashboards, locked-down metrics, curated data models – business users can only see what the analyst anticipated. Every new question goes back to the queue. "Self-service" becomes "self-service within the box we built."
When you optimize for business freedom – raw data access, AI chatbots, spreadsheet exports – numbers diverge, trust collapses, and the CFO gets three versions of revenue in the same board meeting.
When you try to optimize for both at once – hello, semantic layer – you get a 6-to-12-month project that's obsolete before it ships.
Every self-service analytics initiative fails because it forces a choice between the analyst's control and the business user's freedom. That choice is the bug, not the feature.
The question isn't "how do we train users to use the tool?" It's "how do we build an architecture where neither side has to compromise?"
Four ways self-service analytics fails
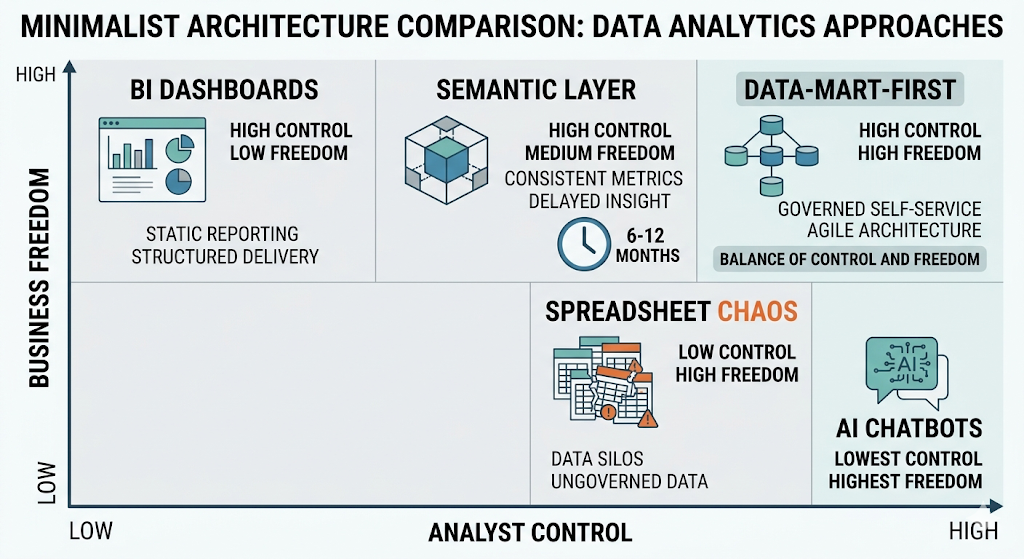
Companies have tried four approaches in the last decade. Each one gets something right – and then breaks on the same tradeoff.
BI dashboards – sacrifice business freedom
BI tools are excellent at showing the answers to questions someone already thought to ask. The problem is that business users rarely have exactly the question the dashboard designer anticipated. They want one more column, a different time range, a breakdown by a dimension nobody planned for. Every "can you just add..." becomes a ticket. The dashboard becomes a bottleneck with a nicer interface.
The data shows it. Dashboard adoption drops predictably after launch because the tool can't answer the question the business user has today – only the questions the analyst pre-built last quarter. As one LinkedIn post put it: "A mess of unused dashboards. Conflicting numbers. Bad decisions based on stale or misunderstood data." When your "self-service BI" requires the analyst to modify the dashboard every time the question changes, it's not self-service – it's a prettier ticket queue.
Spreadsheet chaos – sacrifice trust
The opposite extreme. Business users get tired of waiting, export data into Google Sheets, and build their own reports. Marketing has one revenue number. Finance has another. Sales has a third. Nobody knows which is right because everyone computed it differently.
I've seen this pattern in dozens of organizations – the "shadow analytics stack" that grows organically because the official tool is too slow. It works until the first cross-department meeting where someone asks: "Why don't our numbers match?" Once trust breaks, it's nearly impossible to rebuild. The reporting backlog doubles because now the data team has to validate everyone else's spreadsheets on top of their own work.
AI chatbots on raw data – sacrifice verifiability
This is the newest failure mode, and arguably the most dangerous. Point ChatGPT, Gemini, or Claude at your warehouse and let business users ask questions in natural language. The output sounds confident and looks plausible – but the AI infers column meanings, fabricates joins, and produces numbers that change between runs. It's non-deterministic, unverifiable, and now regulated.
Stanford HAI's 2025 research found that even specialized AI tools hallucinate 17% or more of the time – general-purpose chatbots hit 58–82%. The Stack Overflow 2025 Developer Survey confirms it: 46% of developers actively distrust AI tool accuracy. And with the EU AI Act mandating traceable logic on AI insights used in significant decisions – fines up to €35 million – "the AI said so" is no longer a defensible answer.
The problem isn't that AI is useless for analytics. It's that bolting AI onto raw data without a governed layer underneath is like giving someone a power tool without a workbench. The tool is powerful. The setup is reckless.
Semantic layer projects – sacrifice time
The "correct" architectural answer – and the one nobody finishes. Define every metric in a universal layer, enforce it across all tools, and let business users query through it. In theory, this solves everything. In practice, it solves nothing in time.
Production-ready semantic layers take 6–12 months for enterprise teams to ship (Datacoves, 2026). Only 27% of teams plan to increase semantic-layer investment (dbt, 2025). And the maintenance cost is brutal – every new metric, every schema change, every business-logic shift requires updating the layer. Independent practitioners call it "economically unviable for many firms."
Here's the clincher: of those using AI to consume data via natural language, two-thirds are using plain SQL generation, not a semantic layer (dbt 2025). The market is voting with its feet.
The model that refuses the tradeoff: data-mart-first
What if you didn't have to choose?
OWOX Data Marts is built on a different premise: put the Data Mart – a controlled, reusable, analyst-defined artifact – at the center of the architecture. Not the dashboard. Not the notebook. Not the chatbot. Not the semantic layer. The data mart is the unit of self-service.
The data team controls the truth
The analyst defines the query, the output schema, the join keys, and the access controls. One Data Mart = one business question answered correctly. The logic is governed, version-controlled, and fully traceable – every cell traces back to SQL the analyst approved. No AI generates the numbers. No business user can change the computation.
This is what the positioning doc calls the analyst's role as architect and governor – not an order-taker who manually runs queries, but the person who defines the logic once and trusts the system to deliver it.
The business user controls the question
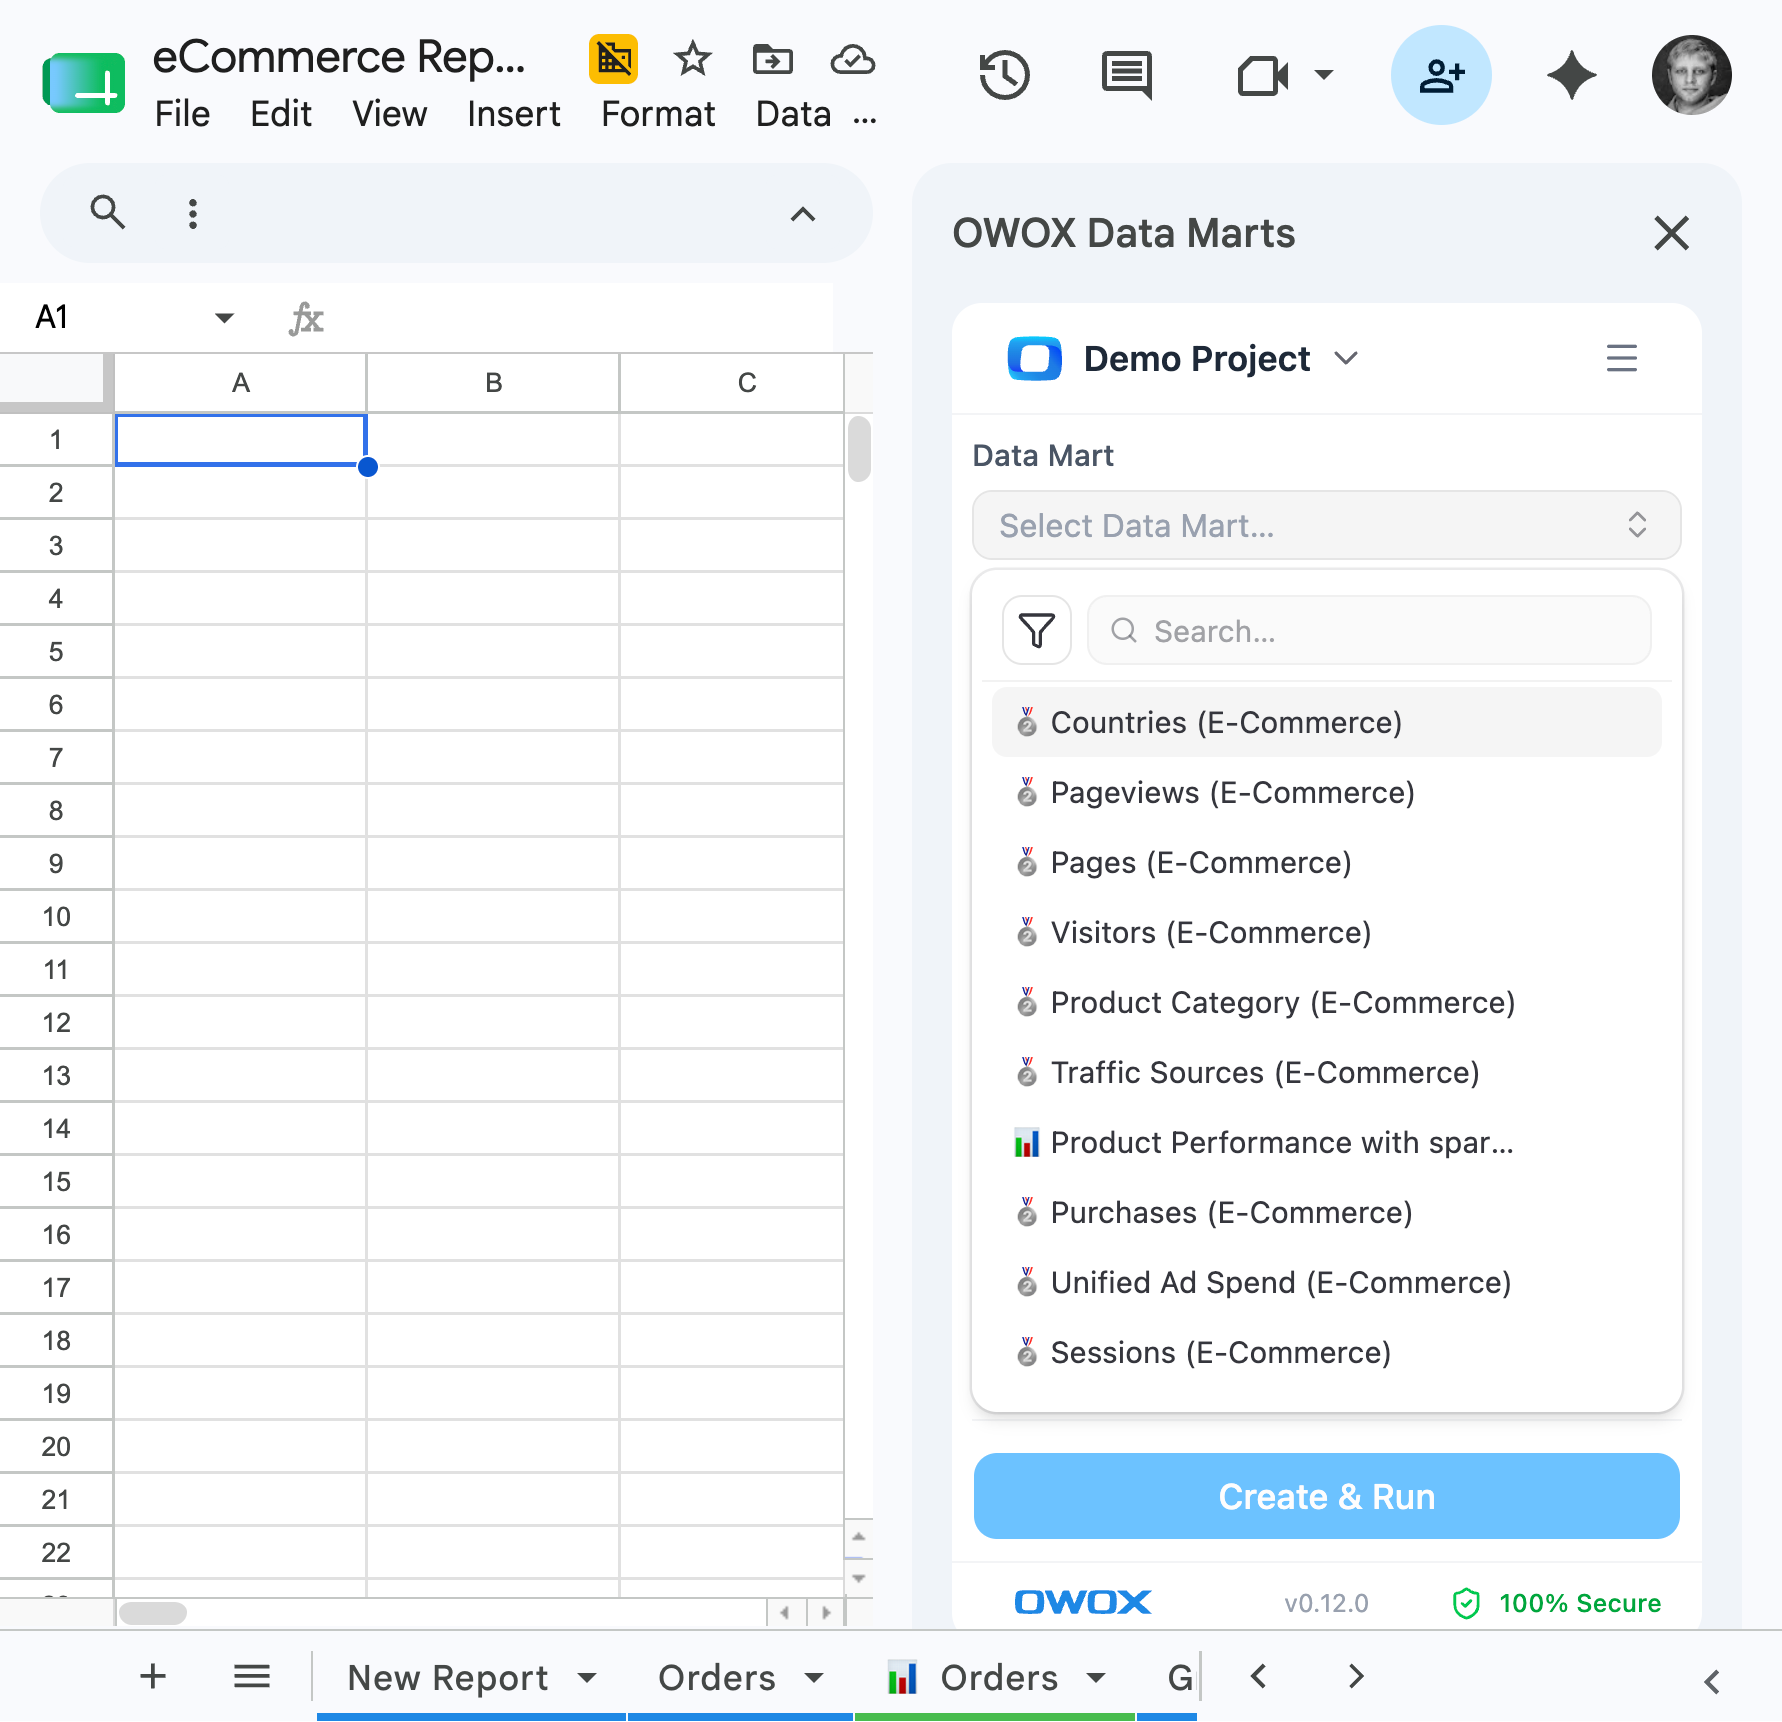
Business users self-serve from the Data Mart library – in Google Sheets, Slack, email. They browse available data marts, pick columns (including joined columns from related marts where the analyst defined the join keys), apply filters, and pull data. No SQL. No dashboard training. No new tool to learn.
The answer arrives in the tool the business user already lives in – Google Sheets for most teams. That's not a limitation; it's the design. Tabular data in a spreadsheet lets business users prove findings, not just state them.
"Gentle semantization" – govern just enough
A semantic layer standardizes how to compute. An ontology maps what things are. A full semantic layer is too brittle for most teams – maintenance outpaces value. OWOX replaces it with what we call gentle semantization: analysts govern just enough structure at the data mart level, scoped to what each stakeholder actually needs.
Ontology thinking informs data mart design – Campaign → Spend → Revenue – with analyst-owned SQL as the trust boundary. No 6-month modeling project. No universal metric layer to defend. Ship a data mart this afternoon; add the next one when the business asks for it. The "semantic layer" emerges incrementally from the library, not from a top-down architecture document that takes a year to write.
What this looks like in practice
Architecture is theory. Here's how it works day to day.
The analyst's workflow
An analyst connects their warehouse – BigQuery, Snowflake, Databricks, Redshift, or Athena. They create a Data Mart library, import tables and views, and add metadata: business-friendly aliases, descriptions, and join keys that define how marts relate to each other. They set a trigger for auto-refresh – hourly, daily, weekly – and publish the mart to the library.
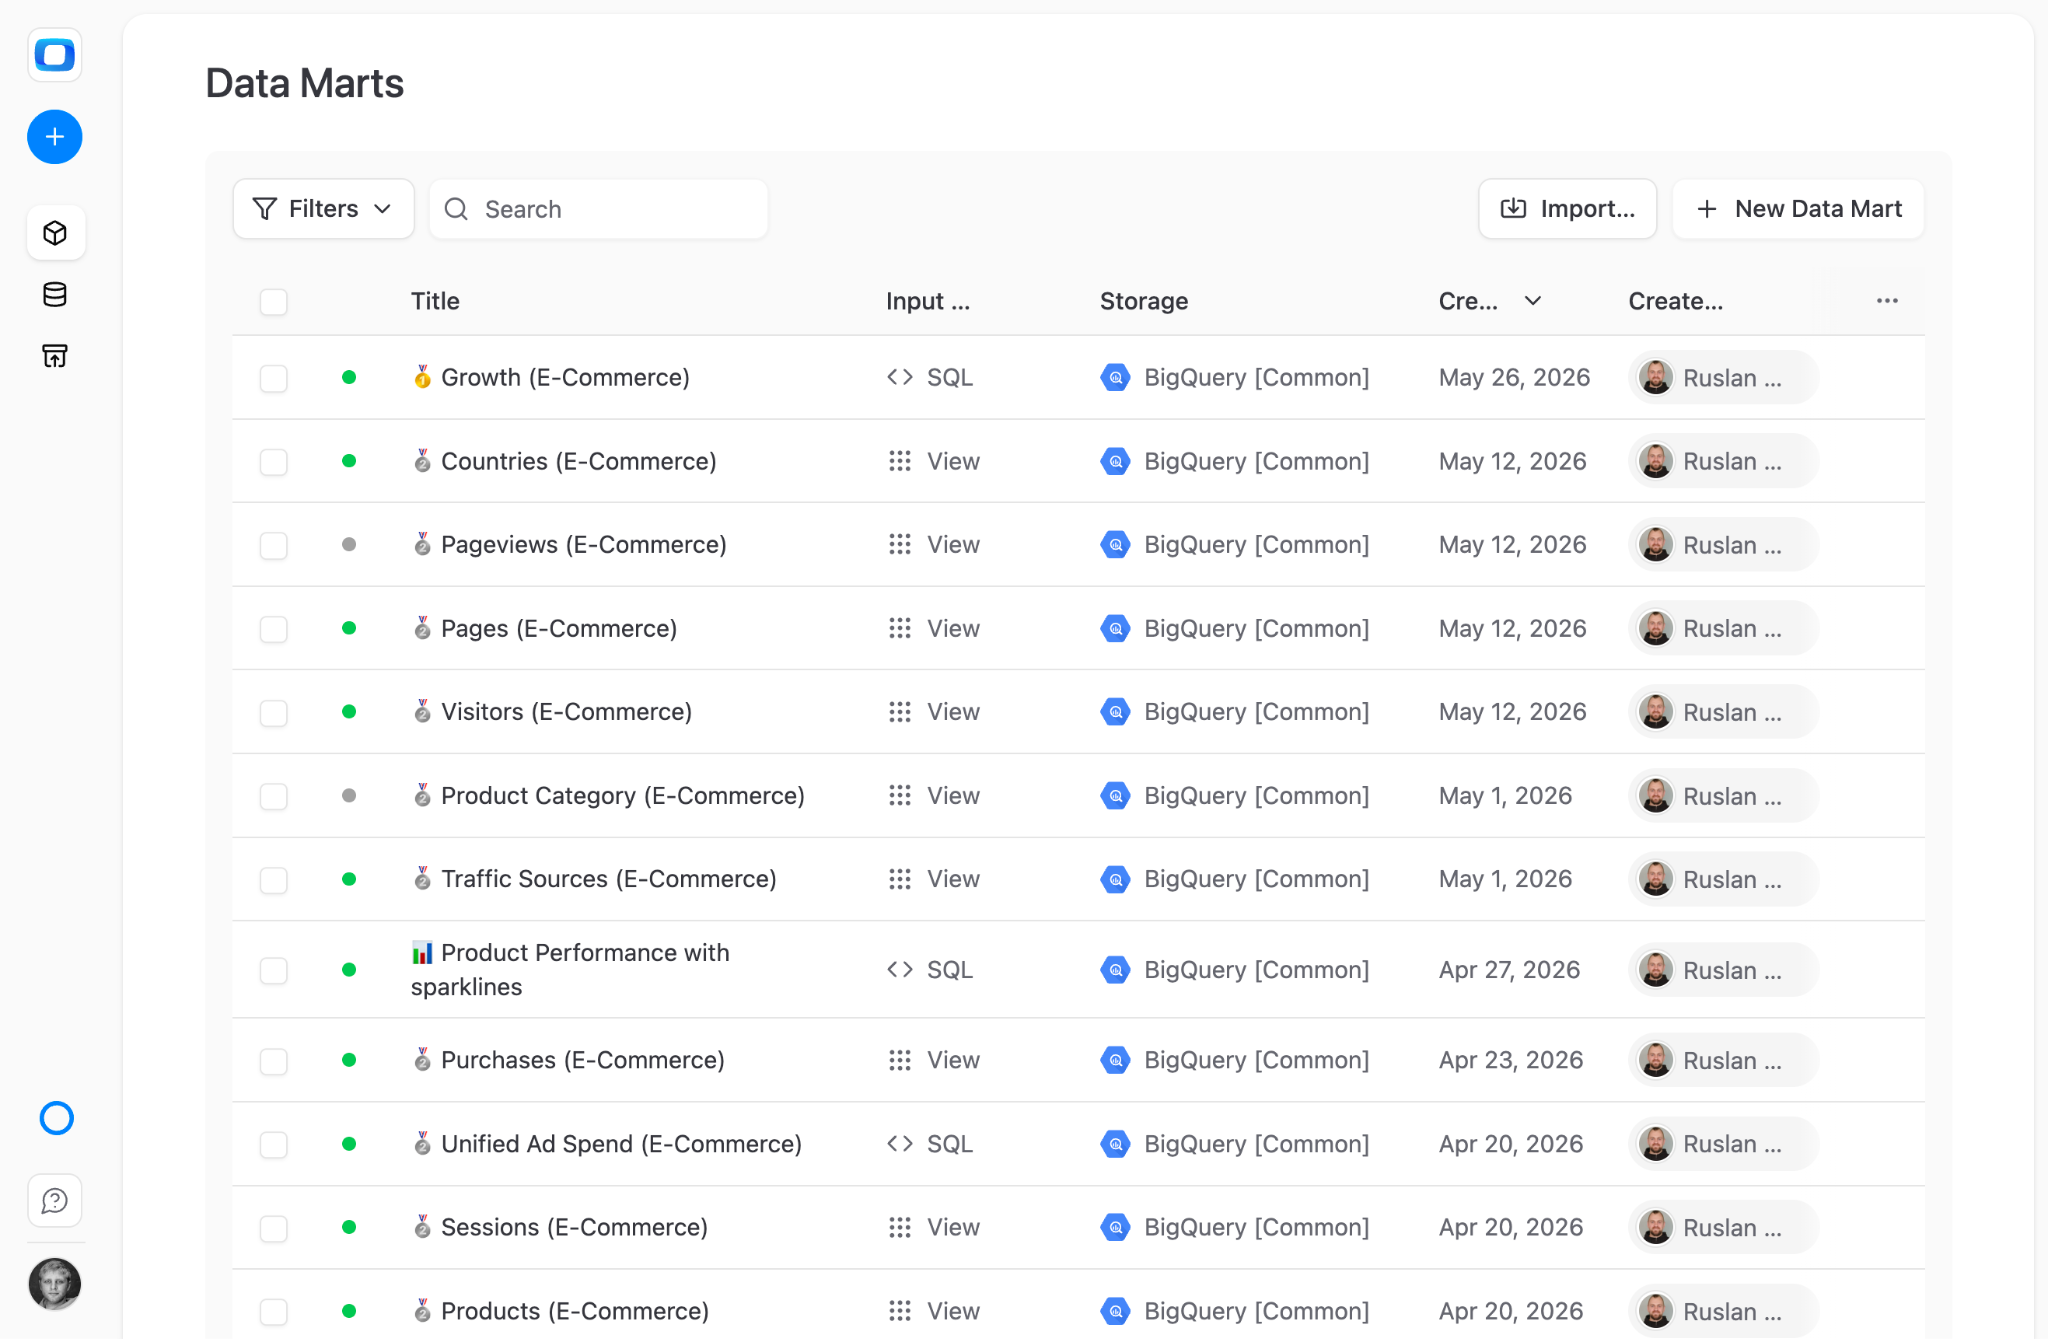
That's it. The mart is now a governed, reusable artifact. The analyst defined the logic once. Every downstream consumer – whether they pull data in Sheets or receive insights in Slack – gets the same numbers from the same query.
The business user's workflow
A business user opens Google Sheets and launches the OWOX extension. They see the Data Mart library – only the data marts the analyst made available. They pick columns, including joined columns from related data marts (the analyst defined the join keys, so the joins are safe). They apply filters. They pull data. The Sheet refreshes on schedule.
No SQL. No tickets. No waiting. And every number traces back to a query a human analyst approved.
What happens to the reporting backlog
The backlog doesn't shrink – it disappears. Not because the questions stop, but because the answers are self-served. The analyst's time shifts from data delivery to the work that actually requires human judgment: metric definitions, variance diagnosis, business-logic mapping, and stakeholder translation.
That's not a demotion – it's a promotion. The analyst moves from order-taker to architect. From "can you pull this for me?" to "let me design the system that answers every version of that question automatically."
For the full hire-model framing – how OWOX structures this as an AI analytics team you hire – see the companion article.
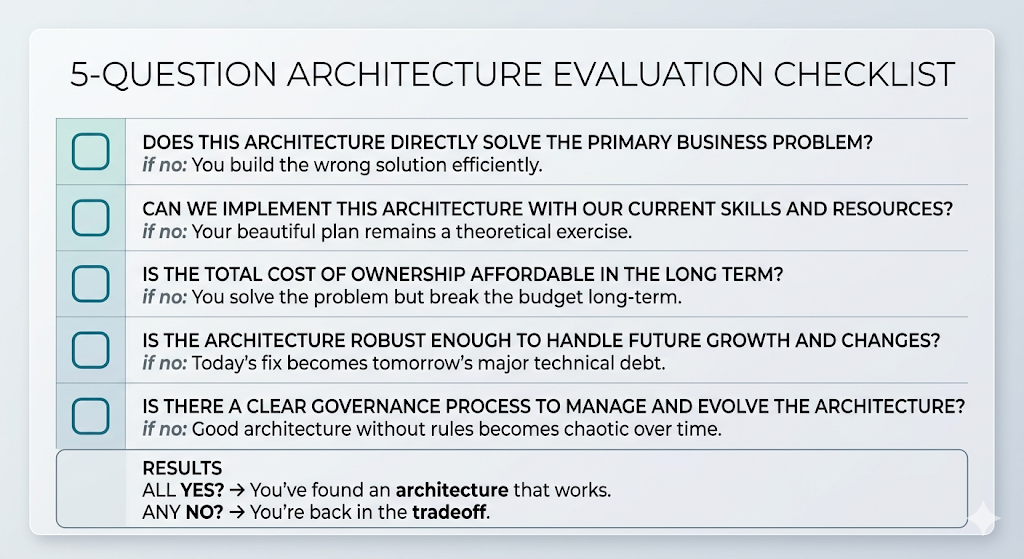
How to evaluate whether your self-service approach will work
Before you buy the next tool, run five questions. If any answer is no, you're back in the tradeoff.
1. Does the data team control the logic? If the business user can change the query or the metric definition, trust will collapse. The analyst must own the SQL, the schema, and the access controls.
2. Can business users self-serve without SQL or BI training? If the answer requires a new tool, a login, or a course, adoption will drop. The answer should arrive in the tool they already live in – for most teams, that's a spreadsheet.
3. Does every number trace to a query the analyst approved? If the AI generates or infers the logic, you have a hallucination risk. Deterministic SQL, not LLM-generated SQL, is the trust boundary.
4. Does it ship in weeks, not months? If the foundation requires a 6-month modeling project, you'll lose executive support and team momentum before you deliver a single report. Publish one data mart today; add the next one when the business asks for it.
5. Does the answer arrive in the tool the user already lives in? If the answer requires opening Tableau, navigating Looker, or learning Power BI, the business user will Slack the analyst instead. Every time.
The architecture that passes all five is data-mart-first. The data team controls the truth. The business user controls the question. Neither side compromises. And the reporting backlog becomes a thing you used to have.
[Start free →](https://www.owox.com/app-signup) Build your first governed Data Mart and see what self-service analytics looks like when neither side has to compromise.
Frequently asked questions


Finally, a tool that doesn't ask business users to learn a new dashboarding UI. Our marketing team already knows Sheets. OWOX just delivers the right data.
Joinable data marts concept was the thing that sold us. We can now use the semantic layer without building one.
Self-hosted the OSS version on Digital Ocean. Zero vendor lock-in. Contributed a Shopify connector back in week two.