
A Step-by-Step Guide to Web Analytics Audit Using Google Analytics 4
Discover essential steps to enhance your web analytics. Learn what to focus on for superior data quality and insightful reports in Google Analytics 4

The business decisions you make are based on the quality and completeness of the data in your reports. Therefore, before you analyze any data, you should take an audit of your website analytics and ensure that your data is collected correctly and you can trust it.
.png)
In this article, we tell you what to pay close attention to while implementing website analytics and what reports you can use to check the quality of your data in Google Analytics 4.
If you require a full audit of your site, you can request OWOX team to handle your measurement audit.
Note: This post was originally published in November 2019 and was completely updated in February 2024 for accuracy and comprehensiveness on web analytics, privacy restrictions and GA4.
Why Google Analytics 4?
Google Analytics 4 is the most popular tool for web-analytics in 2024. There are several reasons for this.
The main reason is that GA4 is free to use.
According to a graph by StatCounter of search engine market shares worldwide from 2017 to 2024, Google is still the leading search engine across the globe. It accounts for more than 90% of all searches.

Google’s main source of income is advertising. Accordingly, it can allocate most of its resources to the development of related tools such as Google Analytics 4 and Google Ads. The main advantage of Google Analytics 4 is that most of the functionality is available in the free version.
Therefore, it’s attractive for both small and medium-sized businesses (large business are required to use paid GA 360 which might be more expensive than other analytics tools)
What is a Website Analytics Audit Using GA4?
A website analytics audit using Google Analytics 4 (GA4) involves reviewing and assessing the correct implementation of Google Analytics 4 on a website to ensure accurate data collection.
It checks for data quality, configuration settings, conversion tracking, and user behavior analysis, with a focus on optimizing data accuracy and reporting. Regular audits are crucial for data reliability, and various tools and checklists, such as Google Analytics 4 Auditor, are available to simplify the process.
Web Analytics Audit Checklist
A web analytics audit is valuable for maintaining data quality, ensuring compliance, and using data effectively to enhance business performance and user satisfaction.
- Ensure Data Accuracy: Verify that the correct data is being collected and that tracking captures all relevant user interactions and events.
- Identify and Correct Errors: Detect and rectify tracking and reporting errors to maintain the integrity of data and analytics insights.
- Privacy Compliance: Ensure data collection methods adhere to current privacy regulations, such as GDPR and CCPA, to protect user data and maintain compliance.
Basically, there are 3 main stages of a web analytics audit:
- configuration & setup audit,
- data collection quality audit,
- data governance check.
GA4 Configuration & Setup Audit
Let’s start with the configuration & setup audit stage that consists of 2 steps:
- Configuration
- Tracking Setup
General GA4 Configuration Checklist
- Correct Timezone tracking allows you to correctly analyze user actions with reference to your time zone.
- Currency must be the same as the currency of your site.
- PII Encryption: personal data such as email, phone number cannot be transferred to GA4 without encryption.
- Cross-domain measurement allows activity to be accurately attributed to a single user as they cross domains. Outbound clicks that would ordinarily trigger an event via enhanced measurement are ignored when the outbound link leads to a domain that you've listed as part of cross-domain measurement.
- Referral traffic includes checking how referral traffic data is transmitted.
- Search term includes checking how information is transmitted from the search on the site
- Custom dimensions and metrics allow you to combine Analytics data with other statistics, such as those from your CRM/ERP. Special parameters can be used as main parameters in your own reports, additional parameters in standard reports, and also as segments.
- UserID setup allows you to associate your own identifiers with individual users, so you can connect their behavior across different sessions and on various devices and platforms.
- Ensure that user input through forms on your site is correctly stored and displayed in the analytics system.
- Cross-device testing ensures data is correctly collected and displayed across devices and browsers to ensure users get a consistent experience.
GA4 Tracking Setup Checklist
- GTM Implementation: setting up website tracking with Google Tag Manager
- Ensure that GTM main code is correctly placed on all of the site pages.
- Ensure that GTM snippet code corretly placed on all of the site pages.
- Check that events are set correctly.
- Setting up tracking with Measurement Protocol lets you send data to GA4 from internet-connected devices like a point-of-sale system that complement your website or app.
- Consent Mode: settings for consent management, and a consent overview.
- If you are already on the server-side, then check the server tracking Implementation.

Data Collection Quality Audit
This stage includes 4 steps:
- E-commerce implementation check,
- Checking e-commerce metrics,
- Source / Medium check,
- Landing Page checks.
E-commerce Implementation Checklist
- Product Impressions: Sending the data about viewed products will help to understand what is the conversion from view to click for each specific product in the context of various lists (catalog, recommendations, popular, etc.)
- Product Clicks: Sending the data about clicks on a product will help answer the question of which of the blocks and on what types of pages users interact most often (i.e. the popularity of the blocks)
- Product Details: Collecting the data about the product card views in the Enhanced Ecommerce format will help you understand the conversion from impression to card transition for each product. Also, the product card is an important step in the user's crow when building a marketing attribution model for your business.
- Product Add to Cart: Collecting the data about adding products or services to the cart is one of the most important steps for building a customer acquisition funnel.
- Product Remove from Cart: Collecting the data about removal of products from the cart will help to highlight an additional segment of users who were interested in the product, but for some reason abandoned it. In such cases, you can set up an additional mailing list for this segment of users.
- Product Add to Wishlist: Collecting the data about adding goods to the wishlist
- Checkout: Collecting checkout data is the most important step in the user acquisition funnel and is involved both in building an attribution model and in email marketing (for example, about an abandoned cart)
- Checkout Option: Collecting the data about checkout options will allow more detailed segmentation of users based on the option selected at the checkout step (for example, payment type, delivery type, etc.)
- Checkout (add_shipping_info): When a user proceeds to the next step in the checkout process and adds shipping information, send an add_shipping_info event.
- Checkout (add_payment_info): When a user proceeds to the next step in the checkout process and adds payment information.
- Purchase: Collecting order data is a critical step in the user funnel, and a core element of the Enhanced Ecommerce module. Responsible for transmitting information about purchased goods, their price and transaction amount, etc. The absence or error in the collection of order data will lead to a critical distortion of statistics in Google Analytics 4.
- Refunds: Collecting the data about returns will allow you to understand the real income (excluding orders that were not redeemed and goods that were returned)
- Promo Impressions: Collecting the data about the views of internal banners will allow you to analyze the effectiveness of each of them and calculate the conversion from impression to click
- Promo Click:Collecting the data about clicks on internal banners will allow you to analyze the effectiveness of banners among site visitors
Checking E-commerce Metrics
- Duplicated Transactions: Duplication of orders leads to an overestimation of the number of goods sold and the income indicator, and hence all indicators, the calculation of which is associated with income: average check, ROAS, ROI, etc. Accordingly, you can overestimate some sales channels and make ineffective decisions based on distorted data.
- Duplicated Revenue: Duplication of revenue leads to an overestimation of the revenue indicator, and hence all indicators, the calculation of which is related to revenue: average check, ROAS, ROI, etc. Accordingly, you can overestimate some sales channels and make inefficient decisions based on distorted data
- Events size < 8192 bytes: Events, the volume of which exceeds the set limit, will not be delivered to Google Analytics 4, respectively, the statistics would be violated.
Source / Medium Check
- Extraordinary Sources in the Source/Medium Report: For example, a large amount of traffic from non-standard acquisition sources (eg. referral), may indicate problems with tracking within the site / application.
- Extraordinary number of (direct) / (none): a large amount of traffic from (direct) / (none) may indicate session breaks when moving between site domain.

Landing Page Checks
- (not set) in Landing Page Report: the (not set) value in Google Analytics reports is an alarm signal that the analytics on your site are configured with technical errors. It is especially important to track the share of such values during the first implementation of analytics and when adding new functionality to the site.
- SPA site pageview tracking: When switching between pages of the SPA site, the page is not reloaded, and therefore it is necessary to track page views using triggers like history.change in GTM, otherwise there will be no complete collection of information about page views.
Data Governance Check
Mixed Case URLs check
Duplicated URLs with Mixed Case check: If the site has the same URLs with different spellings, it is difficult to assess the contribution of the pages to the promotion of the user through the funnel.
Mixed Case Example - 'Example.com' and 'example.com'
Mixed Case and Duplicate Source and Medium check
Source and Medium mixed check: If there are the sources and channels on the site leading the same traffic but with different spellings, it is difficult to assess the contribution of advertising to the promotion of the user through the funnel.
Example - 'Google' and 'google'
Muddled UTM parameters check
Muddled UTM parameters check: Checking UTM markup for incorrect names that do not carry a semantic load.
With the right web analytics setup, you’ll be able to:
- Make Informed Decisions: Leverage accurate analytics data for making well-informed, data-driven business decisions that can drive strategy and growth.
- Enhance Product Experience: Analyze user behavior data to improve the product experience, making it more user-friendly and aligned with user expectations.
- Optimize User Experience: Use analytics insights to enhance the overall user experience on the app or website, identifying areas for improvement.
- Optimization Conversion Rate: Utilize data to identify bottlenecks and opportunities in the conversion funnel, leading to improved conversion rates and better outcomes.
Conducting a Comprehensive Analytics Audit for Your Website
Whether you're conducting an audit of an existing website or embarking on the launch of a new one, these web analytics steps are designed to streamline the process.
It will assist you in defining the essential analytics data to collect, confirming the accuracy of tracking mechanisms, and ensuring strict compliance with security and privacy regulations.
This systematic approach ensures that your data is both reliable and secure, facilitating informed decision-making and regulatory adherence.
Recognize the Data Requirements for Analytics
To determine your analytics data needs, balance collecting enough data to track key performance indicators (KPIs) and avoiding data overload that can harm your website's performance.
Focus on quantitative data like conversion rates and pageviews for performance tracking and qualitative data such as session recordings and feedback for understanding user behavior.
Use Google Analytics 4 Tool to gather and analyze the data relevant to your goals efficiently.
Data Collection
When auditing Google Analytics 4 (GA4), the first step is to confirm data collection by checking the Realtime report for active user sessions.
If no data appears, it suggests an issue with GA4 implementation, which can be done through various methods such as CMS integration, direct coding, or using Google Tag Manager (GTM). For consistency and clean tracking, it's crucial to stick to one implementation method.

Implementing directly in the code involves configuring everything in the source code, whereas using GTM is recommended for better organization and efficient tracking of tags.
Data Accuracy
To ensure data accuracy in your analytics tools, start by validating the tracking code setup to prevent data gaps. Check real-time data to confirm visits are being recorded and watch out for data sampling, which can affect report accuracy.
Consider running a tool-specific audit, like a Google Analytics audit, to ensure correct settings. This comprehensive approach ensures reliable data for informed decision-making.
Data Security
Now, let’s consider Google Analytics 4 settings. The first thing we want to pay attention to is data security. Google has many certificates that confirm its ability to securely store your data.
In addition, Google Analytics 4 has a very simple system for providing access to data at different levels, though many users don’t pay attention to this functionality. Its relevance will depend on the size of your company.
Note: We recommend you check who has access to your data every time you fire or hire a new employee or a partner.
For example, say you work with an advertising agency and give its employees access to 5 or 10 different accounts. Then you stop cooperating with that agency but forget to cut off access to those accounts. As a result, employees of this ad agency can still view your website and ad campaign statistics.
To avoid this, regularly check and update access permissions in GA4. You can do this from the Admin tab by selecting Account Access Management at the account, or property level.

With these settings, you can give each user or agency the rights they need and access to the data required for their work.
Diagnostic Notices
Clicking the bell icon in the upper right corner of Google Analytics opens a window with diagnostics messages. Most users ignore them, but in some cases, they can be very useful.

Google Analytics 4 sends error notifications about
- Exceeding events limits
- Incorrect integration with Google Ads
- Missing UTM parametrs in campaigns
- The presence of anomalies, such as targets for which conversions have suddenly ceased to register.
Try to check such messages, especially those marked red — these are critical errors.
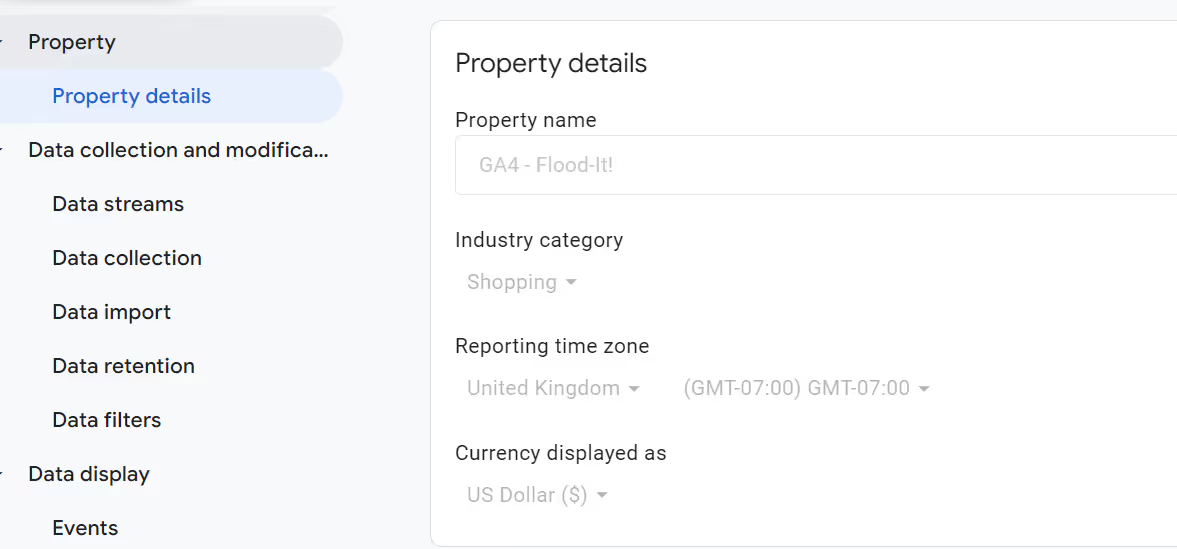
Key Settings of the Property
In the Property Settings, there’s a field called Industry Category that indicates your area of activity. Many companies consider this setting unimportant and ignore it.

However, if you don’t specify an industry category, you won’t have access to templates to create targets in Google Analytics. These templates are tailored to different industries (finance, gaming, real estate, etc.).
UTM tagging of Advertising Campaigns
The next thing to pay attention to is setting up manual or automated tagging of advertising campaigns:
If you specify UTM tags manually, and when traffic enters your account, manual campaigns are given priority. However, if no UTM tag is specified in the URL, the value will be drawn from the automatic markup.
UTM parameters are not configured within Google Analytics 4 itself but are appended to the URLs of your marketing campaigns.
However, the data from these tags is visible in Google Analytics 4 reports. You can view the results of UTM tagging in various reports under 'Acquisition,' where you can break down traffic by source, medium, campaign, etc.

Number of Events Limits in the Property
There’s also a Event Count. It shows how many hits have been transferred from your site to Google Analytics 4 in the last day, week, and 30-day period.
If you see you’ve had more hits in the last 30 days than Google Analytics allows, you need to do something about it. Google Analytics 4 won’t immediately disable your property, but if you ignore this message you run that risk.
Session Timeout
The next setting is the timeout for sessions. A session is a set of user interactions (hits) on your site. If a user performs an action on your site and then doesn’t do anything for a while — i.e., they don’t close your page but simply don’t interact with it — by default, the session will be closed in 30 minutes.
For example, say someone goes to your website, clicks on a few buttons, then goes to the kitchen to make tea and leaves the tab open. If they return and continue to interact with this tab 31 minutes later, Google Analytics 4 will consider it a new session.
But for some sites, the default session timeout of 30 minutes is not appropriate. For example, the duration of one film can be two hours or even longer. So, online streaming services should increase the session timeout. There is no limit to how long a session can last.

In Google Analytics 4 (GA4), you can increase the session timeout duration by navigating to your GA4 property, then going to 'Admin' and selecting 'Data Streams' under the 'Property' column.
Choose your web data stream and click on 'More Tagging Settings', then 'Configure Tag Settings'. Here, select 'Adjust Session Timeout', where you can modify the session duration anywhere from 1 minute, according to your analytics needs.
List of Excludable Sources
In Google Analytics 4 (GA4), the 'Referral Exclusion List' feature allows you to exclude specific sources from appearing in your referral traffic reports.
To configure unwanted referrals in GA4, with Editor role access, go to Admin, select Data streams, choose the web data stream.

Under Configure tag settings, add up to 50 unwanted referrals using match conditions and domain identifiers. Save the settings for immediate implementation.

This is particularly useful in several scenarios:
- Multiple Domains: Exclude multiple company domains to prevent them from being counted as external referral traffic. For example, a main site and a separate shopping cart domain can be listed to ensure accurate referral data.
- Payment Processors: E-commerce sites can exclude third-party payment processors to avoid mislabeling them as referral sources, ensuring referral data reflects true external traffic.
- Social Media and External Authentication: For sites using external logins (like Facebook or Google), adding authentication URLs to the exclusion list prevents them from being counted as referrals.
- Custom Exclusions: Exclude any specific sources you don't want in your referral reports to keep data relevant and accurate.
Custom Metrics and Dimensions
When you create parameters for data, you can select from different levels (access areas) in Google Analytics 4: View, Session, User, and Item. How data is displayed in Google Analytics 4 reports depends on this level.

For a single interaction (a click on a button or link, for example), the data parameters you transfer will mainly be at the View level. That is, you’re directly interested in the parameters of a particular interaction.
For the User ID or its key parameters — for example, age — you must specify the User level so you can see all interactions of the user with this User ID.
The Item level is used primarily for Enhanced Ecommerce events.
For example, if you can have views of five products in one hit. Enhanced Ecommerce events allow you to assign each its own unique value. Accordingly, you can select the Product level and then view your additional settings in Enhanced Ecommerce reports.
The Session level must be selected if you want to distribute the value of any parameter throughout the current user session — for example, in an A/B test.
For instance, say an event occurs during checkout, and you need to attribute all interactions within the session to variant A or B.
A session-level parameter will be attributed to all events within a session, no matter what the user does.
You can view and change the levels of parameters and dimensions in the property settings: Data Display → Custom Definitions –> Custom Dimensions and Custom Metrics.
Pages Tagging
During Google Analytics tag auditing, it's essential to confirm that every page on your website has the correct tags, including the relevant data stream and event codes.
To check this, go to Admin, then navigate to Property → Settings → Data Streams → Web Stream Details → Configure Tag Settings.
Finally, check Tag Coverage under Admin to ensure proper tagging across all pages.

Google Signals

Google Signals involves session data from websites and apps linked to Google accounts, enabling cross-device reporting and remarketing.
While there are valid reasons to disable Google Signals, often tied to privacy laws, this decision should be made internally due to legal considerations.
To activate Google Signals, go to the Property column in your account, navigate to Data Settings > Data Collection, and toggle the Google signals data collection button. Note that you need the Editor designation in your GA4 property settings to utilize Google Signals.
Data Retention
Data retention controls empower you to determine the duration for which Google retains your user data, defaulting to two months in GA4. Maintaining access to historical data is essential for analysis, enabling comparisons between current and past performance and facilitating predictions.
If you primarily use standard reports daily, no adjustments may be necessary. However, for in-depth, long-term analysis, it's advisable to extend your data retention period to a maximum of 14 months.

Other Key Settings
Within Google Analytics 4 (GA4), there is a unified reporting view that receives data from various sources called data streams. These data streams encompass sources such as your website, iOS app, and Android app, and you have the flexibility to include one, two, or all three within a Google Analytics 4 property.
In Google Analytics 4, customization occurs at the property level through the application of filters. Unlike Universal Analytics, which employs view filters, Google Analytics 4 introduces data filters. When implementing a data filter in Google Analytics 4, it is directly applied to a specific data stream, allowing you to tailor the analysis for that particular source.
Before you check your view settings, decide on which view you want to focus on. Before analyzing your reports, make sure you’re satisfied with the completeness of your data.

Filters
In Google Analytics 4 (GA4), the concept of views from Universal Analytics is replaced with a single reporting view fed by data streams. These streams can be from various sources like websites or mobile apps.
Filters in Google Analytics 4 are applied at the property level, affecting the entire reporting view, and are known as data filters. Unlike Universal Analytics, Google Analytics 4 filters are not retroactive; once applied, they permanently alter the data without affecting past data.
Also, GA4 doesn't support creating multiple views for testing, making it crucial to carefully test filters before applying them.
Filters allow you to include or exclude traffic from reports. For example, say you have a website where customers can make purchases and traffic comes from a certain region. At the same time, your company has many employees who also visit the site but are not the target audience.
The first thing to do is to cut out the traffic that employees generate. You can filter it by the IP addresses of your offices or agencies.
You have the option to set up different types of data filters in GA4:
Developer traffic: Thipurchasees you to exclude data generated by developers utilizing debug mode, ensuring that their activities don't skew your analytics.
Internal Traffic: This filter allows you to eliminate data from users with specific IP addresses or a range of IP addresses. This helps in excluding internal traffic from your analytics, providing a more accurate representation of external user interactions.

Timezone
If your business works in a one-time zone, the Time Zone Country setting is not critical to you. If you work in several different time zones, we recommend that you create a separate view for each time zone to analyze your data accurately.
Bot Filtering
In Google Analytics 4 properties, known bot and spider traffic is automatically excluded to enhance the accuracy of analytics. This feature utilizes Google's research and the International Spiders and Bots List from the Interactive Advertising Bureau (IAB). Unfortunately, you can't disable this exclusion or view the exact amount of excluded bot traffic.
Search on Your Site
If you have an internal search on your site, we recommend that you enable site search right away. It will allow you to see what goods and services users are looking for on your site.
Go to your Google Analytics 4 property, navigate to 'Data Streams', select your web data stream, and click on 'Enhanced Measurement' under the 'Configuration' section.
Toggle on the 'site search' option to start the site search automatically.

E-commerce
The next important setting is Enhanced Ecommerce. It will allow you to see the user’s entire funnel on your website. Prior to Enhanced Ecommerce in Google Analytics, there was a standard eCommerce plugin that mainly focused on buying.
With the new Enhanced Ecommerce module, you have the opportunity to trace the entire path through your funnel, from viewing the item to buying it. This allows you to see at what stage users fall out of your funnel so you can prevent them from doing so.
You can also add checkout steps for sites where checkout takes place on more than one page. You can manually name these steps. Next, we’ll take a closer look at the reports that will become available to you after you turn on Enhanced Ecommerce.
Channel Grouping
Google Analytics 4 reports use their own channel grouping by default. Traffic is assigned to a channel by internal system rules.
However, users may find a large proportion of traffic falling into the (Other) group. It could be 20% or more.

Naturally, it’s important for businesses to see and distinguish all channels. To do this, we recommend that you configure custom grouping, minimizing the traffic that falls into the (Other) group.
There are two configuration options:
First, you can make changes to the default grouping (though historical data will remain unchanged).
To ensure that all data (new and historical) is in a single format, however, we recommend that you go with the second option: immediately create a custom grouping of channels according to your own rules.
This setting is within the Data Collection and Modification → Data Display.
Special Email Alerts
Custom alerts are needed to quickly learn about critical changes in key performance indicators on your site. For each business, the KPIs can be different. For ecommerce sites and retailers, the most important KPI will be revenue. For sites that don’t sell things, it will be traffic or a target action.
By defining key metrics, you can configure critical change alerts. For example, you can set an alert when your revenue goes down or up by a certain percentage relative to the previous day, week, or month.
You can set conditions for sending these alerts in the Special Notifications section. Access the complete insights list by clicking 'View all insights' on the Insights card. Access the custom insights list for the property by choosing the 'Manage' option.
Toggle the Email Notifications switch to activate or deactivate email notifications. If you wish to remove an insight, click 'More' and then select 'Delete.'
Read more about this in our article on automating reports in Google Analytics 4.
Here’s the tricky bit! If you look closely at this screenshot, you’ll see that the problem I was notified about happened on March 11, but I didn’t get the alert until March 14. The speed of the notification depends on the indicator you choose.
If delayed alerts won’t work for you and you want to receive notifications as soon as possible, you can use alternative tools to receive notifications about critical changes on your site in near-real time.
For example, you can do this by uploading raw, unsampled data from Google Analytics to Google BigQuery. Then, set up automated reports in Google Sheets using data from Google BigQuery and send them to email.
Now even the free version of GA4 allows you to do this, too. It has automatic integration with cloud storage GA4 BigigQuery Export, in which you can analyze data using SQL.
Once you’ve configured data export, you’ll receive the current day’s data table in Google BigQuery. The data in this table is updated every 8 hours. Accordingly, if a critical change happens in the morning, you’ll only learn about it 8 hours later.
GA4 BigQuery Export also allows you to set up real-time data transfer at an additional cost. In this case, the information in the Google BigQuery table will be updated every 15 minutes, but some parameters will not be available in this table:
- userId
- trafficSource
Or you can use OWOX BI Streaming, which also allows you to transfer data from your website to Google BigQuery almost in real-time.
This option will update your current day table every 15 minutes. In addition, you can see data in the table on the costs of all your advertising sources, which is not the case with Google Analytics 4 BigQuery Export tables.
Plus, OWOX BI has an optional OWOX User ID that allows you to identify users from different domains who have visited your sites.
You’ll be able to know that these are the same users without setting up cross-domain tracking.
You can read more about the differences between OWOX and GA4 in our article on how OWOX BI differs from Google Analytics 360.

Why is it important to have data in near-real time? Because you can respond quickly to critical changes in key indicators on your site.
Naturally, you won’t be able to follow all reports in Google Analytics 4. Therefore, we recommend that you set up separate dashboards for each KPI group and also set up custom notifications.
By opening one dashboard, you’ll be able to see in real-time what’s happening on your site, for what sources revenue has grown, expenses have increased, etc.

In the links below, you’ll find examples of dashboards from OWOX BI that you can use as templates to create your own.
- All-in-One Digital Marketing report template
- Google Analytics 4 & paid channels report template
- Advertising performance & Attribution report for E-commerce
If you want to see additional data on your dashboards. We’ll be happy to help you set them up.
10 Reports to Monitor the Completeness of Acquired Data
Let’s now look at the reports in Google Analytics 4 that you need to monitor to see how complete the information you collect from your website is.
Location Report
Let’s say that recently, many users have been using VPNs to visit your site. If you go to the Reports–> Demographic Details –> Location report and see that your users’ countries are badly out of line with your expectations, there’s no point in focusing on such data.
Because if your business is in Norway and half of your users supposedly come from Uganda, the regional report won’t be too informative.

In such cases, we recommend seeking out alternative ways of collecting data on the region your visitors are coming from.
For example, you can use a dropdown and provides some opportunity for users to choose which city or region they’re in.
- City/Town
- Region
- etc.
This way, you’ll get more accurate statistics without unnecessary noise.
Ecommerce Reports
In the Reports–>Monetisation –> E-Commerce purchase report, you can see how users interact with your products: items viewed, add items to the shopping cart, item revenue etc.
Tracks sales, revenue, and transaction data vital for understanding e-commerce performance.

Purchase Journey Report
In the Reports –>Monetisation –> Purchase journey report, you can see how users interact with your products.
You’ll see the funnel will be filled with users. The first step in the funnel is visiting the site, the second is viewing goods, the third is adding those goods to the basket, the fourth is completing the checkout, and the fifth is buying.

What is the convenience of this report? Immediately in the funnel, you can create segments that are then sent to Google Ads to target specific audiences. For example, if you’re interested in users who have dropped an item in the shopping cart, you can create an audience with those users and target them with certain ads or emails.
Checkout Behavior Analysis
There’s a similar funnel just for checkout. If you define checkout steps during setup, you’ll have access to this report:

You can create segments in this report, too.
In-app Purchase Report
The In-App Purchase Report in Google Analytics 4 provides insights into user transactions within mobile applications. It tracks in-app purchases, helping app developers and marketers analyze revenue, user behavior, and the effectiveness of in-app purchase strategies.
This report is crucial for optimizing monetization and enhancing the overall user experience in mobile apps.

Publisher Ads Report
The Publisher Ads Report in Google Analytics 4 (GA4) offers valuable data on ad performance and revenue generation for publishers.
Monitor essential metrics such as ad clicks, impressions, and earnings, empowering publishers to assess ad effectiveness and make informed decisions to enhance ad placements and strategies for improved monetization.

Product Performance Report
Once you’ve gone through the standard reports and made sure everything is okay, you can create a custom report.
Reviewing the Product Performance report enables you to identify any overlooked steps that still need implementation on your site. You can customize this report in the Exploration section. If you have everything configured correctly, you’ll see this full report.
If any of the steps have zeros, it makes sense to go to your site, double-check your data transmission, and ask your developers to correct any errors so the data is displayed correctly.
Sales Performance Report
You can view a similar report for transactions, showing whether all transaction parameters are passed and whether revenue is passed along with them. To make sure there are no gaps or bottlenecks before you check for errors on the site, look at this report and the completeness of its data.
First, access the Monetization Reports and choose the 'Revenue by order coupon' report. Customize it by selecting 'Transaction ID' as the primary dimension, choosing relevant metrics, and adjusting the visualization.
Save this customized report with a distinct name, like 'Sales Performance Report.' To make it accessible, edit the collection by adding your new report and save the changes.
You can find your custom report in the GA4 menu alongside other standard reports, helping you analyze transaction data effectively.

Pages and screens
Navigate to Engagement > Pages and Screens in Google Analytics 4 and choose the 'Page Title and Screen Class' dimension.
Search for 'Page Not Found' to identify your 404 landing page. As visits to non-existent URLs can have different paths, locating them is challenging, but they share the same Page Title.
Discover the title by intentionally visiting a bad URL on your site, and then, in Analytics, go to the Pages and Screens report, setting the primary dimension to 'Page Title and Screen Class.'
Enter the page title in the search bar to find a report with one row. Add a secondary dimension by searching for 'Page Path' to reveal all bad addresses with at least one pageview. These are your 404 errors. Redirect traffic, create content, or enhance your 404 page. To understand how users reached these pages, investigate if it was through internal links.

Tech details Report
To find your site not working on some devices, a tech details report is used. Engagement and conversion metrics typically differ between devices, with mobile-friendly sites generally showing lower rates and shorter average engagement times than desktop sites.
However, significant variations in engagement and conversion metrics should not be prominent when examining specific mobile devices. If such discrepancies exist, your comprehensive Google Analytics website audit may have uncovered a potential bug that needs attention.

Check for issues by going to the Tech > Tech Details report, selecting 'Device model' as the primary dimension, and applying a filter to show only 'mobile' devices. Look for unusually low Engagement and Conversion rates in the report.
When to Conduct an Audit of the Website Analytics
In general, it's advisable to conduct a web analytics audit under the following circumstances:
- Website Launch or Subdomain Creation: Whenever you launch a new website or subdomain, it's crucial to perform an audit to ensure that analytics tracking is correctly set up from the beginning.
- Major Changes or Redesign: When implementing significant changes or redesigning your website, an audit is essential to verify that the tracking codes and data collection methods still align with your objectives.
- Shift in Business Objectives: If your business changes objectives or priorities, it's a good time to reevaluate your analytics setup to ensure it supports the new goals.
- Adding or Removing Analytics Tools: When you introduce new analytics tools or remove existing ones, it's necessary to audit the setup to maintain data accuracy and consistency.
Given the frequent updates in website technologies and server software, it's advisable to incorporate analytics audits into your regular routine to ensure that your data remains accurate and reliable over time.
Additional recommendations
To reduce manual work and automate everything to the maximum, you can create a checklist of important settings that need to be checked at a certain frequency and run through this checklist once a month, quarter, etc.
Write the date on which you checked the settings, any errors you found, and comments. This way, if your analysts go on vacation or beginners join your team, your specialists won’t have questions and won’t need to study everything from scratch — how everything was introduced and checked — to make changes to a single document.
We also recommend that you create (and regularly update) a separate file where you record all the metrics you collect on your site.
Key takeaways
- High-quality audit = trustworthy data. Before you analyze your data, you need to make sure that it’s collected correctly.
- Regularly check access to your properties to avoid situations where your data is available to individuals who shouldn’t have access.
- Set up daily/weekly/quarterly dashboards to monitor the completeness and quality of data collected. Make auditing more convenient by reducing manual work. Create automatic dashboards with all the metrics you need.
- Configure notifications of critical changes in collected data so you can respond quickly to problems.
- Record all changes on your site so you can easily find the reason for any changes in your KPIs if necessary.
- If you have multiple data sources, consolidate your data into a single repository.
- Give an Analytics 101 session to all your employees. Make sure everyone knows basic things so they can go into the reports themselves and see the information they need without distracting your analysts.
And please, don't forget to share the post with your team!
Frequently asked questions


Finally, a tool that doesn't ask business users to learn a new dashboarding UI. Our marketing team already knows Sheets. OWOX just delivers the right data.
Joinable data marts concept was the thing that sold us. We can now use the semantic layer without building one.
Self-hosted the OSS version on Digital Ocean. Zero vendor lock-in. Contributed a Shopify connector back in week two.