Content
- What is Marketing Analytics?
- Why You Should Use Data Analytics in Marketing
- Who needs marketing analytics?
- Why it’s essential to collect quality marketing analytics data
- What are the common challenges in marketing analytics?
- Benefits of Using Analytics in Marketing
- Top marketing analytics tools & software
- Key Takeaways
Marketing Analytics: Empowering Businesses to Make Data-Driven Decisions
Solomiia Bodnar, Creative Writer @ OWOX
Nowadays, everyone has been talking about marketing analytics. But what is it exactly and why is it so important? Web analytics helps you build the right marketing strategy, optimize costs, increase sales, and accelerate business growth.

In this article, we sort out everything you need to know about analytics in marketing. We’ve collected best practices for marketers who want to decide based on data rather than guesswork.
Note: This post was originally published in December 2020 and was completely updated in December 2023 for accuracy and comprehensiveness on marketing analytics.
What is Marketing Analytics?
According to Gartner, marketing analytics is the process of collecting, analyzing, modeling, and visualizing data to optimize marketing campaigns by better understanding users’ behavior across channels.
Analytics in marketing is also about measuring and optimizing marketing efforts. It helps you assess the impact of marketing on the business as a whole. The principle is to combine marketing data with data from your CRM and ERP systems and consider the impact of all online and offline marketing efforts on your business metrics.
Why You Should Use Data Analytics in Marketing
By applying data analytics in marketing, you can avoid guesswork and pay special attention to unprofitable marketing campaigns, uncover patterns and valuable insights in your marketing strategy, adjust your advertising campaigns, and get more revenue.
The importance of marketing data analytics is illustrated by the following researches:
According to Gartner, 53% of marketing decisions are influenced by marketing analytics.
75% of marketers predict that analytics in marketing will become only more important over the coming two years.
The Marketing Analytics Market size has been valued at $4.6 billion in 2023 and is expected to market expansion of CAGR of 19.5% between 2023-2032.
Data Analytics in advertising and marketing keeps you one step ahead in the game.
How to set up an analytics system and what tools to use depend on the goals you set for your company. But two rules apply to everyone: You should ensure the quality of your data and gather all of your analytics data in one place to have a single source of truth.
Uncover in-depth insights
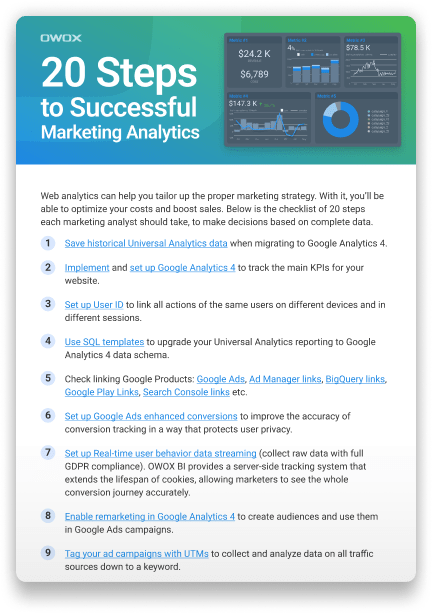
20 Steps to Successful Marketing Analytics
Download nowBonus for readers
Who needs marketing analytics?
Marketing analytics is necessary for all brands who desire to grow. Data is a key for:
startups and small online projects to get heads up;
medium-sized online stores to establish stable growth;
omnichannel retailers and marketplaces to evaluate each and every insight to sell more;
banks, financial companies, telecom companies, restaurants;
Basically, every business which is eager to be on top of its performance.
Examples of Marketing Analytics
Let's explore contemporary marketing analytics examples employed by well-known businesses today.
Netflix: Netflix employs marketing data analytics to analyze patterns in customer behavior and make personalized content recommendations. By comprehending subscriber preferences and viewing habits, Netflix can offer engaging content tailored to individual tastes. This data-driven approach enhances user satisfaction, retention, and overall content engagement on the platform.
Spotify: Another popular example of marketing analytics is how Spotify employs analytics in marketing to introduce its "Wrapped" feature, offering users a personalized snapshot of their listening habits. By engagingly presenting user data, Spotify not only provides value to its customers but also generates content and boosts product usage. This approach capitalizes on customer data to strengthen brand loyalty and encourage social interaction.
Sephora: Sephora leverages customer data to curate personalized digital experiences. This includes offering tailored loyalty rewards, recommending products based on past purchases and browsing activity, and providing a "new for you" section. By customizing the shopping experience to individual preferences, Sephora enhances customer engagement and cultivates brand loyalty.
Spend Smarter, See Results Sooner
Learn how to optimize every marketing dollar with personalized insights from OWOX BI
Why it’s essential to collect quality marketing analytics data
Analytics in marketing starts with quality data. Let's look at some possible points as to why it is important to collect marketing analytics data:
Quality marketing analytics data serves as the foundation for informed decision-making;
Key performance indicators (KPIs) and management decisions rely on complete and reliable data;
Poor data quality leads to erroneous business decisions, resulting in time and financial losses;
Accurate, trustworthy data is essential for optimizing marketing strategies and achieving objectives;
It helps in identifying trends, customer preferences, and areas for improvement;
Reliable data makes you feel confident in decision-makers, improving overall business efficiency and competitiveness;
Timely, relevant, and high-quality marketing data analytics is a valuable asset for organizations in the ever-evolving landscape of digital marketing.
What are the common challenges in marketing analytics?
Building and maintaining marketing analytics is a challenging task, and several barriers can hinder the process.
The marketing landscape is in a constant state of flux, adding to the complexity. Privacy laws are evolving, and in 2024, Google and other internet giants are expected to retire third-party cookies, limiting marketers' access to specific customer data. Marketers are now forced to adapt their strategies to respect privacy laws and find new ways to reach customers.
Data fragmentation and silos are another significant hurdle. While nearly all marketers acknowledge the importance of having a comprehensive, centralized view of cross-channel marketing, a surprising number still assess cross-channel marketing performance in isolation. This fragmented approach results in a lack of clarity regarding the effectiveness of marketing strategies, potentially leading to decisions based on inaccurate assumptions and negatively impacting earnings. Integrating data across departments, teams, and technologies within an organization is a complex task with various technical and logistical challenges.
Gathering marketing data analytics is only one aspect of the challenge. Interpreting the data and translating insights into actionable decisions is equally crucial. Often, the pressure of meeting deadlines and handling other urgent tasks can overshadow the importance of retrospective and forward-looking data analysis.
Another challenge in marketing analytics is maintaining data quality while collecting data. Notably, data loss and sampling issues in Google Analytics can lead to the loss of conversion data and the use of API or aggregated data, potentially resulting in incomplete and inaccurate insights. Simultaneously, attempts to integrate data in tools like Google Sheets and standard databases often result in system failures and subtle errors, undermining the overall reliability of analytics.
Data discrepancies in various advertising services, with differing formats and retrospective changes, can cause discrepancies in reports, impacting the consistency of marketing analytics. These challenges collectively contribute to financial losses and time wastage for businesses, with marketers losing an estimated 21% of their budgets due to data errors.
To address these issues and build a more robust analytics framework, you'll need to automate your entire marketing reporting: from data collection from your advertising services, merging online conversions with costs, attributing revenue to sessions, and finally visualizing all of that on beautiful reports.
Streamline Your Marketing Data in One Place
Connect, manage, and visualize all your marketing data easily with OWOX BI. Say goodbye to manual reports and hello to instant insights
4.9
Benefits of Using Analytics in Marketing
Marketing is not an independent business function. Metrics only have value and meaning when combined with primary business data. If marketing indicators exist in isolation from business data — for example, in Google Analytics 4 — the total value of those KPIs is low.
Now let’s take a look at how marketing data analytics helps businesses.
1. Helps to find and scale Profitable ad Campaigns
Typically, startups and small online projects want to scale profitable campaigns and stop the ones, that don't bring the desired outcomes.
Features
The advertising budget is up to $100,000 a year.
There is no dedicated marketing analytics team on staff yet. These functions are performed by a marketer or agency.
Problems
There is no allocated budget for analytics. Most likely, the budget for advertising is allocated with a horizon of one month.
The annual marketing budget is constantly reviewed because it depends on the operational results of the business.
Decisions are made intuitively due to a lack of data.
Analytics implementation is postponed until “better times.”
Solutions
Study the best market practices: what tools to use, KPIs to calculate, and reports to build first.
Watch the benchmarks. Most of the top ones are known: they are conversions, traffic, and the cost of attracting a customer. Focus your marketing team on surpassing these benchmarks.
Set up advanced e-commerce tracking in Google Analytics 4 and automate reports in Google Sheets.
Automatically import costs from advertising sources into Google Analytics 4. Compare the ROAS of all ad campaigns in one report to efficiently allocate your budget.
Measure CPO and ROAS in GA4
Automatically link your Ad Platforms cost data to Google Analytics 4 conversion data, so you can analyze your marketing KPIs and make fully informed decisions
4.9
Transfer sales information from your CRM to Google Analytics using the Measurement Protocol.
Example of Implementing Analytics in Advertising for Profitability
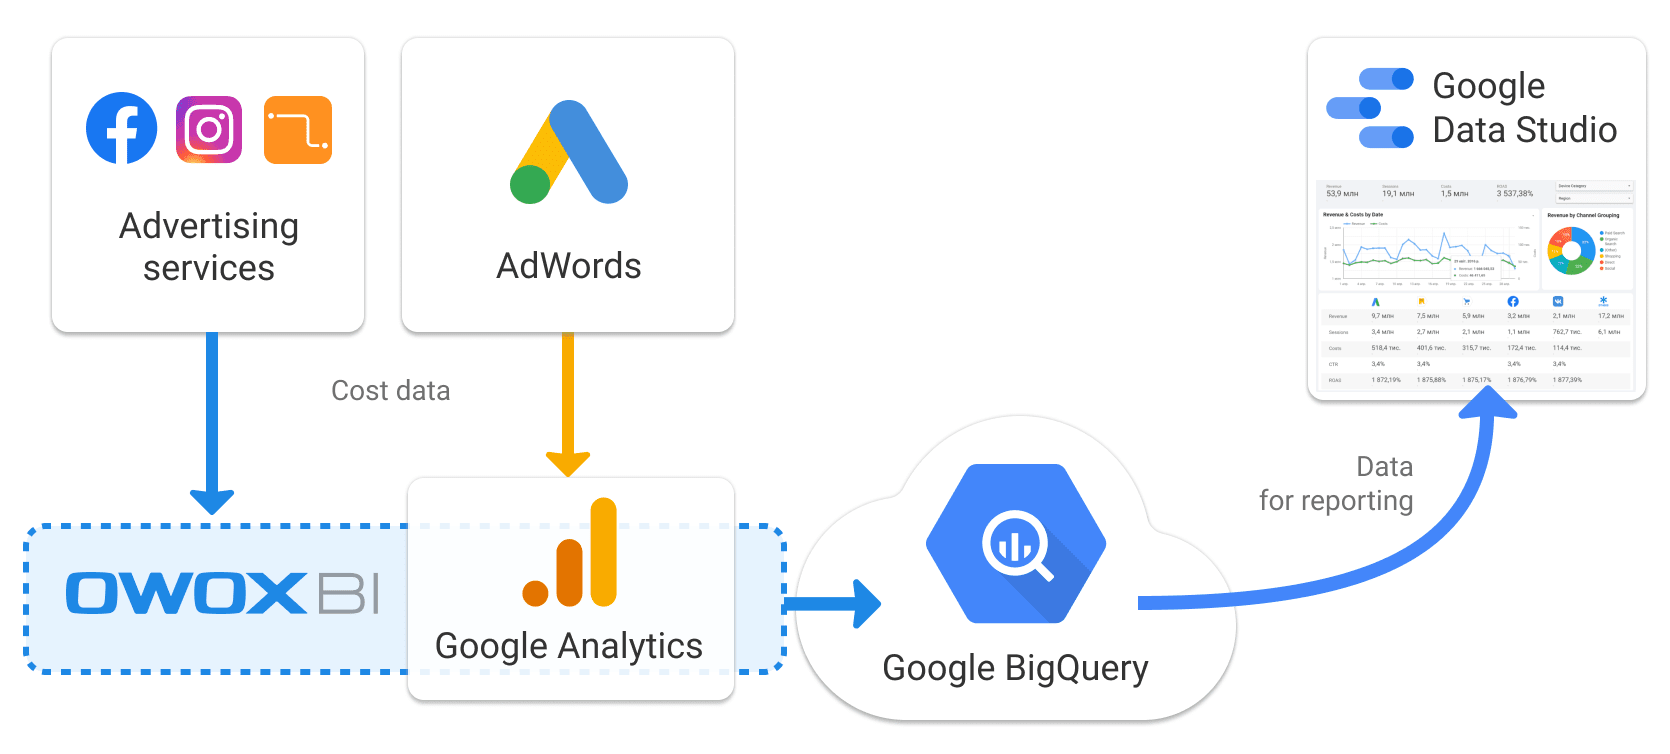
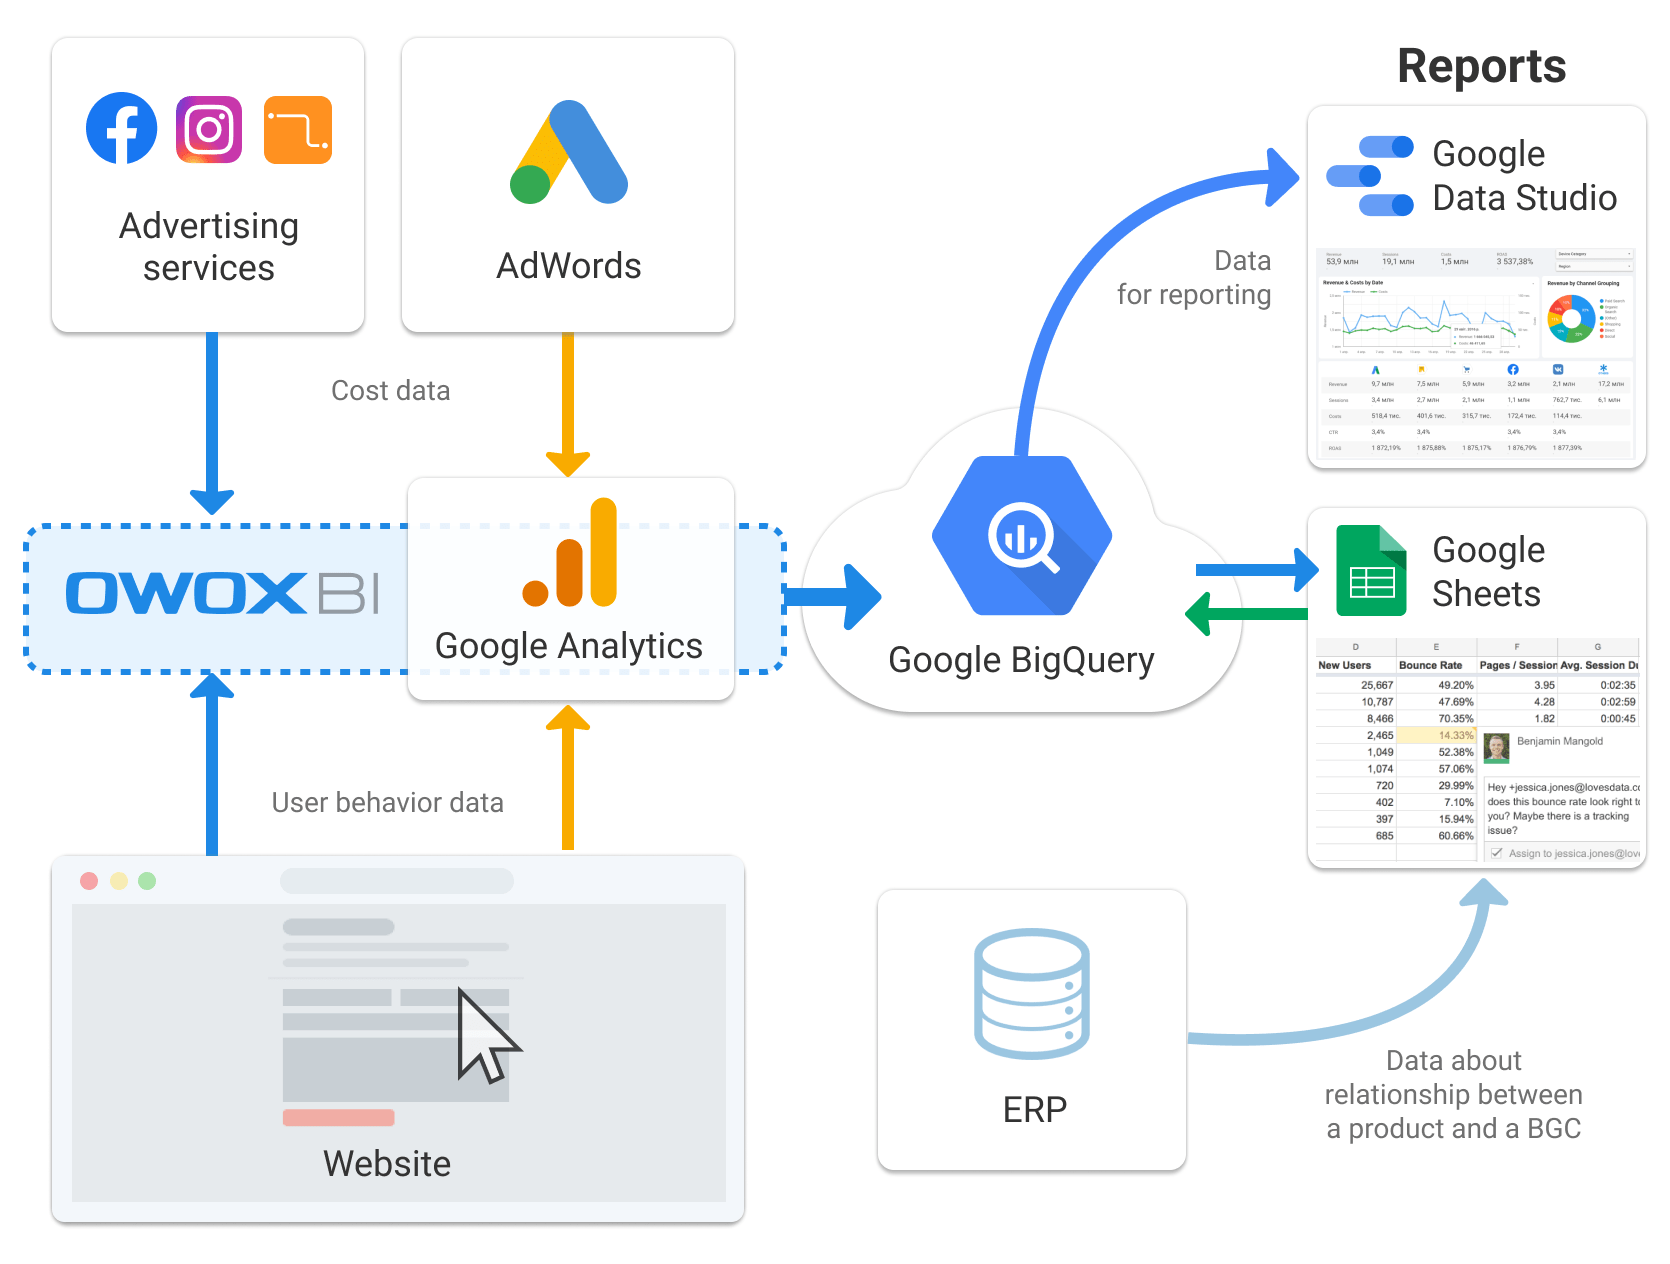
To speed up the process of preparing reports for clients, the digital agency has automated reporting in Looker Studio (ex. Google Data Studio) with OWOX BI.
They have automatically collected all of the expense (ad cost) data from advertising services into Google BigQuery, they've blended those advertising data with conversions data from GA4 with OWOX BI Transformation, and then transferred that data to Looker Studio (Formerly Data Studio) and updated reports without any data specialists required.
Here’s what this data scheme looks like:
This solution isn’t a full-funnel analytics solution with accurate acquisition campaign tracking, but it’s enough to start with.
It allowed the agency clients to get accurate data on advertising campaign performance.
Self-assessment questions
Do you track events and conversions in Google Analytics 4?
Do you know how Google Analytics 4 metrics relate to your business metrics?
Note: Sales metrics such as revenue and profit in the CRM would differ from online data.
Curious how to fix that? Check this out.
2. Helps to Achieve Sales Growth
Medium-sized online stores tend to prioritize sales growth. That’s what helps the store survive. When the profitability threshold is already defined, it’s necessary to maintain the growth rate with the specified CPA or ROAS.
Features
Advertising budget from $100,000 to $1 million per year.
There is an analyst who does not only marketing but also product analytics, business reports, etc.
Problems
Marketing reports are collected manually in Google Sheets or Excel once a week or on demand.
There are not enough resources to implement analytics in marketing. For example, developers or specialists who work with reports don’t have time for analytical tasks.
There is an understandable budget for marketing, but no one separately budgets martech and experiments.
There is a popular belief that to increase sales, it’s enough to attract more traffic simply set up Google Analytics or work with an advertising agency.
To solve these problems, it’s no longer enough to simply transfer orders from your CRM to Google Analytics 4 through the Measurement Protocol.
Dive deeper with this read
GA4 Measurement Protocol: Turning Data Precision into Success

Solutions
Measure online and offline metrics. This will allow marketers to focus their goals and advertising budgets on the company's growth as a whole.
Collect raw data in Google BigQuery cloud storage to combine marketing and business metrics.
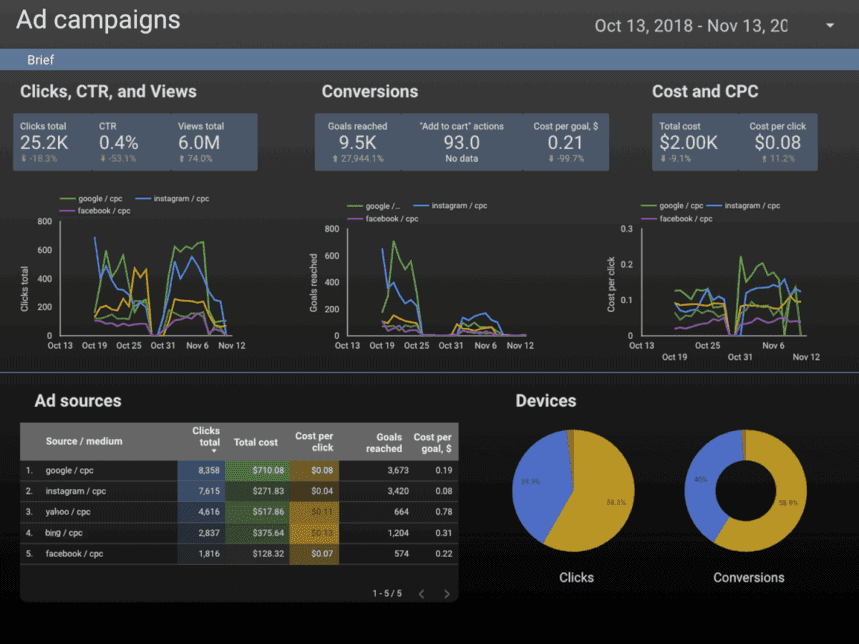
Create a single marketing dashboard that’s available to all members of your team so they can find out at any time what’s happening with advertising campaigns and how the sales plan is being implemented.
A dashboard may not answer all questions, and insights can be generated based on more in-depth data. But at least at the top level, it’s desirable to create a single marketing dashboard.
Example of implementing Analytics in Marketing for Sales Growth
Analysts segment orders by the number of sessions before making these orders (1, 2, 3, 4, and 5+). Long chains of interactions (5+ sessions) are handled similarly to short chains: the first two and the last two sessions are the most important.
During these first and last sessions, a user gets acquainted with the product and makes a purchase decision. The contribution of other sessions is lower, so the rest of the sessions are considered as one item. As a result, marketers receive a dashboard where orders are segmented by advertising source, region, product category, and number of sessions before registration.
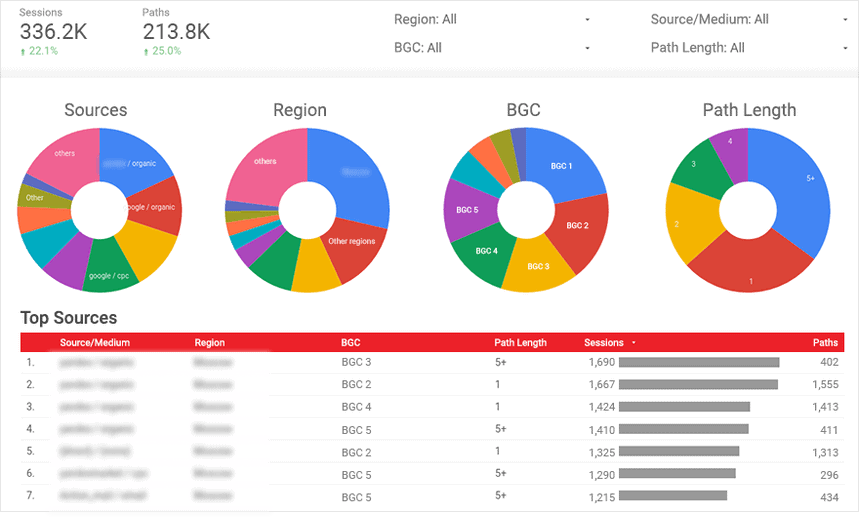
This dashboard gives answers to the following questions:
Which channels are more likely to be triggered at the beginning/middle/end of the funnel?
Which channels are more likely to be triggered in a particular Region segment?
Which Region segment has the largest number of orders?
Self-assessment questions
Do all marketing department employees know how the business evaluates their effectiveness and where they can see the results of their work? Company management shouldn’t require the marketing director to attract new customers or increase ROAS while advertising campaign specialists think their main goal is to increase brand awareness.
Do you know where the data you need is stored and how to use it?
Gain clarity for better decisions without chaos
No switching between platforms. Get the reports you need to focus on campaign optimization
3. Helps to Increase market share and attract new customers
Omnichannel retailers and marketplaces often face this challenge. The goal is no longer just growth but the market share that the retailer occupies. It is measured by external indicators, for example, by GFK. The goals also include attracting new clients.
Features
The advertising budget of $1 million to $10 million per year. The amounts are so high because online advertising brings results not only on the Internet but also in physical stores.
Such businesses already have a marketing analyst. Google Analytics 360 is used by 30% of companies.
Problems
Retailers and marketplaces usually work with several advertising agencies, each of which is responsible for a specific advertising channel.
Marketers who need to increase market share and attract new customers often work with several advertising agencies, and each agency is responsible for a specific advertising channel.
The number of new customers is difficult to measure with Google Analytics: there’s no indication if a user has made an order before. In Google Analytics, a new visit is just a cookie that hasn’t appeared on the site before, so it’s hard to set a goal like new customer orders.
This leads to contradictions between the goals of the advertising service and the business. An ad service analyzes the overall contribution to the business and measures conversions in general. But for the business, it’s important to know who placed the order — a new client or an existing client. You won’t be able to understand this without CRM data.
Analytics is built retrospectively. That is, it looks at numbers when they can no longer be influenced. Plans are made in a table based on expert opinions or, at best, using logistic regression. Market trends are not taken into account.
Focusing only on brand traffic can play a cruel joke on businesses. Yes, driving more traffic leads to more conversions, but this strategy scales poorly.
Evaluating the effectiveness of advertising campaigns doesn’t take into account ROPO sales. This can lead to inefficient solutions: The better an advertising campaign stimulates offline purchases, the more undervalued it looks online. In response, it’s allocated a lower budget, which contradicts the goal of the business to grow overall sales.
The sales and customer information that a company collects in its CRM isn’t enough to grow sales. An internal system lacks data on sessions, traffic sources, and regional breakdowns — everything that allows you to attract a target audience.
Solutions
Collect raw data from your website, advertising sources, CRM, call tracking services, as well as email activity into Google BigQuery so you can link marketing metrics to business goals.
Identify key performance indicators for each online marketing area. For example, the top-level task to attract the maximum number of orders with the given ROAS and CRR can be decomposed into different channels: paid search, social networks, and email.
Mastering Marketing KPIs: How to Evaluate Your Marketing Performance
You'll learn how you can effectively evaluate your marketing performance to fuel your business growth.
Watch the replay
Marketing Ninja @ OWOX
Use Machine Learning Full-Funnel Attribution that matches your business model and takes into account all online and offline user actions and real profit from your CRM while also showing the mutual influence of channels on conversions and user promotion through each step of your sales funnel. Reports based on attribution data allow you to evaluate acquisition channels separately for new and returning customer cohorts and effectively allocate your budget to target cohorts.
Create a forecast for each metric and track its deviation from the plan. Moreover, you should compare not the facts with the plan but the forecast with the plan. If your forecast is automatically updated based on market trends, you’ll learn about risks and growth zones before the plan turns into reality — that is before too much time passes and you’re no longer able to influence it.
Example of Implementing Analytics in Marketing to Increase Market Share
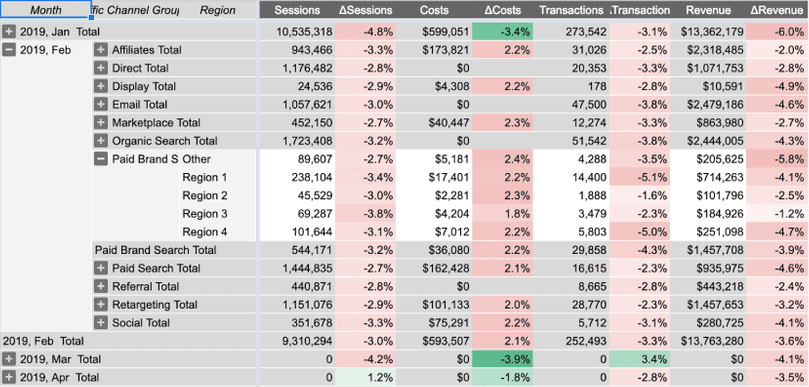
This approach helps companies develop a culture of predictive analytics that allows them to influence the future rather than analyze the past. If you see that the plan is not being fulfilled, you can build a pivot table in advance for those segments and metrics that marketing can influence.
Self-assessment questions
Do you know how digital advertising affects your company’s overall sales?
Do your managers trust the dashboards the marketing department prepares?
How many decisions do you make based on predictions, not facts?
4. Helps to Increase the number of applications from the site
Separately we will focus on larger businesses: banks, fintech brands, telecom companies, etc. They also include restaurants to some extent if their job is to create a stream of customers who fill in application forms on the site.
Features
A large number of calls and leads are received from the site. It is not net income.
For online in such businesses, less than 20% of the total advertising budget is allocated to analytics. Most of it goes to TV, outdoor advertising, and online — works as support.
Paid GA (Google Analytics 360 - which is still limited compared to Streaming) is used by only 22% of companies that spend more than $100,000 a year on advertising. Most of the other are still rely on Free GA4, which samples the reports data.
Problems
Requirements of security service. Since the work is with finance and personal data, any changes in tracking systems and data services should be confirmed with a security service.
You can only change something on the site in Q5. The resources of the team that implements changes on the site are very limited. Marketing needs to make many prompt changes to the site. And for telecom companies and banks, this most often involves approvals and large-scale plans.
There is a misconception that online is not needed, as it does not make a significant contribution to the business.
Solutions
Save Client ID to internal requisition database.
Upload the result and value of online applications to Google BigQuery. You must use an anonymous requisition ID to upload. Personal data is certainly not needed here, even a financial result is optional. But some criterion is needed that will compare the value of applications with each other, for example, on a scale of one to five.
5. Helps to Increase the speed and quality of decision-making
This goal is relevant for all data-driven companies.
Analytics helps marketers:
Quickly find a common language with colleagues from other departments, argue opinions, and focus on common goals.
Save time. Previously, it was necessary to spend hours compiling tables with data from different sources in Excel. Now, you can get a report in Google Sheets, or Google Looker Studio (Formerly Google Data Studio) in just a few clicks.
Strengthen the team with ad-hoc reports. Each employee can receive effective reports so they can see the results of their efforts, make timely decisions, and adjust advertising campaigns.
If you want to build an effective marketing strategy but don't know where to start, book a free OWOX BI demo.
Top marketing analytics tools & software
One way to choose marketing analytics tools is to scroll through ratings websites. On these sites, you can find analytics tools for marketing with many different capabilities and at many different price points, but you won’t find all marketing analytics software available on the market.
Analytics Tools for marketing that aren’t connected with big corporations and don’t solve a particular problem may be not included. Also, you should remember that universal marketing analytics tools might not fit your needs, especially if they’re free. And expensive tools aren’t necessarily worth buying, because you may not use all the functionality.
OWOX BI
OWOX BI is an all-in-one analytics tool for marketing that collects data from all kinds of sources for any kind of business, merges marketing data neatly and clearly, and prepares reports based on collected data, including forecasts, data-driven attribution, and predictions.
With OWOX BI, you can tune your marketing mix more efficiently, implement instant reporting, send triggered emails, check the quality of website pages, find the growth zones of ROI, and decrease ad costs.
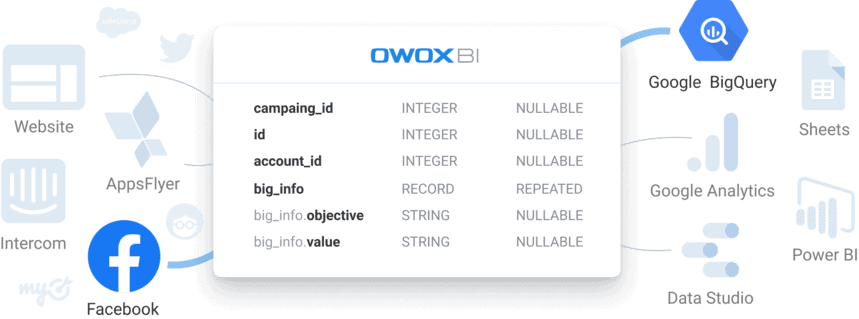
OWOX BI is a pain reliever for companies in retail, e-commerce, finance, SaaS, and other domains.
HubSpot Marketing Hub
The master of inbound marketing, HubSpot changed the game in 2006 and has grown significantly since then. Today, HubSpot Marketing Hub is one of the most famous all-in-one marketing, sales, and service tools. It even includes a free CRM. HubSpot integrates with Salesforce, though some popular online ad services (for example, Twitter) are not supported. At the end of the day, HubSpot can’t honestly be considered one of the best marketing analytics tools because its analytics features play only a supporting role.
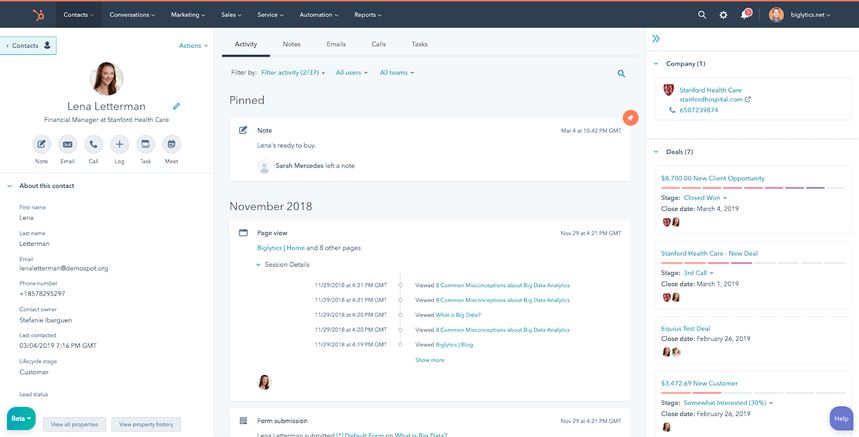
HubSpot is designed mainly for small and medium-sized businesses with the aim of marketing automation. There’s a free basic version, and the Starter plan costs $120 per month.
Looker Studio
Looker Studio is a robust and versatile marketing analytics tool that offers a variety of features to help businesses optimize their marketing strategies by analyzing and visualizing data. Looker Studio facilitates a myriad of marketing analytics tasks, aiding in detailed analysis and visualization of Google Ads campaigns, connecting to various data sources, and enabling seamless report sharing among teams. Its integration with numerous platforms and the provision of compelling metrics empower marketers to optimize campaigns, make data-driven decisions, and effectively convey insights to stakeholders.
Tracking website traffic and engagement
Measuring the effectiveness of marketing campaigns
Identifying trends and opportunities
Making data-driven marketing decisions
Looker Studio is a cloud-based platform so that it can be accessed from anywhere. It is also highly customizable so that businesses can tailor it to their specific needs.
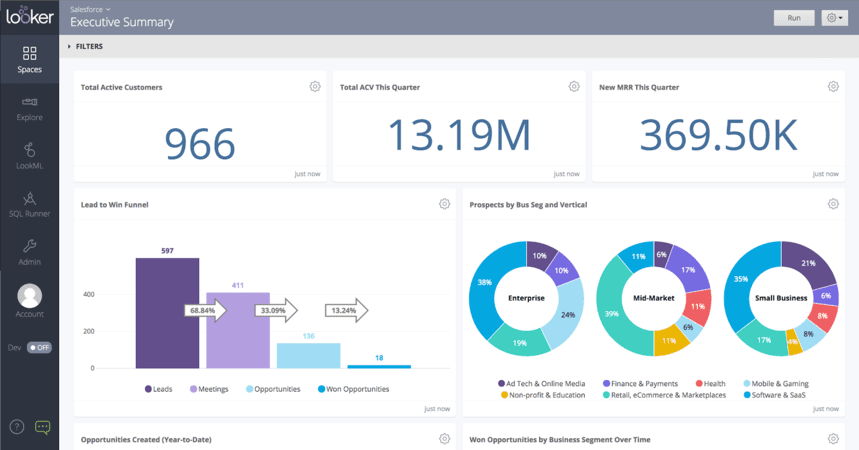
Looker Studio is often used by medium-sized businesses and enterprises that are ready to introduce BI systems. A free version is available.
Mailchimp
Mailchimp, founded in 2001, is one of the most famous email service providers. It’s no surprise that the company has created a full-fledged marketing platform. This platform is considered one of the best among digital analytics tools for its unique abilities to analyze your audience from email and other channels, help you enhance your content according to your brand demands, and help you launch improved ad campaigns.

Mailchimp’s all-in-one marketing platform is built around email marketing and aims to help small businesses grow. So if your strategy includes a lot of email communication, try out Mailchimp. There’s a free version, and paid versions start from $9.99 per month.
Insider
Insider focuses on funnel and conversion optimization, A/B testing, and personalization of the customer experience.. Support is a strong side of this service. Also, Insider has strong marketing data analytics capabilities for reviewing results. The killer feature is predictive segmentation, which is key for efficient personalization.
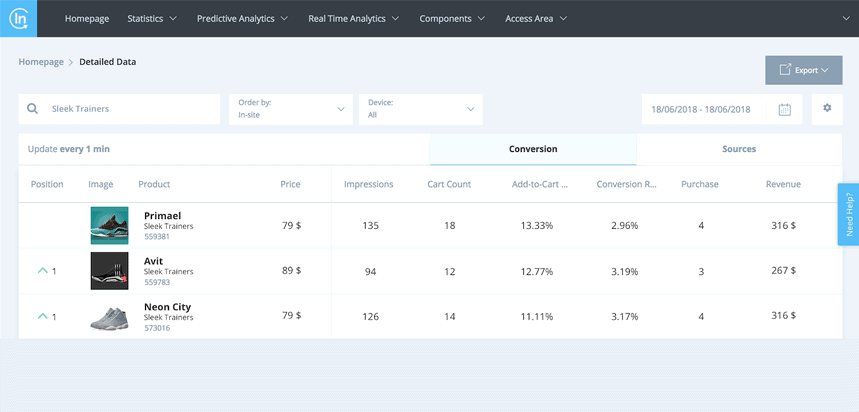
Reviews on G2 Crowd suggest that Insider is created for medium-sized and large businesses. The pricing is unclear, however, as it’s not published on their website.
Adobe Analytics
Adobe Analytics stands out as a robust marketing analytics solution, delivering a holistic perspective of digital marketing endeavors. It encompasses real-time reporting, advanced segmentation, and customizable dashboards, empowering users to monitor pivotal performance metrics and customer interactions. Features like path analysis, A/B testing, and data visualization facilitate website and campaign optimization. Harnessing machine learning and AI for predictive analytics, Adobe Analytics aids in foreseeing user behavior. It prioritizes data security and cross-device tracking, ensuring its effectiveness for businesses of all scales, delivering valuable insights, and boosting ROI.
Pricing varies as Custom analytics packages customized according to your business needs
Key Takeaways
Marketing is like pinning the tail on the donkey. Analysts remove the blindfold and show you what’s in front of you. What matters isn’t the mere availability of reports but the fact that they’re built on complete and accurate marketing data analytics and not only analyze the past but predict the future.

Transform your marketing data into actionable insights
Learn how to optimize every marketing dollar with personalized insights from OWOX BI
FAQ
-
What are some benefits of using marketing analytics for businesses?
Benefits of using marketing analytics include increased ROI, improved customer engagement and retention, better understanding of customer behavior, identification of under-performing campaigns, and informed decision making based on data-backed insights. -
How can businesses effectively use marketing analytics to improve their marketing strategies?
Businesses can effectively use marketing analytics by regularly monitoring and analyzing data, identifying trends and patterns, setting achievable goals, and adjusting strategies based on insights gained from the analysis. -
What are some commonly used marketing analytics tools?
Some commonly used marketing analytics tools include Google Analytics, Adobe Analytics, Hubspot, Moz, SEMrush, and BuzzSumo. -
What is a marketing analytics practice?
A marketing analytics practice involves using data analysis and tools to evaluate marketing strategies, measure performance, and make data-driven decisions to enhance marketing campaigns. -
What skills do you need for marketing analytics?
Skills for marketing analytics include proficiency in data analysis, knowledge of marketing techniques, statistical analysis, proficiency in data visualization, and experience with analytics tools. -
How can businesses measure the return on investment (ROI) of their marketing efforts using marketing analytics?
Businesses measure ROI in marketing by calculating the revenue generated from marketing activities and comparing it to the costs incurred, providing a clear indication of profitability. -
What are some key performance indicators (KPIs) that businesses should track through marketing analytics to evaluate the effectiveness of their campaigns?
Key performance indicators (KPIs) for marketing analytics include conversion rate, customer acquisition cost, customer lifetime value, click-through rate, and website traffic, helping evaluate campaign effectiveness. -
What are the ethical considerations and potential challenges associated with collecting and analyzing customer data for marketing data analytics purposes?
Ethical considerations in marketing analytics involve respecting data privacy, obtaining consent, ensuring data security, and avoiding discriminatory practices. Challenges include data quality, compliance with regulations, and potential bias.
