Table of contents
- Google Analytics 4 E-commerce Tracking vs Universal Analytics
- What to track?
- How to set up Enhanced E-commerce in Google Analytics
- Troubleshooting Common Issues in Enhanced E-commerce Tracking Setup
- The different funnels in reports: what’s the difference, and why do you need them
- How to track product returns and refunds in Google Analytics 4 reports
- Limitations in collecting data in GA4
- Online merchandising: Product List Performance
A Comprehensive Guide to Set up Enhanced E-commerce Tracking in Google Analytics 4
Kirill Bezyazychnyj, Web analyst at OWOX
If visitors to a physical store keep asking: "Where do I find the headphones?" you can put headphones out right in front of the entrance :). But wait, how does that resonate with your online store?
- How do you know which pages were viewed before a purchase?
- Which products are most often bought, and which products are most often removed from shopping carts?
- How effective are internal banners at promoting sales on your website?

Enhanced E-commerce tracking in Google Analytics 4 can help you answer all of the questions above. You’ll be able to map your customers’ journey from the very first visit to a conversion event - typically a sale. For example, you can:
- Uncover how many times a particular product was purchased.
- Group your products into product lists, such as Recently Viewed Products, Related Products, and New Products.
- Use these product lists to represent merchandising blocks and see how these blocks perform.
- Create segments based on product brand names, customer behavior, etc., and target your campaigns towards these segments.
- Send the campaign name to Google Analytics 4 as an additional parameter. This will enable you to see how your internal promotions are performing and measure the impact promo campaigns and special offers have on conversion rates for certain product groups.
Note: This post was originally published in May 2017 and was completely updated in January 2024 for accuracy and comprehensiveness on marketing analytics.
Google Analytics 4 E-commerce Tracking vs Universal Analytics
GA4 and Universal Analytics differ in their approach to e-commerce tracking. GA4 uses different schemas for tracking, such as 'item_name' instead of 'name' in Universal Analytics. The article provides a detailed comparison table for these schemas. Let us see some differences here:
Feature/Aspect | Google Analytics 4 (GA4) | Universal Analytics (UA) |
Data Model | Event-based model | Session-based model |
E-commerce Event Names | Different naming conventions (e.g., view_item_list) | Traditional naming (e.g., impressions) |
Event Parameters | More detailed and customizable | Less flexible, standard parameters |
Product Details Tracking | More comprehensive (e.g., item_name, item_id) | Standard product details (e.g., name, id) |
Promotion Tracking | Uses view_promotion and select_promotion | Uses promoView and promoClick |
Cart Interaction Tracking | Detailed interactions like add_to_cart | Basic interactions like addToCart |
Checkout Process Tracking | Detailed steps like begin_checkout, add_shipping_info | Standard checkout process tracking |
Purchase and Refund Tracking | Detailed tracking with purchase and refund events | Basic tracking with similar event names |
Product List Interaction | Tracks product list views and clicks in detail | Less detailed tracking of product list interactions |
Customization and Flexibility | Highly customizable and flexible | Less customizable, more rigid structure |
Product List Attribution | Lacks direct product list attribution | Direct product list attribution is available |
Checkout Measurement | Simplified checkout tracking, no steps | Detailed checkout steps tracking |
Product Data | Expanded product data, including multi-level categories | Basic product data, single-level category |
Promotion Data | More detailed promotion data | Basic promotion data |
Action Data | Richer action data, including shipping and payment info | Basic action data, less detailed |
Item-scoped Custom Dimensions | Supports up to 27 custom parameters in the items array | Limited support for custom dimensions |
Migration from Enhanced E-commerce | Supports Enhanced E-commerce data model to some extent | Original Enhanced E-commerce model |
Event Names | Specific event names carry semantic weight | Less emphasis on specific event names |
Setting Fields in GTM | Manual parameter population required | Built-in E-commerce integration in GTM |
Trigger Configuration in GTM | Custom event triggers based on dataLayer pushes | Standard E-commerce triggers |
Below, we’ll explore how to set up Enhanced E-commerce in Google Analytics 4 using Google Tag Manager.
What to track?
Before setting up Enhanced E-commerce tracking, decide what activities you want to get data for. These include
- Product views on a category page.
- Clicks on products.
- Product pageviews.
- Add and remove products from carts.
- Viewing internal promotion materials: banners, videos, pop-up windows, etc.
- Clicks on banners.
- Checkouts. The checkout process can also be broken down into steps: filling out contact details, delivery, payment information, etc., and tracking with a separate funnel.
- Purchases.
- Refunds.
How to set up Enhanced E-commerce in Google Analytics
You can send data from your website to Google Analytics using various tools such as,
- Google Tag Manager (GTM): A tool for easily adding and managing code snippets for tracking and analytics on your website.
- Global Site Tag (gtag.js): A JavaScript tagging framework for adding GA4 tracking directly to your website's code.
- Google Analytics 4 Data Streams: Setup within GA4 for tracking websites, mobile apps, and other digital platforms.
- Google Analytics Measurement Protocol: An API for sending raw user interaction data to Google Analytics, useful for tracking offline or complex interactions.
- Third-Party Tag Management Solutions: Tools like Tealium or Adobe Launch for integrating and managing analytics tags.
- CMS or E-commerce Platform Plugins: Plugins are available in various CMS and e-commerce platforms for easy GA4 integration.
- Mobile App SDKs (like Firebase): For integrating GA4 tracking in mobile apps.
In our opinion, the best tool for getting E-commerce data to Google Analytics 4 is Google Tag Manager. It makes it easy to add and update tags and code snippets on the website without involving developers.
Uncover in-depth insights
Comprehensive Guide: Set up GA4 Tags using Google Tag Manager
Download nowBonus for readers
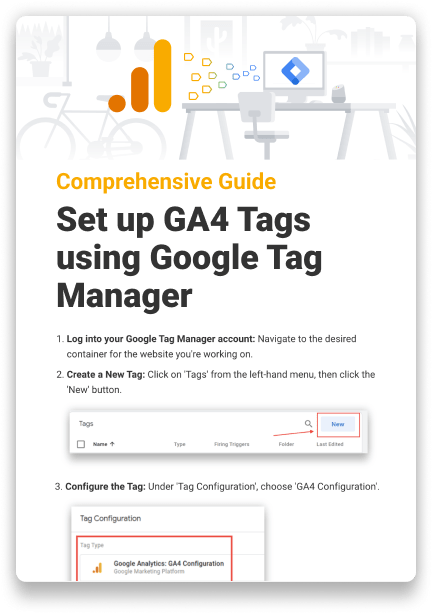
In this article we’ll be talking about this way to collect data. Let’s take a closer look at each step of Enhanced E-commerce Tracking.
Step 1: Get Google Analytics 4 and Google Tag Manager Ready
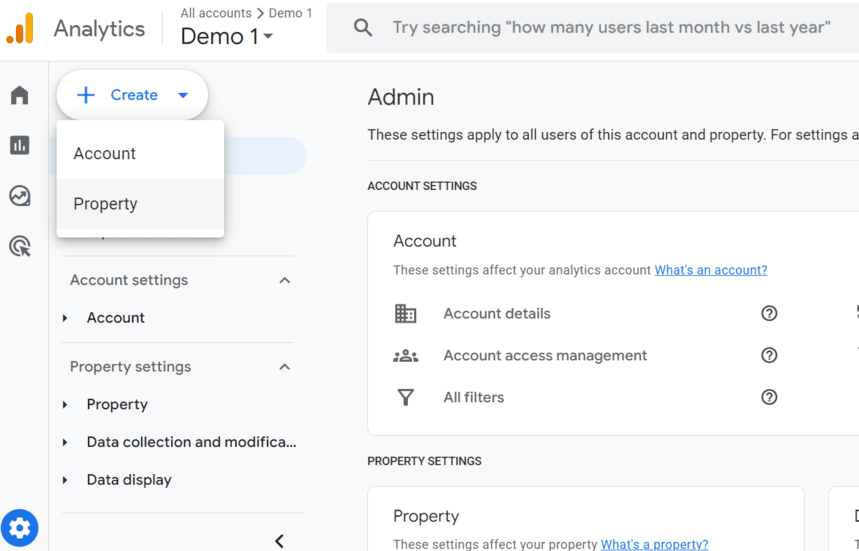
Create a Google Analytics Account: If you don’t have one, go to the Google Analytics website and sign up. It’s like creating a profile for a new game.
Set Up a GA4 Property: Inside Google Analytics, create a new property. This is where all your website's data will be collected. It's like setting up a base camp for your treasure hunt.
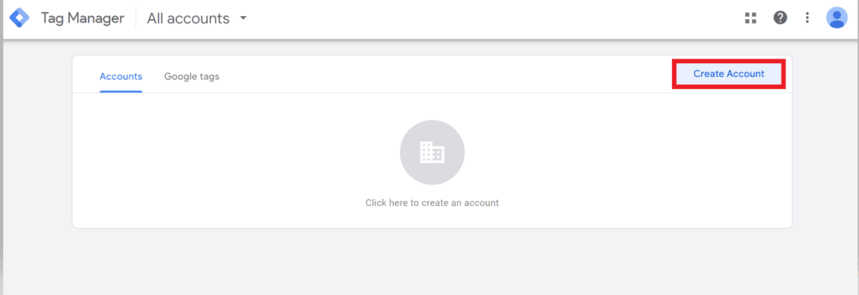
Sign Up for Google Tag Manager: Go to the Google Tag Manager website and create an account. This is like getting a map and tools for your treasure hunt.
Step 2: Install GTM on Your Website
You'll get a GTM code snippet. Place this code in the and (as instructed) of your website's HTML.
Step 3: Implementing the Data Layer
Understand the Data Layer: This is a bit like a digital diary that keeps track of what happens on your site (like someone viewing a product).
Implement the Data Layer: This requires adding JavaScript code to your website. If you're not comfortable with coding, you might need a web developer's help. This code will update the Data Layer with information about the user's interactions.
Push Information to the Data Layer: For each E-commerce action (like viewing a product list or clicking on a product), you need to push relevant information to the Data Layer. This includes details like product name, ID, price, brand, category, etc.
Step 4: Configuring the Data Layer Variable in GTM
Log into GTM: Go to your Google Tag Manager dashboard.
Create a New Variable: Click on 'Variables' > 'New.'
Set Up the Variable: Name your variable (e.g., 'GA4 E-commerce DataLayer') and select 'Data Layer Variable' as the type.
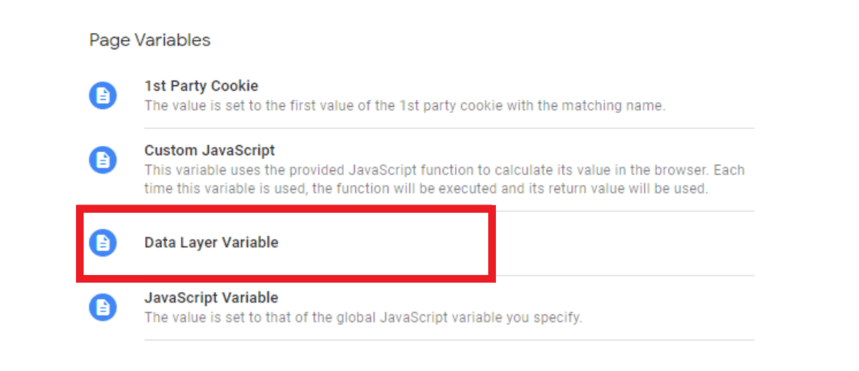
Specify the Data Layer Variable Name: Enter the name that matches the key in your Data Layer push. For example, 'E-commerce.items' if you're tracking E-commerce items. After setting up the Data Layer variable, you'll create tags and triggers in GTM to send this data to GA4.
Step 5: Configuring Google Analytics 4
Creating a Data Stream: Navigate to 'Admin' → ‘Property Setting’ → ‘Data collection and modification’ → 'Data Streams' and select your web stream.
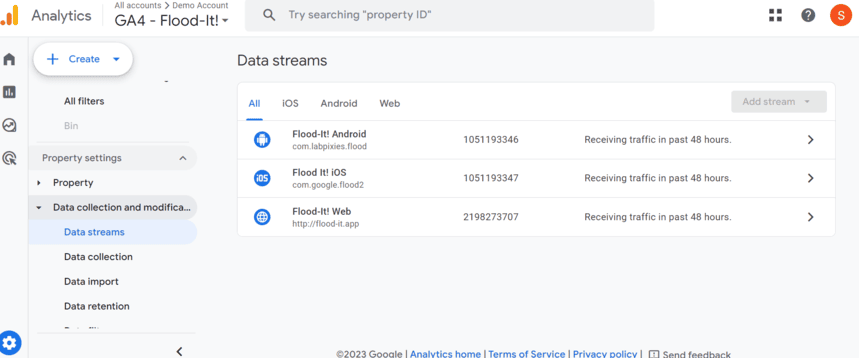
Enable E-commerce Settings: In the stream details, turn on 'Enhanced Measurement' and ensure that 'E-commerce' is enabled.
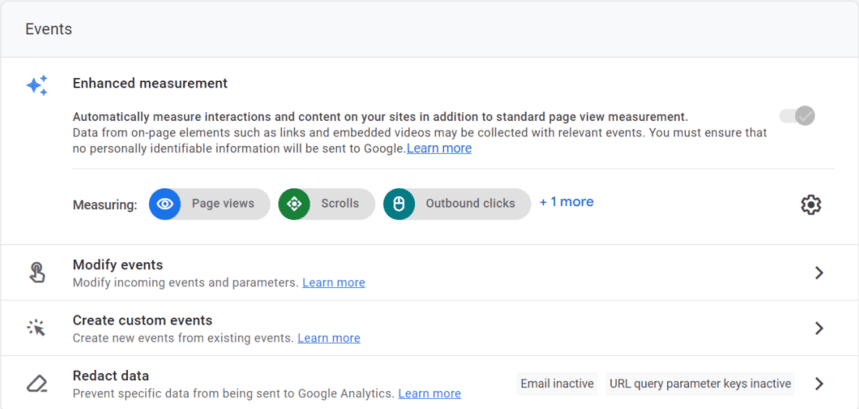
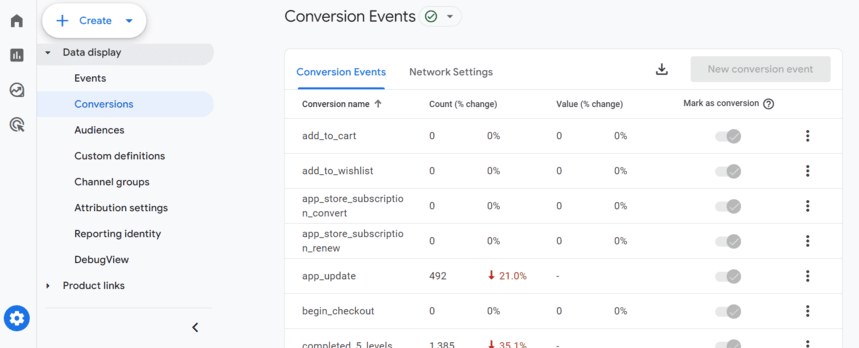
Setting Up E-commerce Events: List events like 'view_item', 'add_to_cart', 'begin_checkout', etc. Go to 'Events' in Google Analytics 4 and mark these events as 'Conversion' if necessary.
Step 6: Create Tags for E-commerce Events
For each E-commerce event, create a new tag.
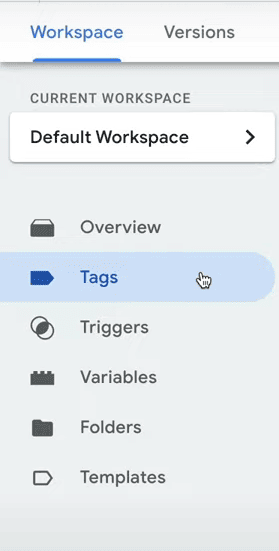
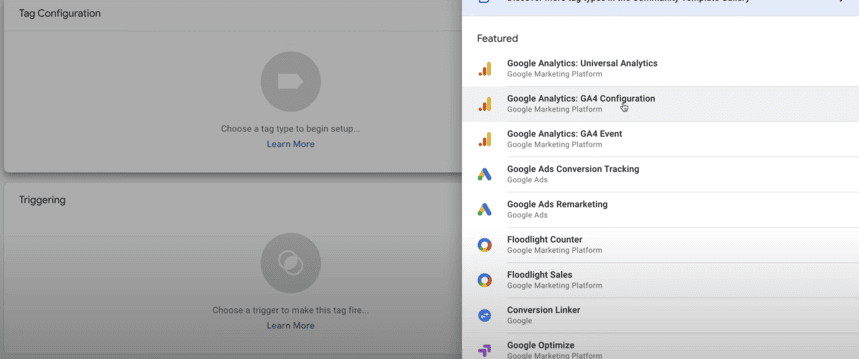
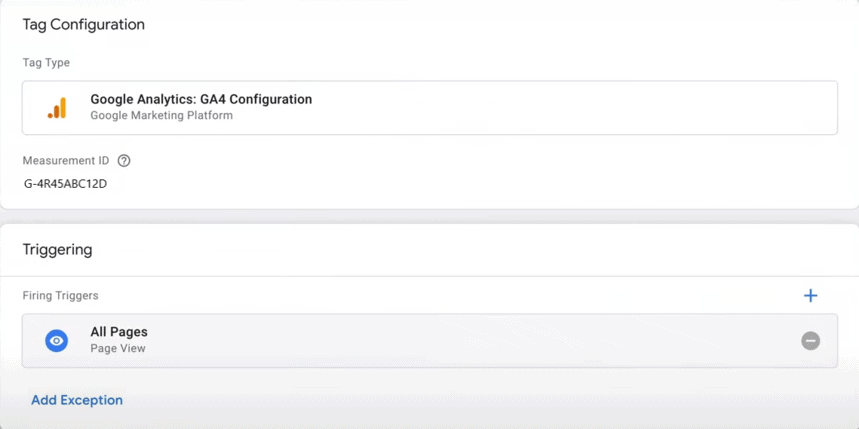
Configuration Tag: Select your GA4 Configuration Tag. Create a new tag for Google Analytics 4 E-commerce. Choose ‘Google Analytics: GA4 Configuration’. Enter your Measurement ID from Google Analytics 4 (found in your GA4 property under Data Streams).
Set Up Triggers: Create triggers that fire these tags. For instance, a trigger for 'add_to_cart' might be a click on the 'Add to Cart' button. Choose ‘All Pages’.
Step 7: Enable Enhanced E-commerce Tracking in GA4
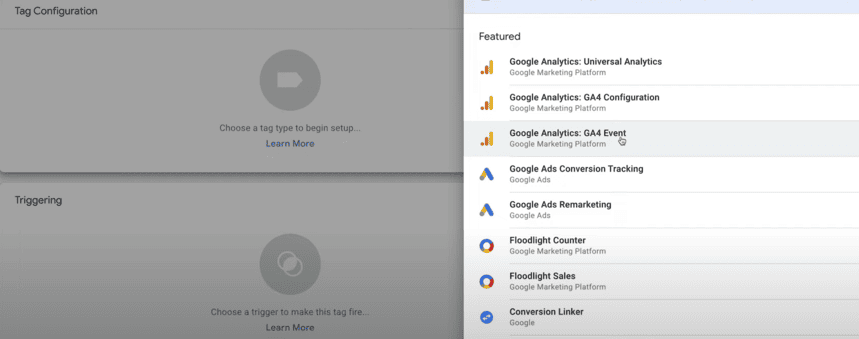
Create Tags for E-commerce Events: For each E-commerce event, create a new tag. For example ‘GA4 E-commerce’.
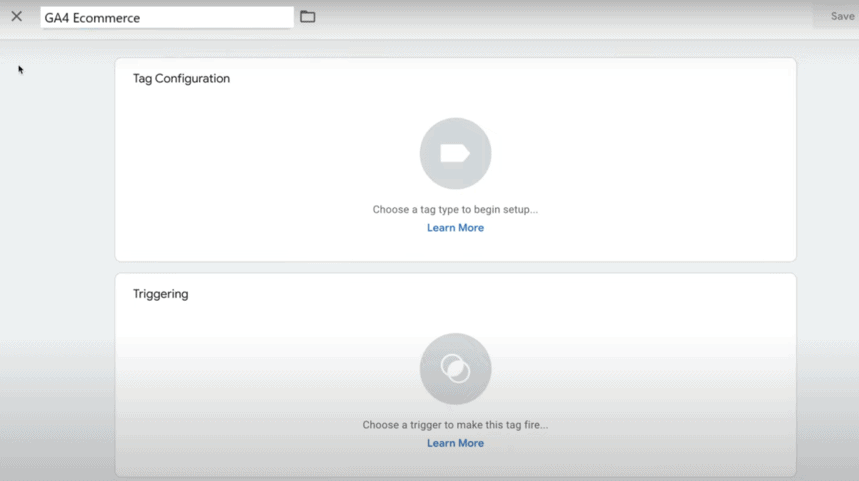
Tag Type: Choose 'GA4 Event'.
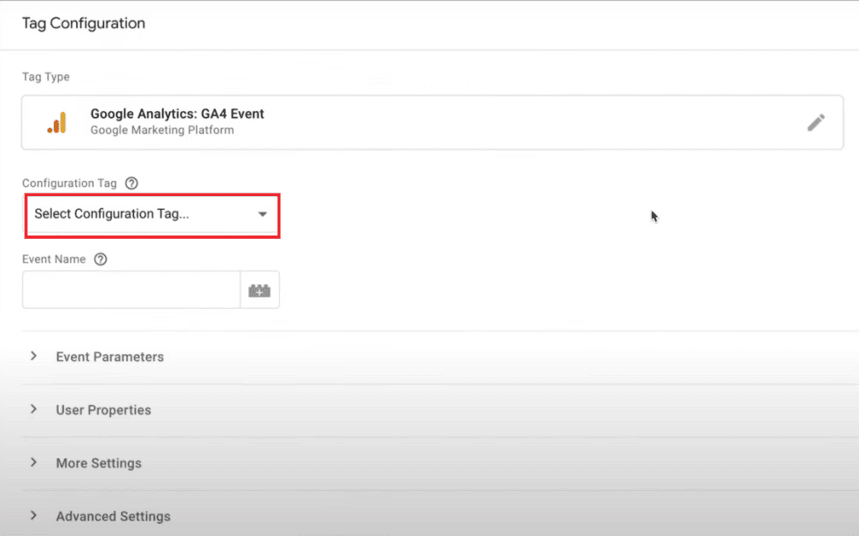
Configuration Tag: Pick your GA4 Configuration Tag. Choose the 'GA4 E-commerce | page view' tag that we've established.
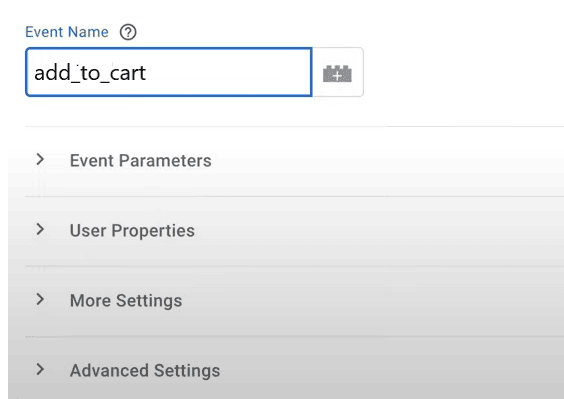
Event Name: Enter the corresponding event name (e.g., 'add_to_cart'). Create new tags for different E-commerce events like view_item, add_to_cart, begin_checkout, etc.
Alternatively, you can utilize a variable that dynamically transmits the type of E-commerce action to our event tag. This allows you to employ a singular tag for sending various E-commerce events such as 'add to cart,' 'purchase,' and others to GA4.
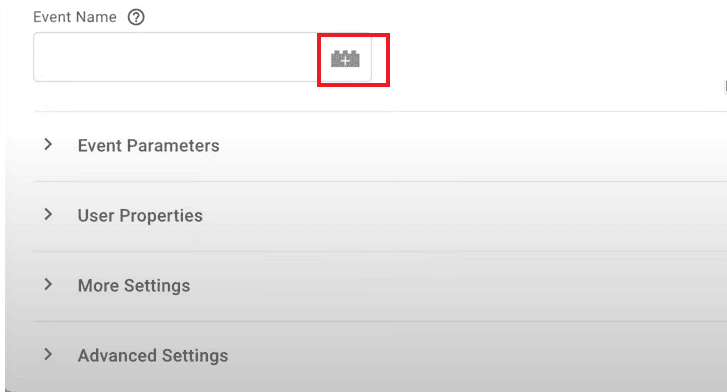
Event Parameters: Add relevant parameters like 'currency', 'value', 'items', etc. We have the ability to create custom events using the following icon.

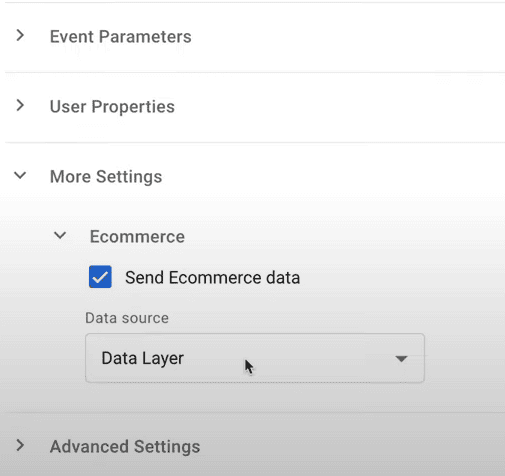
Proceed to select 'More settings', enable the 'Send E-commerce data' option, and keep the Data layer selected. This ensures automatic retrieval of E-commerce details from the data layer, transmitting them alongside our event to Google Analytics 4.
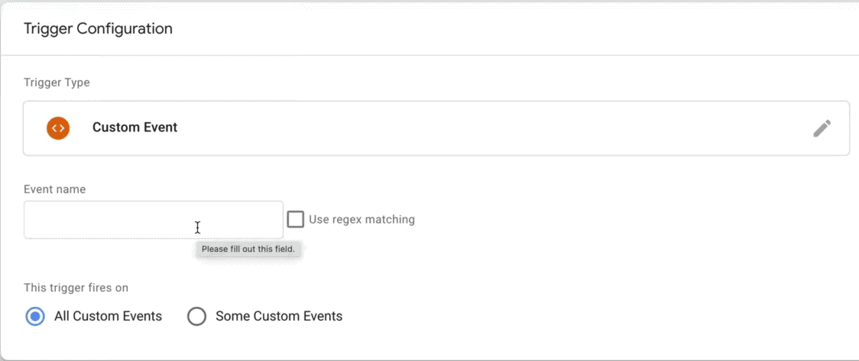
Set Up Triggers: Create triggers that fire these tags. For instance, a trigger for 'add_to_cart' might be a click on the 'Add to Cart' button. Go to Trigger Configuration→ Custom Event. Enter the data layer event name → enable the ‘User Regex Matching’ option so that ‘_’ will be considered as regular expressions. Google has a list of recommended E-commerce events separated by ‘_,’ and we can enter them all in custom event names. As a final step, ‘save’ the trigger and ‘save’ the tag as well.
Step 8: Testing Tags
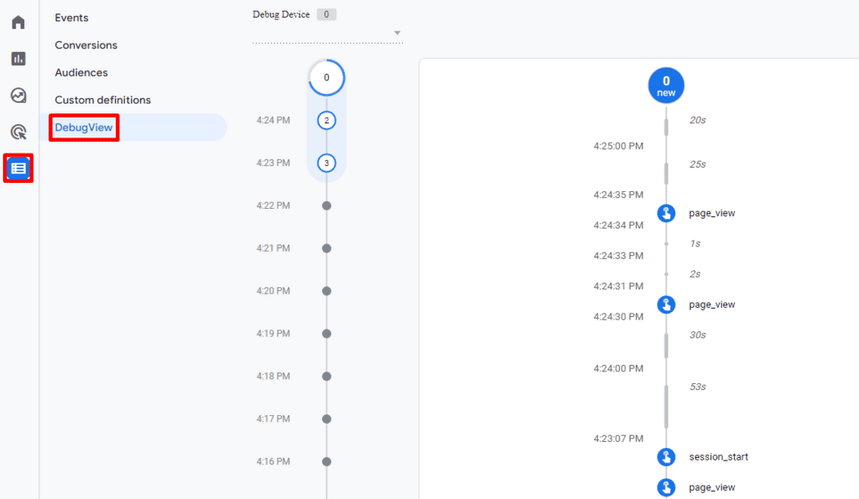
Preview Mode: Use GTM's preview mode to test your tags. Select the "Preview" option located in the top-right corner of the Google Tag Manager interface. This activates the Preview mode, allowing you to inspect how tags fire on your site in a test environment. Open your website in a fresh browser tab. The Preview mode will display debug information, showing you which tags are fired and allowing you to confirm that they are working as expected. We can use ‘Debug view’ in GA4 to preview the reports.
Check-in GA4: Verify that events are being recorded in GA4's real-time report. Go to the "Reports" segment and choose "Realtime" to access live data. Perform actions on your website that trigger the events you've set up in GTM (e.g., clicking a button or making a purchase).
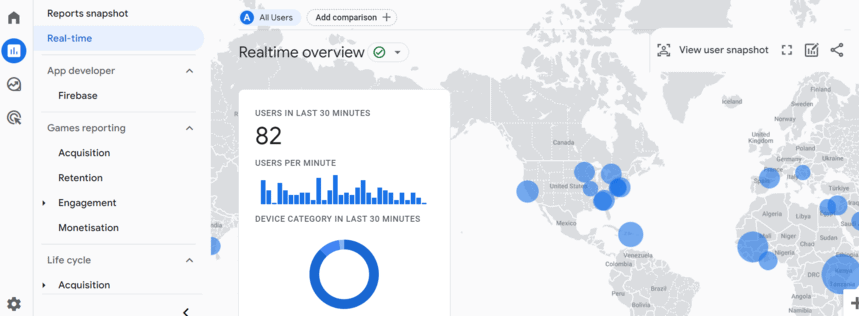
In the GA4 Real-Time report, you should see these events being recorded almost instantly. Verify that the events match your expectations and that data is flowing correctly from your website to GA4.
Troubleshooting Common Issues in Enhanced E-commerce Tracking Setup
1. Data Not Appearing in Reports
- Verify that the Enhanced E-commerce features are enabled in Google Analytics 4 settings.
- Check if the tracking code is correctly implemented on all relevant pages of your website.
- Ensure that E-commerce data is being pushed to the Data Layer correctly.
2. Mismatched or Inaccurate Data
- Confirm that the product IDs in Google Analytics 4 match those on your website.
- Check for pricing, quantities, or product name discrepancies between your website and GA4 reports.
- Ensure currency settings are consistent across your website and Google Analytics.
3. Missing Transactions or Events
- Verify that the E-commerce tracking code triggers on the thank-you or confirmation page after a transaction.
- Check for any JavaScript errors on the confirmation page that might prevent the tracking code from executing.
4. Duplicate Transactions
- Implement a mechanism to prevent the resending of transaction data if a user refreshes the thank-you page.
- Use unique transaction IDs for each purchase to avoid counting the same transaction multiple times.
5. Inconsistent Add-to-Cart or Checkout Data
- Ensure that add-to-cart and checkout events are correctly implemented and triggered.
- Verify that event triggers are firing correctly in Google Tag Manager if used.
6. Product or Category Performance Data Issues
- Check the accuracy of product category and product variant data being sent to GA.
- Ensure that product SKUs and names are consistently used across the site.
7. Refund Data Not Accurate
- Confirm that refund events are correctly implemented and triggered when a refund occurs.
- Check the accuracy of the refund amount and associated product details being sent to GA.
8. Enhanced E-commerce Features Not Working in GTM
- Ensure that Enhanced E-commerce features are enabled in the GA4 Configuration tag in GTM.
- Verify that all E-commerce-related triggers and tags are correctly set up in GTM.
9. Session and User Data Mismatch
- Investigate any discrepancies between session data and E-commerce data, such as unusually high per-session value.
- Check for issues in user tracking implementation, such as cross-domain tracking problems.
10. Debugging with Real-Time Reports
- Use GA4’s real-time reports to test and debug E-commerce events and transactions.
- Monitor the real-time E-commerce data immediately after implementing changes or during testing phases.
Uncover in-depth insights
Checklist: Google Analytics 4 Audit
Download nowBonus for readers
The different funnels in reports: what’s the difference, and why do you need them
After implementing Enhanced E-commerce via Google Analytics 4 (GA4) and Google Tag Manager (GTM), delve into a variety of funnel reports that deliver crucial insights into customer behavior and assess the efficiency of your E-commerce infrastructure. These funnels are crucial for understanding how users interact with your site, from initial engagement to final purchase. Here are the types of funnels you can expect to see:
1. Shopping Behavior Funnel
Overview of User Journey: Tracks how users move through the shopping process, from viewing products to completing a purchase.
Stages: Typically includes stages like 'Product View', 'Add to Cart', 'Checkout Initiation', and 'Transaction'.
Insights: Helps identify where customers drop off in the shopping process, allowing for targeted improvements.
2. Checkout Funnel
Detailed Checkout Process: Analyzes user progression through the checkout stages.
Stages: Can include 'Billing and Shipping Information', 'Payment Information', 'Review Order', and 'Purchase'.
Insights: Useful for pinpointing issues in the checkout process that may be causing cart abandonment.
3. Product Performance Funnel
Product Interactions: Examines how users interact with specific products.
Stages: Includes 'Product Views', 'Add to Cart', and 'Purchases'.
Insights: Identifies popular products or those with high drop-off rates, guiding inventory and marketing strategies.
4. Customer Loyalty Funnel
Repeat Purchases and Engagement: Focuses on customer retention and repeat purchases.
Stages: Involves 'First Purchase', 'Second Purchase', and subsequent purchases.
Insights: Highlights the effectiveness of loyalty programs and customer engagement strategies.
5. Conversion Path Funnel
Multi-Channel Attribution: Tracks the various paths customers take before conversion.
Stages: Includes different touchpoints like organic search, paid ads, social media, etc.
Insights: Offers a comprehensive view of how different marketing channels contribute to conversions.
6. Abandonment Funnel
Cart and Checkout Abandonment: Focuses on where and why customers abandon their carts or checkout process.
Stages: Identifies points like 'Added to Cart' but not 'Checked Out', or 'Checked Out' but not 'Purchased'.
Insights: Crucial for understanding barriers in the purchasing process and for devising strategies to reduce abandonment.
7. Product List Performance Funnel
Product List Interactions: Analyzes how users interact with product lists or categories.
Stages: Includes 'List Views', 'Product Clicks', 'Product Detail Views', etc.
Insights: Useful for optimizing product placements and category layouts.
8. Promotional Campaign Funnel
Promotion Effectiveness: Assesses the impact of marketing campaigns and promotions.
Stages: Tracks user interaction with promotional content, leading to purchases.
Insights: Helps in evaluating the ROI of marketing campaigns and in planning future promotions.
9. Refund and Return Funnel
Post-Purchase Behavior: Focuses on post-purchase activities like refunds and returns.
Stages: Tracks 'Purchases,' 'Returns Initiated,' and 'Refunds Processed.'
Insights: Aids in understanding product satisfaction and the effectiveness of return policies.
10. Cross-Sell and Up-Sell Funnel
Additional Purchases: Analyzes customer behavior in response to cross-sell and up-sell strategies.
Stages: Includes initial purchase followed by additional product recommendations and subsequent purchases.
Insights: Helps in optimizing product recommendations and increasing average order value.
These funnels in Google Analytics 4, powered by Enhanced E-commerce tracking, provide a wealth of data that can be used to optimize your E-commerce strategy, increase conversions and revenue, and ultimately improve user experience. Remember, the specific funnels and their configurations can vary based on how you set up Enhanced E-commerce tracking and the unique aspects of your E-commerce business.
How to track product returns and refunds in Google Analytics 4 reports
Part of the orders placed on the website might not be completed. Your customers might return their purchases or simply not pick them up. What can you do, considering that you can’t change the data already sent to Google Analytics 4 while refunds and cancellations distort the statistics?
In such cases, you can send refund information to Google Analytics 4. This will not affect the revenue data received before, but you’ll be able to take into account the amount of refunds and their number in the reports.
The refund data can be sent to Google Analytics 4 in two ways:
- Automatically use the Measurement Protocol if your company’s developers have time to configure automatic data transfer. By the way, you can download a detailed guide on how to send missing data about orders to Google Analytics 4 via the Measurement Protocol.
- Manually, using the Data Import. This approach is more time-consuming and has its own nuances and limitations, such as you can only issue refunds for transactions not older than 6 months, and different upload files must be used for full and partial refund types. To learn more, read about Refund Data Import in the GA4 Help Center.
- To track refunds in Google Analytics 4, set up Enhanced E-commerce tracking, then modify your website to push refund events, including transaction and product details, to the Data Layer. In Google Tag Manager, create a GA4 Event tag for refunds and set a trigger for these events. Test the setup, and monitor refund data in GA4's Monetization reports for accurate financial insights.
Limitations in collecting data in GA4
1. Data Sampling:
- Occurs in advanced analysis (e.g., funnels, paths, segment overlap) when data exceeds 10 million counts. Reports based on sampled data may not be fully accurate or representative.
- Strategy: Use smaller date ranges or simpler reports to reduce sampling, and cross-reference with other data sources for validation.
2. Data Freshness:
- Data processing takes 4-8 hours, an improvement over UA but still delayed.
- Strategy: Plan for delays in data-driven decision-making, especially for time-sensitive actions.
3. Privacy Compliance:
- Google Analytics 4 collects personal data and is subject to US data surveillance laws.
- Strategy: Stay updated with privacy regulations, use anonymization features, and consider additional consent management for EU users.
4. Server Location:
- No control over data hosting; subject to international data transfer laws.
- Strategy: Understand legal implications for your business and explore additional data protection measures.
5. Lack of Support:
- No dedicated support or onboarding from Google.
- Strategy: Leverage community forums, third-party consultants, or training resources for assistance.
6. Raw Data Access:
- Requires BigQuery, which comes at an additional cost.
- Strategy: Evaluate the cost-benefit of using BigQuery or explore other analytics tools offering raw data access.
Online merchandising: Product List Performance
Proper showcasing helps increase sales. For example, buyers most often pay attention to the shelves at their eye level. Therefore, if there are products you want to sell first, it’s better to place them on such shelves.
How does that translate to your online store? How do you know which "showcases" and "shelves" on the website have the most products sold? Use the Product List Performance report to measure the performance of merchandising blocks on the website. The report is available in the Monetisation → Goals group of reports.
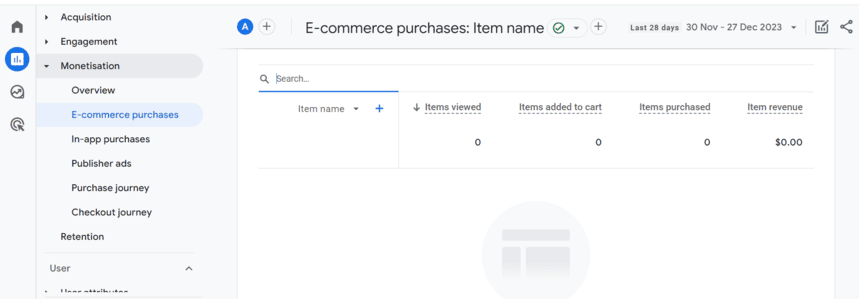
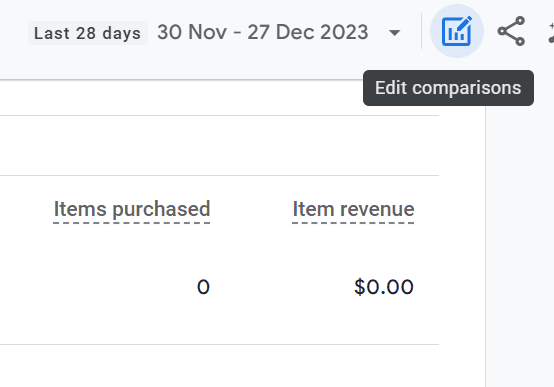
The report shows what blocks are viewed most often, products in what blocks are most often clicked on or added to shopping carts, and what product lists have the highest conversion rates and contribute to sales. You have the option to personalize the report by selecting 'Edit Comparisons,' and you can also share the report as needed.
It’s important to pay attention to how Product Attribution works, in other words, how to correctly send data with the dataLayer. This will help see correct information for each product block and accurately attribute value from product lists that users interacted with before making a purchase.
It’s not necessary to send the list attribute (list) with every E-commerce activity. For example, a user visits a product page A, sees a product B in the "Often bought together" list, clicks on it, and makes a purchase — all the shopping activities in one session. In this case, it’s enough to specify the list attribute for the first action, i.e., the first interaction with the list. Google Analytics 4 will then associate the list attribute to all the funnel steps in the user’s journey to buying product B. More information about Product Attribution can be found in the Google Analytics 4 Help.
Measure CPO and ROAS in GA4
Automatically link your Ad Platforms cost data to Google Analytics 4 conversion data, so you can analyze your marketing KPIs and make fully informed decisions
4.9
Thanks for reading! We’ve prepared some more useful information for afterward :) Enter your email address, and we’ll send a detailed guide to getting offline data (such as data about order fulfillment and purchases made over the phone) to Google Analytics 4 via the Measurement Protocol.
FAQ
-
How can I troubleshoot problems in Enhanced E-commerce Tracking?
To troubleshoot Enhanced E-commerce Tracking issues, first ensure that Enhanced E-commerce is enabled in Google Analytics settings. Verify the correct implementation of tracking codes on all relevant pages and check that e-commerce data is accurately pushed to the Data Layer. Use Google Analytics 4 real-time reports and browser developer tools to inspect network requests and identify any discrepancies or errors in data collection and reporting. -
How to set up E-commerce tracking in Google Analytics 4?
To set up E-commerce tracking in GA4:- Enable Enhanced E-commerce by creating custom events for E-commerce actions.
- Configure these events with relevant parameters for accurate data capture.
- Monitor and analyze E-commerce data in GA4 to optimize your online store's performance.
- GA4 is vital for E-commerce due to its advanced tracking capabilities and integration with Google tools.
- Enable Enhanced Measurement tracking by toggling on the "E-commerce" option in your web data stream settings.
-
How do you enable enhanced measurement tracking in Google Analytics 4?
To enable Enhanced Measurement tracking in GA4, go to your GA4 property, navigate to "Data Streams," select your web data stream, and click on "Enhanced Measurement" under the "Configuration" section. Toggle on the "E-commerce" option to start tracking E-commerce events automatically. -
Why is GA4 important for E-commerce?
GA4 is crucial for E-commerce because it offers advanced tracking capabilities like Enhanced E-commerce, cross-platform user tracking, and better integration with other Google tools. It provides deeper insights into user behavior, helps optimize marketing efforts, and ultimately leads to improved sales and revenue in the competitive E-commerce landscape. -
What is the main difference between standard e-commerce tracking and enhanced e-commerce tracking in GA4?
The main difference between standard E-commerce tracking and Enhanced E-commerce tracking in GA4 is the level of detail and flexibility. Enhanced E-commerce provides granular insights into shopping behavior, such as product impressions, clicks, promotions, and more, allowing you to analyze and optimize your E-commerce website's performance more effectively. -
How to track E-commerce data in GA4?
To track E-commerce data in GA4, you'll need to create custom events for each E-commerce action you want to track, such as product views, cart additions, and purchases. Configure these events with relevant parameters like "item_id," "item_name," and "value" to capture E-commerce data accurately. -
How do I enable enhanced E-commerce in Google Analytics 4?
To enable Enhanced E-commerce in Google Analytics 4 (GA4), you need to create custom events for E-commerce actions like "View Item," "Add to Cart," "Initiate Checkout," and "Purchase," and configure these events with relevant parameters. Enhanced E-commerce provides more detailed insights into user interactions and product performance on your website compared to standard tracking.
