Marketing analytics: what it is and how it drives better decisions
What marketing analytics is, what it measures, the decisions it should change at each stage of a company, and how to build numbers the business trusts.
Marketing analytics is the practice of collecting data about your marketing, joining it to what the business actually earned, and using the result to decide where the next budget goes. It answers three questions: which campaigns and channels bring customers worth more than they cost, what is changing, and what to do about it.
The difference between marketing analytics and marketing reporting is the second half of that definition. A report shows clicks, sessions and cost per lead. Analytics connects them to orders, revenue and margin, so a channel with cheap leads that never buy stops looking like the best one.
This guide covers what marketing analytics measures, how its use changes as a company grows, the problems that make most setups disappointing, a five-step way to start, and what it takes for the numbers to be trusted when they reach a leadership meeting.
Originally published in December 2020. Fully updated in October 2026: now also covers the fundamentals that used to sit in a separate “what is marketing analytics” guide.
What marketing analytics measures
What marketing analytics measures
Every marketing analytics setup, from a spreadsheet to a warehouse, has the same five parts:
| Part | What it is | Example |
|---|---|---|
| Collection | getting data out of each platform | ad spend from Google Ads and Meta, sessions from Google Analytics 4, orders from the store or CRM |
| Joining | putting it in one place on common keys | campaign, date, customer, order |
| Metrics | the definitions everyone uses | ROAS, cost per acquisition, customer lifetime value |
| Attribution | rules for which touchpoint gets credit | last click, position-based, data-driven |
| Reporting | where people read the result | a dashboard, a spreadsheet, a Slack message |
Most teams invest in the first and last parts and underinvest in the middle three. That is why two dashboards can disagree: the data was collected correctly and joined or defined differently.
The metrics that matter most sit where marketing data meets business data:
- Return on ad spend and marketing ROI: what a channel returned for what it cost.
- Cost per acquisition and customer lifetime value: what a customer costs to win and what they are worth over time.
- Conversion rate by stage: where people drop out between first visit and purchase.
A wider list, with formulas, is in 25 marketing metrics and KPIs.
The decisions it should change
The decisions it should change
Marketing analytics earns its cost only when a decision comes out differently. The ones it should change, in order of how much money they move:
- Budget between channels. Shift spend from the channel with the worst return to the one with the best, at the margin.
- Budget between campaigns inside a channel. Pause what does not pay back; scale what does.
- Which customers to acquire. Channels differ more in the lifetime value of the customers they bring than in the cost of the first order.
- When to retain. Cohort analysis shows when customers stop buying, so offers arrive before they leave.
- What to stop measuring. A dashboard with 40 metrics produces no decisions. Five that map to the four above do.
If a report has not changed one of these in a quarter, it is a report, not analytics.
OWOX Data Marts
See your first report built in real time. 15 minutes.
- Connect your data warehouse
- Pick your metrics
- Get a live Google Sheets report
In the time it takes to write a ticket. Then imagine never writing that ticket again.
Book a DemoWe'll use your actual use case
How marketing analytics changes as a company grows
How marketing analytics changes as a company grows
The questions stay similar; the data and the people answering them change.
| Stage | Main question | Typical setup | Common gap |
|---|---|---|---|
| Startup or small store | which campaigns pay back? | Google Analytics 4, ad platform reports, a spreadsheet | no link between ads and actual orders |
| Growing online store | how do we grow at a target cost per order? | ad costs and orders joined in a warehouse, a dashboard | each team has its own definition of revenue |
| Omnichannel retailer or marketplace | which channels bring new customers, online and offline? | warehouse with store, CRM and offline sales | online and offline data never meet |
| Lead-driven business (finance, telecom, B2B) | which campaigns bring leads that close? | CRM opportunities joined to ad spend | marketing counts leads, sales counts deals |
Two examples of what the middle stages look like in practice:
- An agency automating client reporting. Cost data from every ad platform is loaded into a warehouse daily, joined with conversions, and fed to a dashboard each client opens. Nobody exports a CSV on Monday morning.
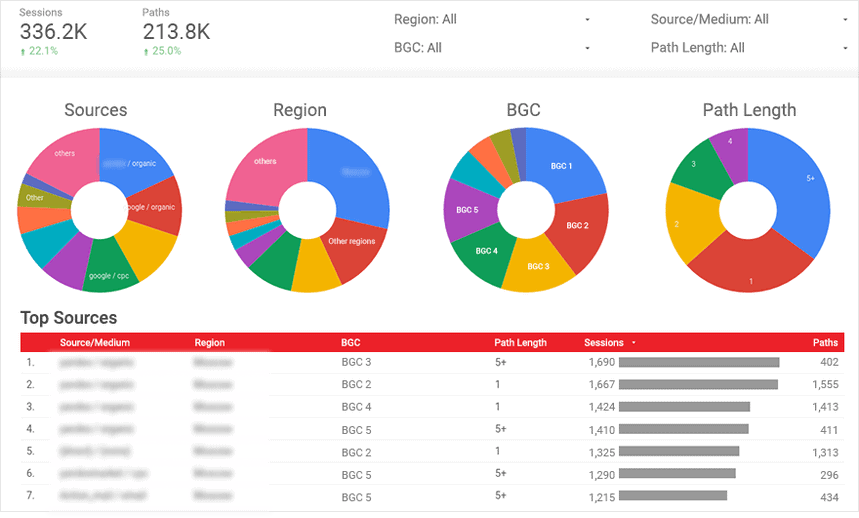
- An online store segmenting orders by path length. Orders are split by how many sessions came before the purchase (1, 2, 3, 4, 5+), then by source, region and category. Channels that only ever appear early in long paths are revealed as discovery channels, not failures.
Why marketing analytics disappoints
Why marketing analytics disappoints
Most setups fail in the same five places:
- Data in silos. Ad platforms, Google Analytics 4, the CRM and the store each report their own conversions. Nobody sees the whole path.
- Platforms that disagree. Each ad platform uses its own attribution window and counts its own conversions. Summed, they claim more sales than you made. In the demo shop behind the public [Demo] E-commerce project (synthetic data), six ad platforms reported 932 conversions for July–September 2026 against 488 completed orders from the sessions they brought, 1.9 per order. The platform-by-platform comparison is in how to measure online advertising. Budget moved on the platforms’ own numbers moves toward whichever counts most generously.
- Tracking that thins out. Consent rules and browser restrictions mean fewer conversions are observed directly. The gap is filled by modelled numbers, which need to be labelled as such.
- Definitions that drift. “Revenue” with or without VAT, refunds, shipping. Each team picks one, and the leadership meeting gets three.
- Analysis that never reaches a decision. Under deadline pressure, the report gets built and the conclusion does not.
The first three are data problems with technical fixes. The last two are not: they are fixed by deciding definitions once and making them the only ones available.
How much a definition matters is easy to underestimate. In the same demo shop, we ranked the paid channels by return on ad spend for July–September 2026 twice, from the same orders and the same spend, changing only which session gets credit for the sale:
| Rank | Last click (the order’s session) | ROAS | First click (first session in 30 days) | ROAS |
|---|---|---|---|---|
| 1 | TikTok Ads | 4.78 | Reddit Ads | 12.67 |
| 2 | Reddit Ads | 4.75 | TikTok Ads | 11.86 |
| 3 | Microsoft Ads | 4.73 | X Ads | 9.24 |
| 4 | Google Ads | 4.70 | Facebook Ads | 8.52 |
| 5 | Facebook Ads | 4.31 | Microsoft Ads | 5.37 |
| 6 | LinkedIn Ads | 0.50 | Google Ads | 4.78 |
| 7 | X Ads | 0.41 | LinkedIn Ads | 1.83 |
X Ads goes from last to third; Google Ads from fourth to sixth. Neither ranking is wrong. But if marketing reads one and finance the other, the same budget meeting produces two opposite recommendations, and the argument is about the definition, not the channels. The rule that prevents it: decide the definition before you look at the ranking, write it into the query, and show it next to every number that uses it.
How to set up marketing analytics in five steps
How to set up marketing analytics in five steps
- Write down the decisions. Start from the list above, not from the data you happen to have. Each decision implies the metrics and the breakdowns you need.
- Bring the data into one place. For anything beyond a small store, that is a warehouse you own: your ad platforms’ costs through , Google Analytics 4 through its native export, orders and opportunities from the store or CRM.
- Define each metric once, in SQL. ROAS, CPA, revenue and lifetime value each get one query, with its assumptions (window, refunds, VAT) written into it. Put quality checks on those queries, so a broken feed is caught before the dashboard shows it.
- Pick an attribution rule and keep it. A consistent imperfect model beats switching models every quarter. See how attribution models work.
- Deliver it where people work. A dashboard for monitoring, a for planning, a message for alerts. All reading from the same definitions.
How the pieces fit as a toolset, and what each layer is for, is covered in the anatomy of a marketing analytics stack.
Numbers that survive a leadership meeting
Numbers that survive a leadership meeting
The most expensive failure in marketing analytics is not a missing report. It is a number presented to the board that turns out to be wrong, or that finance contradicts with its own. After that, every later number is questioned.
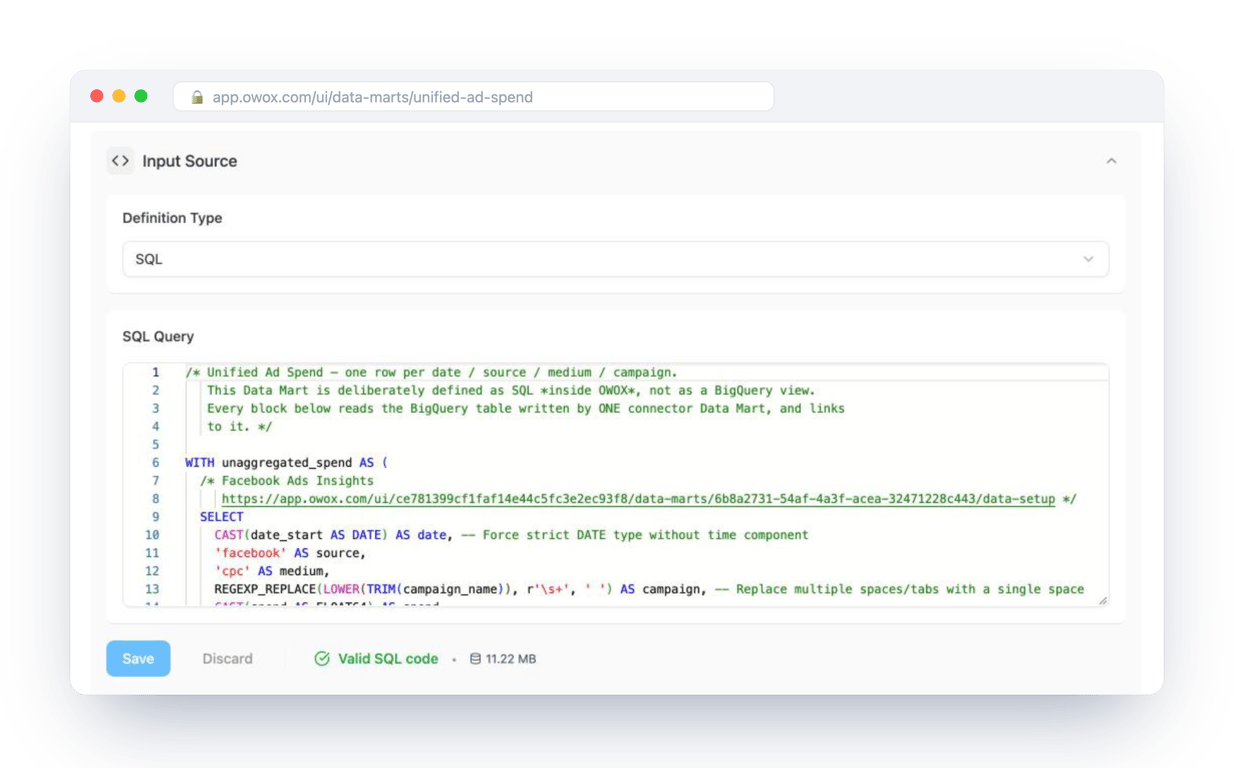
The way out is structural: one definition per metric, owned by an analyst, with the query on view. In OWOX Data Marts, that definition is a Data Mart: SQL an analyst wrote, published with a description and an owner, joined to other Data Marts in a model. Reports, dashboards and questions to an assistant all read from it instead of recalculating.
That also changes how a marketing leader can get an answer. Against the E-commerce model, the question
“Which paid sources returned the most store revenue per dollar of ad spend last quarter? Show only the source and the revenue per dollar, to two decimals, highest first.”
is answered from the published Ad Spend vs Store Orders Data Mart, which counts the revenue of orders the store completed rather than what each ad platform claims, with the SQL behind the answer available to check.
| Asked of raw tables | Asked of the Data Model | |
|---|---|---|
| What the AI sees | every table in the warehouse | the published Data Marts |
| Revenue, refunds, attribution | whatever it assumes | what the analyst defined |
| What you get | a confident number | the number, and the query behind it |
![The prompt above asked in the AI Assistant of an Insight on the Ad Spend vs Store Orders Data Mart, in the [Demo] E-commerce project of OWOX Data Marts: five sources return $4.31 to $4.78 of store revenue per dollar of spend, while LinkedIn and Twitter return 50 and 41 cents – the ranking a budget conversation starts from.](https://cdn.owox.ai/www/content-marketing-article/marketing-analytics-helps-businesses-make-data-driven-decisions/screens/2.png/public)
It reduces the risk of a wrong number rather than eliminating it: the answer is as good as the Data Marts behind it. But when someone asks where a figure came from, there is an answer, and it is the same one the analyst would give. Marketing reporting nobody can argue with goes further into how teams set this up.
Choosing marketing analytics tools
Choosing marketing analytics tools
Tools fall into four groups, and most companies need one from each rather than one that claims to do everything:
| Group | What it does | Examples |
|---|---|---|
| Collection | gets data out of platforms into your storage | connectors, Google Analytics 4’s BigQuery export |
| Storage | holds and joins the data | Google BigQuery, Snowflake, AWS Redshift, AWS Athena, Databricks |
| Definitions | turns tables into metrics everyone shares | SQL models, Data Marts |
| Delivery | shows the result to the people who decide | dashboards, spreadsheets, chat |
The group most often skipped is definitions, and it is the one that decides whether the dashboards agree. For a comparison of reporting and dashboard products, see the best reporting tools.
Turn your data into decisions.
Governed data marts give you the clean foundation ML needs to actually work.
- No AI hallucinations
- Analyst-governed definitions
- Every number traces to SQL
Frequently Asked Questions
How can businesses measure the return on investment (ROI) of their marketing efforts using marketing analytics?
Businesses measure ROI in marketing by calculating the revenue generated from marketing activities and comparing it to the costs incurred, providing a clear indication of profitability.
What are the ethical considerations and potential challenges associated with collecting and analyzing customer data for marketing data analytics purposes?
Ethical considerations in marketing analytics involve respecting data privacy, obtaining consent, ensuring data security, and avoiding discriminatory practices. Challenges include data quality, compliance with regulations, and potential bias.
What are some key performance indicators (KPIs) that businesses should track through marketing analytics to evaluate the effectiveness of their campaigns?
Key performance indicators (KPIs) for marketing analytics include conversion rate, customer acquisition cost, customer lifetime value, click-through rate, and website traffic, helping evaluate campaign effectiveness.
What skills do you need for marketing analytics?
Skills for marketing analytics include proficiency in data analysis, knowledge of marketing techniques, statistical analysis, proficiency in data visualization, and experience with analytics tools.
What is a marketing analytics practice?
A marketing analytics practice involves using data analysis and tools to evaluate marketing strategies, measure performance, and make data-driven decisions to enhance marketing campaigns.
What are some commonly used marketing analytics tools?
Some commonly used marketing analytics tools include Google Analytics, Adobe Analytics, Hubspot, Moz, SEMrush, and BuzzSumo.
How can businesses effectively use marketing analytics to improve their marketing strategies?
Businesses can effectively use marketing analytics by regularly monitoring and analyzing data, identifying trends and patterns, setting achievable goals, and adjusting strategies based on insights gained from the analysis.
What are some benefits of using marketing analytics for businesses?
Benefits of using marketing analytics include increased ROI, improved customer engagement and retention, better understanding of customer behavior, identification of under-performing campaigns, and informed decision making based on data-backed insights.