
From Backlog to Library: Turning Tickets into Reusable Data Marts
Discover how analytics teams can use OWOX Data Marts to replace ticket backlogs with reusable data marts, automating reports and improving workflow efficiency.

Analytics teams often find themselves answering the same business questions over and over again: “What’s our CAC?” or “How’s ROAS this month?” These repetitive requests pile up in Jira, Slack, or Notion queues, slowing everyone down and leaving analysts stuck in cycles of manual work instead of meaningful analysis.
.png)
This article explains how teams can turn these recurring tickets into reusable, documented data marts using OWOX Data Marts. You’ll learn how to define logic once, standardize metrics, automate updates, and build a governed data library that keeps reports consistent and accessible for all.
Why Endless Data Tickets Drain Analyst Productivity
Endless reporting tickets drain analysts not just by volume but by repetition. This section explains how repetitive questions, manual SQL edits, and inconsistent definitions across teams slow productivity, create confusion, and lead to longer turnaround times for even simple business reports.
Repetitive “What’s Our CAC?” Requests
Analysts constantly face the same recurring questions, like:
- “What’s the CAC for Product X?”
- “What’s the ROAS for Campaign Y?”
While the filters or timeframes might change, the logic behind these queries remains identical. Each new request still demands manual effort, turning small updates into full-blown reporting cycles.
This constant repetition results in near-duplicate SQL scripts and dashboards that clutter the reporting ecosystem. Instead of improving insights, analysts spend hours rebuilding similar reports, leaving little time for deeper analysis or model development.
Manual SQL Rework for Each Business Question

Slight changes in reporting requests, like adjusting a region, product, or date range, often force analysts to rewrite SQL scripts from scratch. Each tweak means reapplying filters, recalculating fields, or rebuilding joins, even when the underlying logic remains unchanged.
Over time, this rework adds unnecessary complexity and maintenance burden. The same metrics are recreated multiple times across departments, making updates difficult and increasing the risk of mismatched numbers or outdated queries appearing in reports.
Long Turnaround Times and Inconsistent Metrics
Every ticket moves through multiple stages: clarification, validation, and approval. With so many handoffs, simple data questions can take days to resolve. When multiple analysts interpret metrics like CAC or Active Users differently, reports start contradicting each other, leading to internal confusion.
Without centralized documentation, no one knows which version of a metric is correct. As these inconsistencies multiply, business users lose confidence in dashboards and reports, forcing analysts to spend even more time defending their numbers instead of improving them.
The Shift from Requests to Reusable Data Assets
This section covers how analytics teams can reduce repetitive work by defining common reporting questions once as reusable, documented data marts. It explains how this approach gives analysts more time for strategy and gives business teams instant access to trusted data.
Defining Logic Once for Repeated Use
Instead of rewriting SQL queries every time someone asks for CAC, ROAS, or churn data, analysts can define the logic once inside a data mart. This single source then powers all future reports, ensuring consistency across dashboards, teams, and timeframes.
By reusing the same data mart logic, teams avoid duplicate efforts and reporting confusion. Every stakeholder, from marketing to finance, sees the same numbers drawn from one governed source. This approach not only saves hours of manual rework but also strengthens trust in data accuracy across tools and departments.
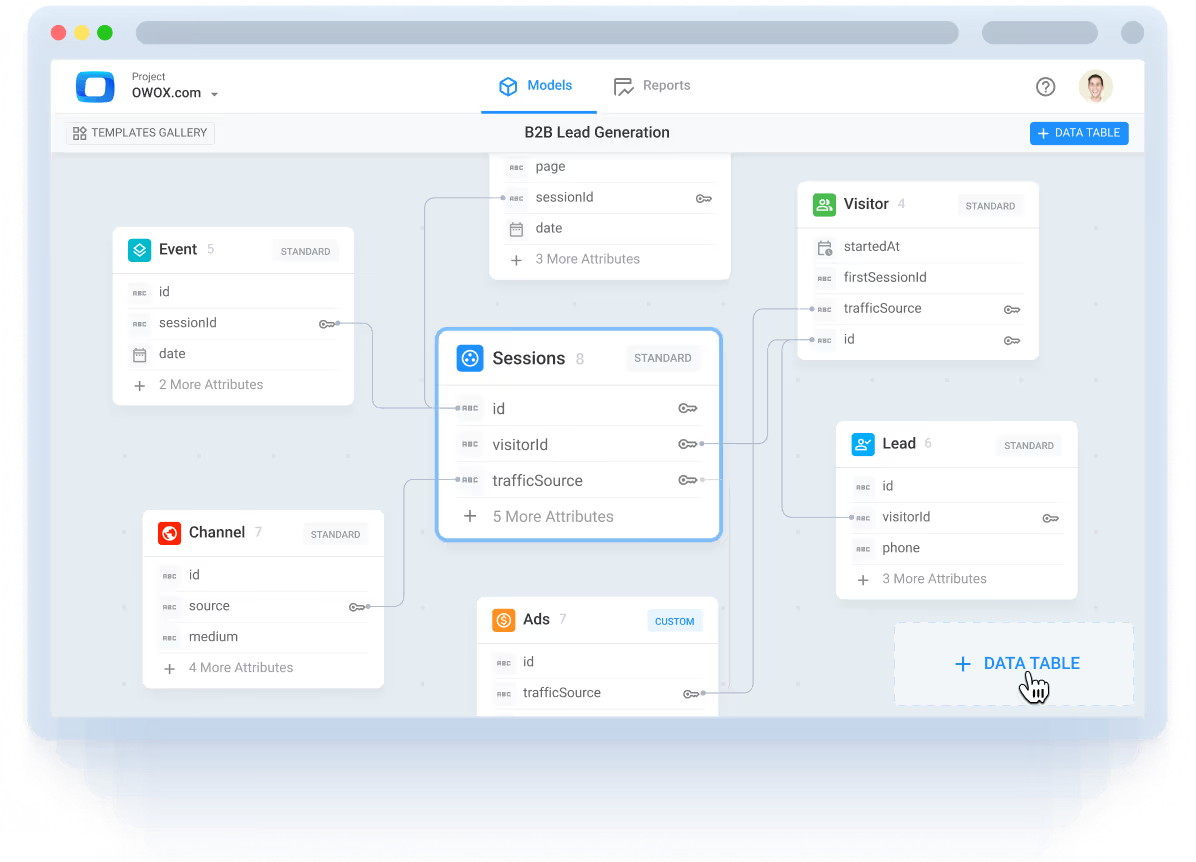
Standardizing Business Metrics with Output Schemas
Output Schemas in OWOX Data Marts allow analysts to transform complex, technical fields into clear, understandable labels. They can rename columns, add friendly descriptions, define joins or primary keys, and document how each metric is calculated. This makes it easy for anyone to understand what “Customer Acquisition Cost” or “Active Users” actually means.
With standardized Output Schemas, teams no longer need to question which version of a metric is correct. Each data mart becomes self-documented and ready for reuse, giving analysts control while ensuring business users always work with consistent, governed definitions.
Giving Business Teams Trusted Access in Familiar Tools
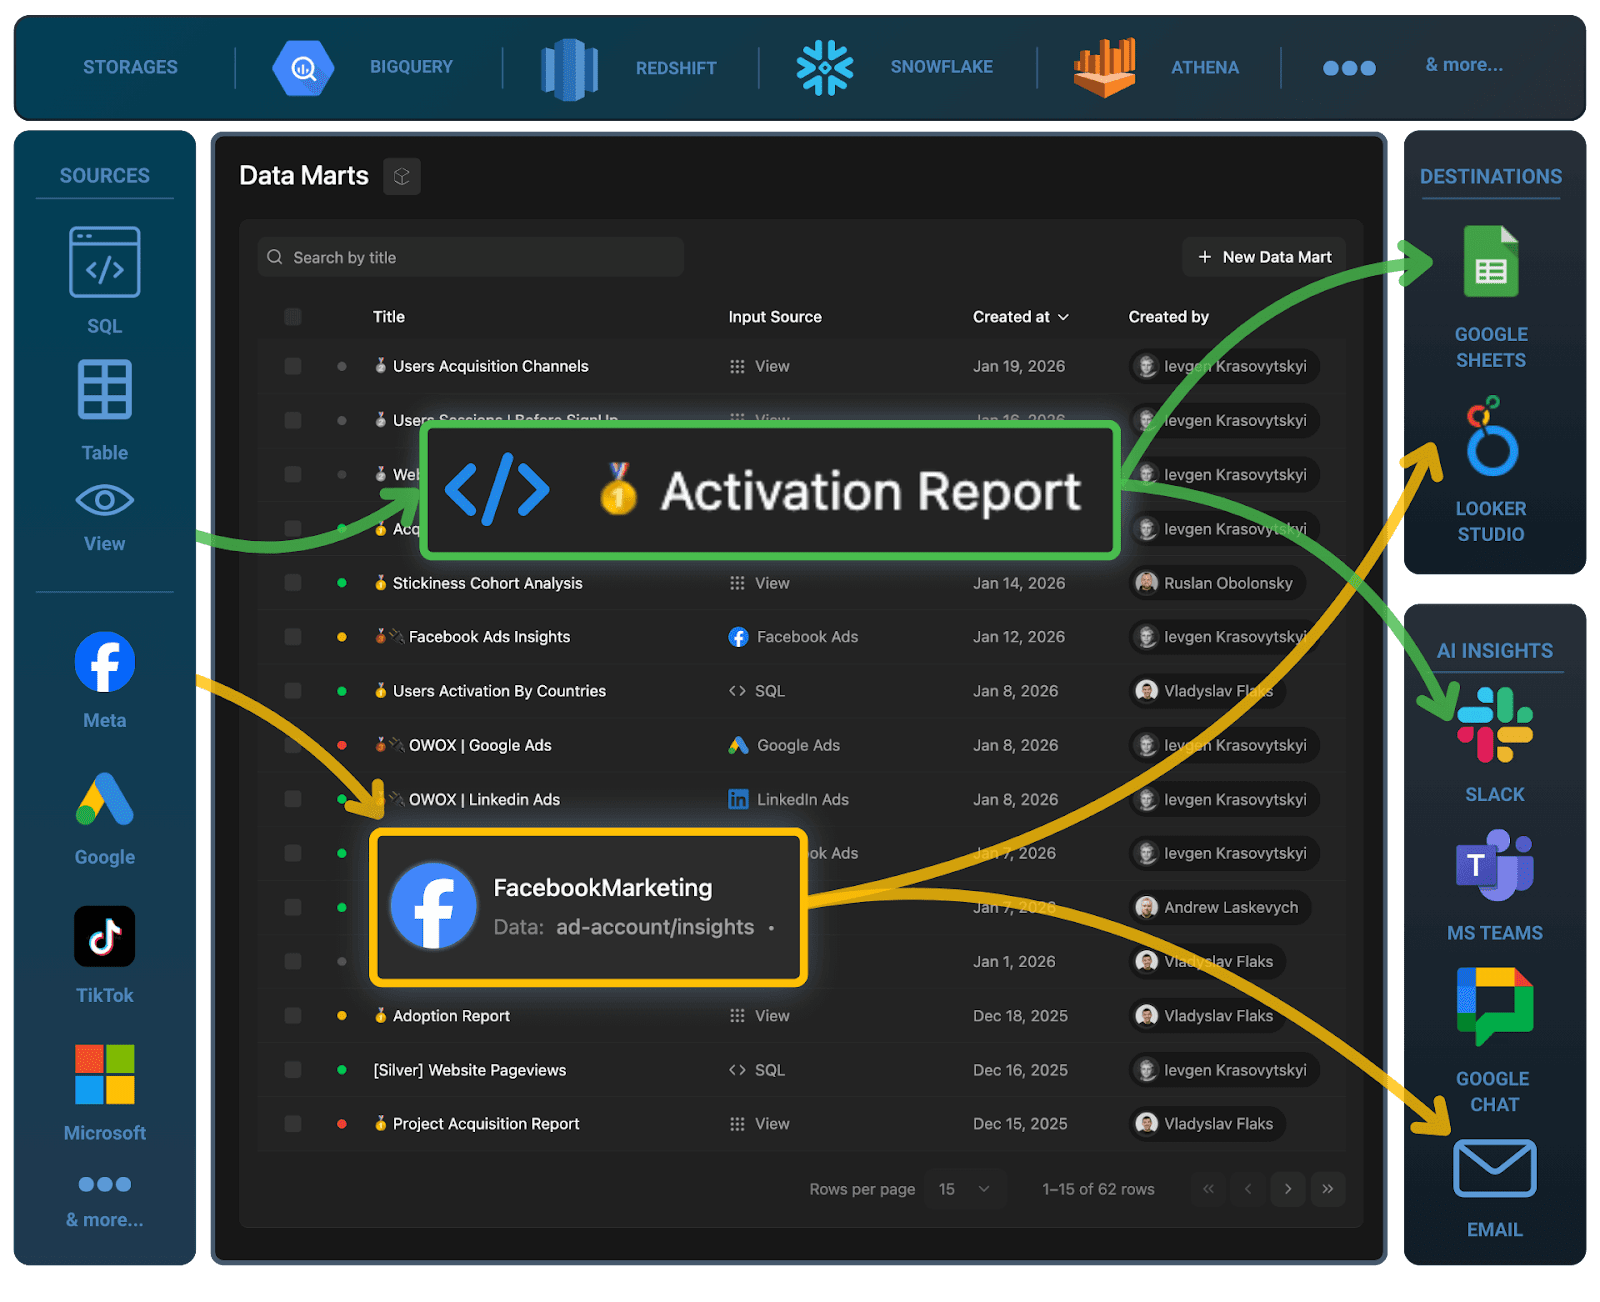
Once a data mart is ready and published, business teams can explore, filter, and build reports directly in Google Sheets or Looker Studio using verified data. There’s no need to raise new tickets or request data extracts; everything they need is already available.
Analysts stay in charge of the underlying definitions and logic, while business users enjoy self-service access to accurate, current data in the tools they already use daily. This balance speeds up reporting, reduces confusion, and keeps both sides aligned on a single version of the truth.
How OWOX Data Marts Helps Eliminate Ticket Backlogs
This section explains how OWOX Data Marts helps analytics teams turn recurring data requests into reusable, well-documented data marts. It covers a simple, SQL-first approach to identify patterns, define logic, add governance, and automate report updates, without changing existing tools.
Identify Patterns in Your Ticket Queue
Before creating automation, take a step back and analyze your reporting workflow. Review the last 30–60 days of Jira, Notion, or ServiceNow tickets and note how many requests repeat the same core question, only changing filters like date, region, or campaign. These recurring requests are your first signs of inefficiency.
When you spot these overlaps, categorize them by business area, such as marketing, finance, or operations. The goal isn’t just to find duplicates but to recognize patterns that consume analyst time week after week.
These patterns reveal the perfect opportunities to build reusable data marts, datasets that serve the same need repeatedly without generating new tickets. Identifying them early prevents repetitive rework and accelerates reporting turnaround.
Step 1: Identify Recurring Ticket Patterns
Once you’ve reviewed your tickets, focus on identifying recurring requests with similar logic, like “CAC by region” or “ROAS for campaign type.” These often differ only in parameters, not in structure. Group such tickets by metric or department to reveal where standardization can make the biggest impact.
This process helps you prioritize which reports to automate first. Instead of responding to every version of the same question, you define its logic once inside a data mart. From then on, the same governed dataset powers every future request, reducing manual work and ensuring faster, consistent answers for your stakeholders.
Step 2: Codify Queries Using SQL, Table, View, or Pattern-Based Data Marts
After spotting recurring questions, the next step is to codify their logic using OWOX Data Marts. Choose from different definition types to standardize calculations, reduce duplicate SQL work, and ensure consistent reporting across all teams and dashboards.
Here are the main types of data marts you can use:
- SQL-based Data Mart: Ideal for complex queries or when you need full control over transformations. Analysts can write SQL once and reuse it for every report or destination.

- Table-based Data Mart: Best for referencing an existing, pre-modeled table in your data warehouse. Perfect when data is already cleaned, joined, and ready for reporting.
- View-based Data Mart: Useful for connecting to existing database views without duplicating data. It keeps logic centralized while ensuring consistent, updated results across tools.
- Pattern-based Data Mart: Designed for datasets split into multiple tables (like events_2025*). This setup allows querying all matching tables at once using a wildcard pattern.
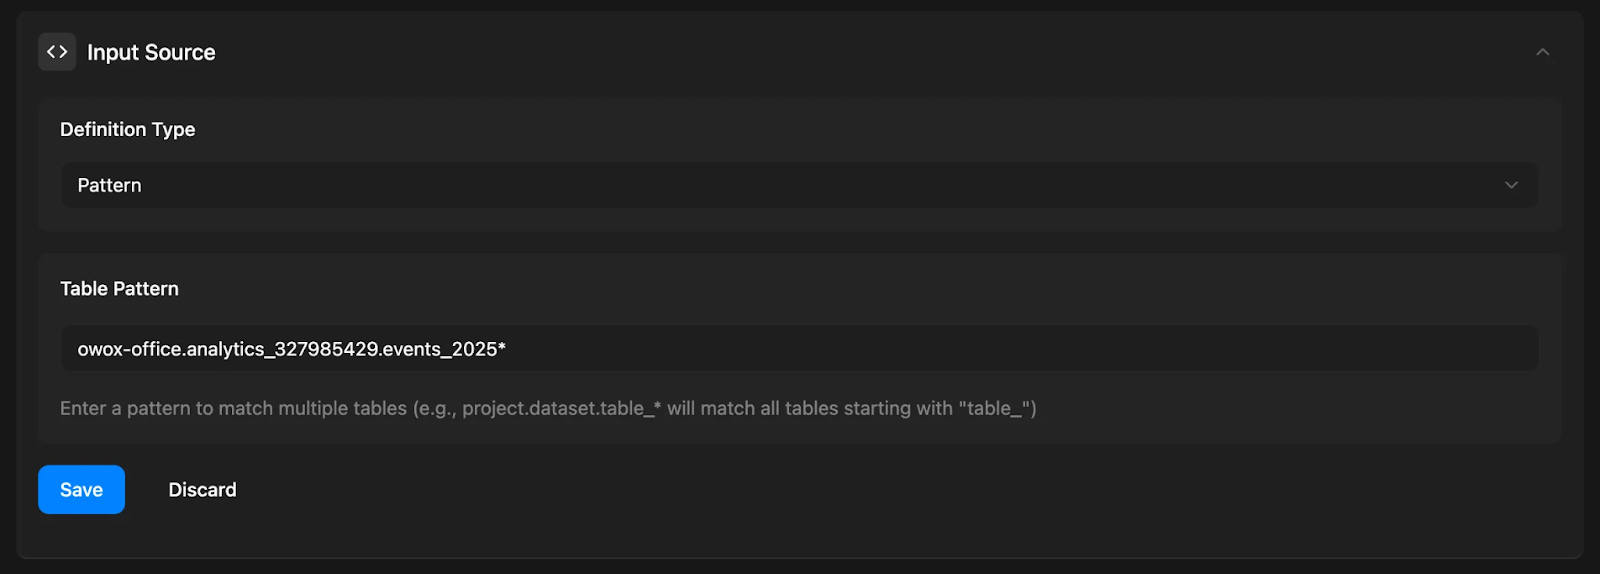
By choosing the right data mart type, analysts can define logic once and make it reusable, ensuring every department works with the same trusted metrics and reducing redundant SQL maintenance.
Step 3: Add Clarity and Governance with Output Schemas
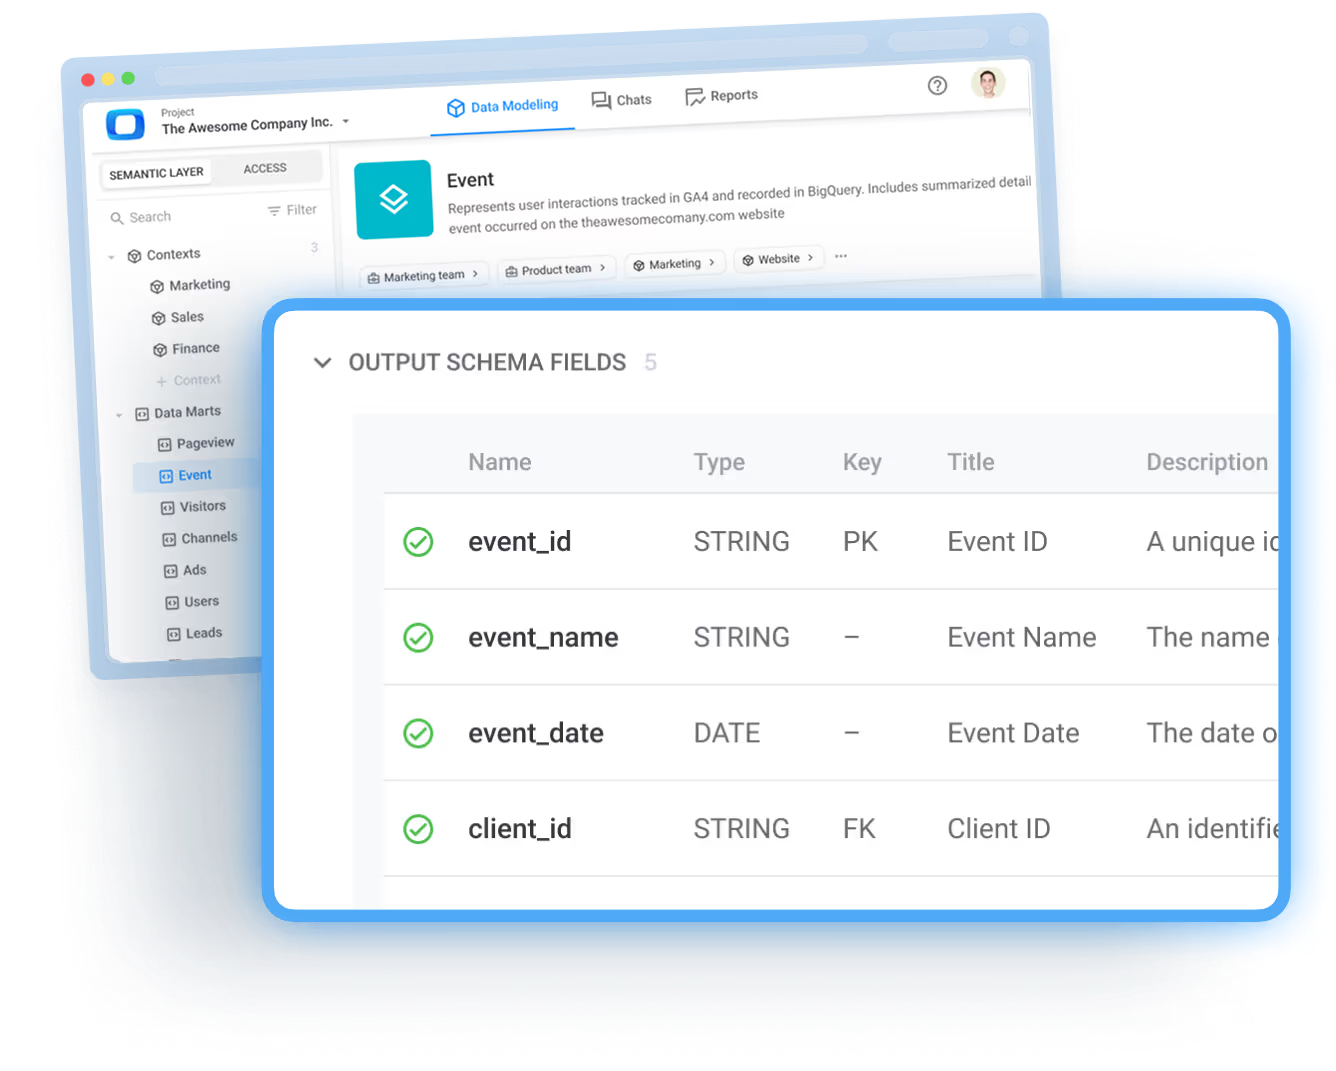
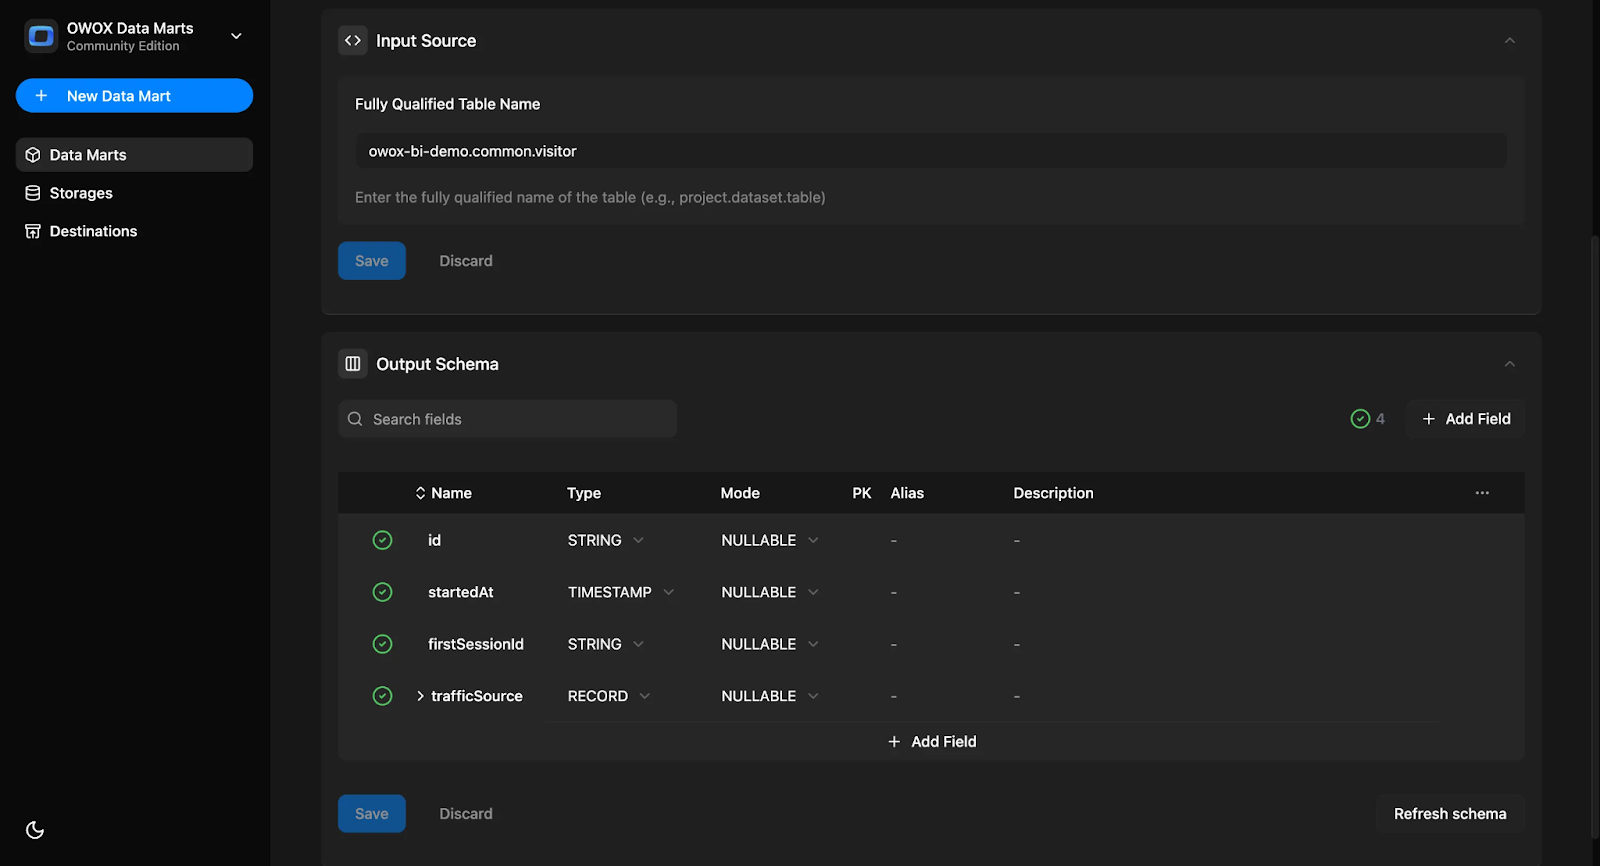
Every data mart in OWOX Data Marts automatically generates an Output Schema listing field names, data types, and metadata. Analysts can enrich this schema by adding human-readable names, clear field descriptions, and relationships between datasets. This turns technical SQL into understandable business logic that’s safe to share and easy to trust.
With Output Schemas, teams eliminate ambiguity about what each metric means; CAC, Active Users, or Revenue all have one clear definition. Analysts keep control of logic, while business users gain confidence in using standardized, documented data across every reporting tool.
Best Practice: Assign Ownership and Add Metadata
To make Output Schemas even more reliable, follow these best practices:
- Assign a Data Mart Owner: Each data mart should have a designated analyst or data team responsible for its upkeep.
- Add Metadata Transparently: Include a “last updated” timestamp, author details, and definition notes in the Output Schema for full visibility.
- Prevent Confusion Later: Clear documentation stops questions like “Who built this?” or “Can we trust it?” from arising.
- Reduce Metric Disputes: With visible ownership and defined terms, teams avoid internal debates over whose numbers are correct and maintain one version of the truth.
These ensure your data marts stay well-documented, trusted, and politically neutral, and everyone works with the same, governed data definitions.
Step 4: Deliver Trusted Outputs to Sheets and Looker Studio
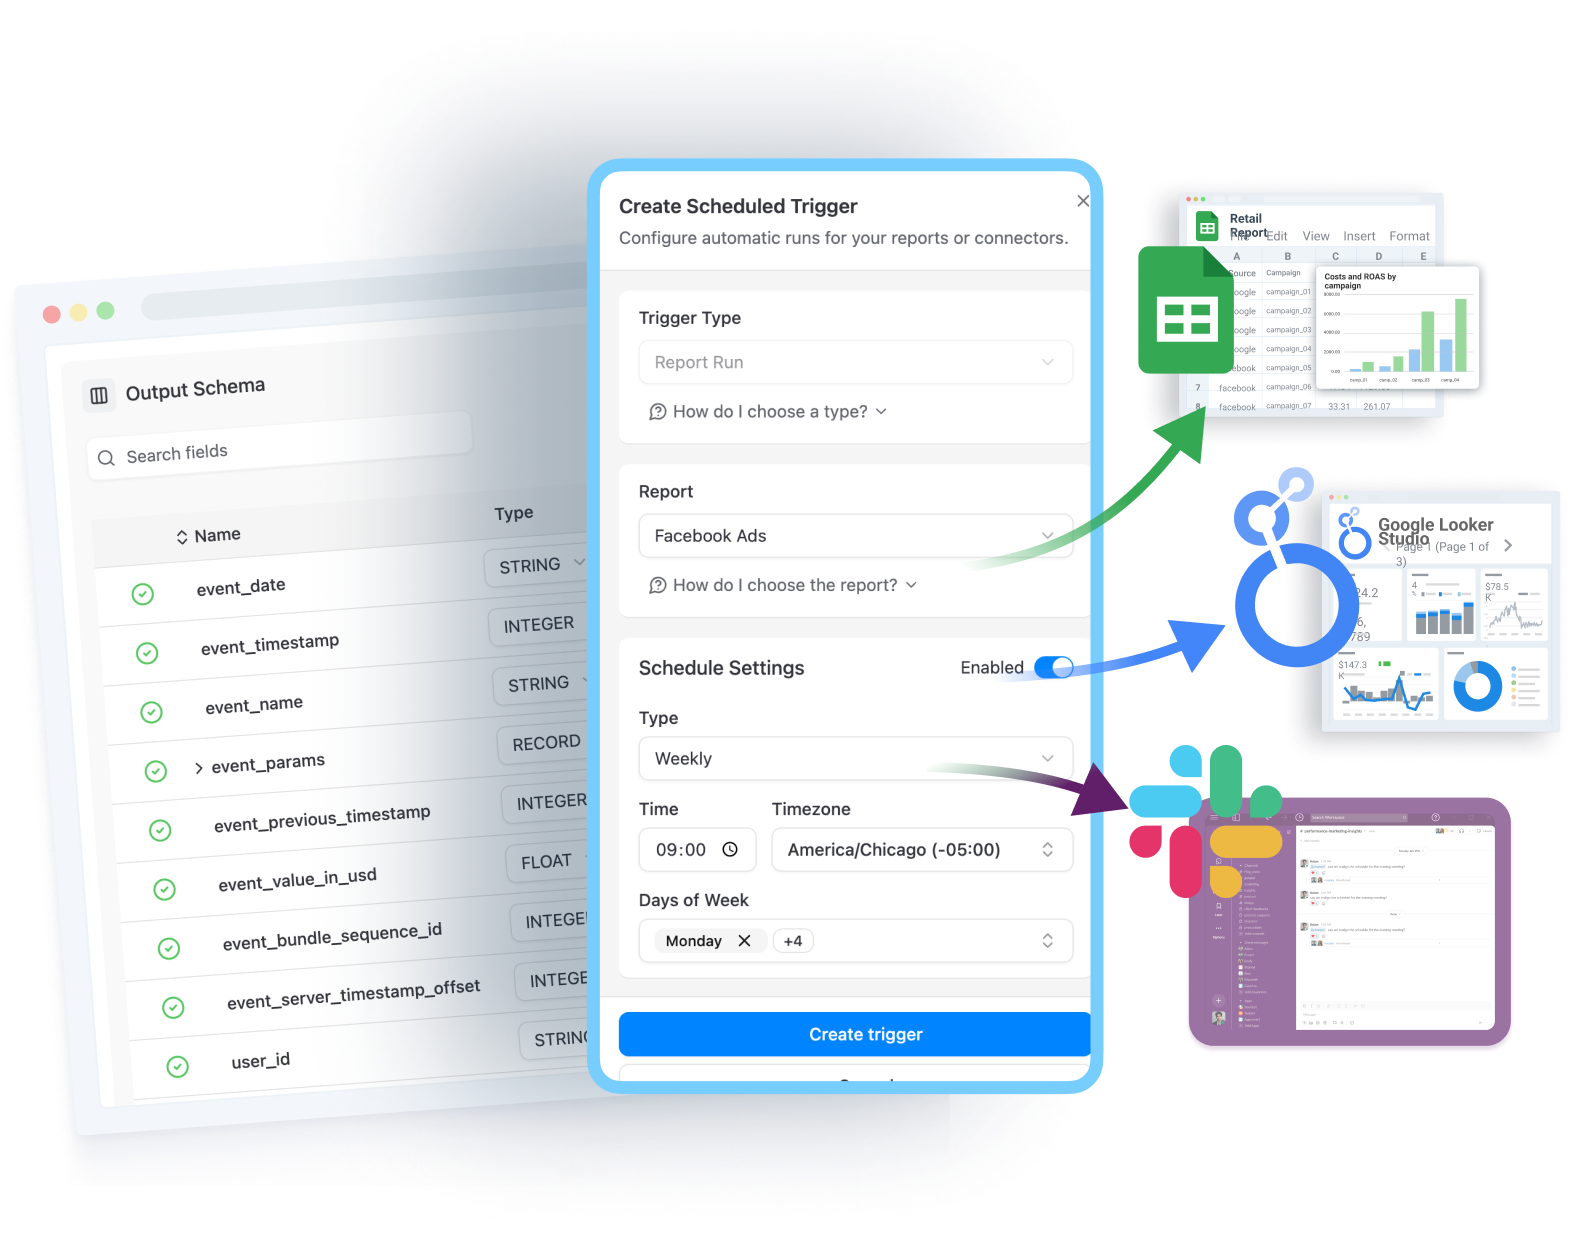
Once logic and documentation are finalized, publish data marts directly to Google Sheets or Looker Studio for instant access. These integrations make verified datasets readily available in tools your teams already use every day, no manual exports, no complicated setup, and no SQL required.
Analysts retain control over the underlying definitions and structure, while business users gain self-service access to accurate, fresh data. This bridge between governance and flexibility boosts collaboration, speeds up reporting cycles, and completely removes repetitive ticket requests for extracts. Everyone works from the same, trusted data source across all departments and dashboards.
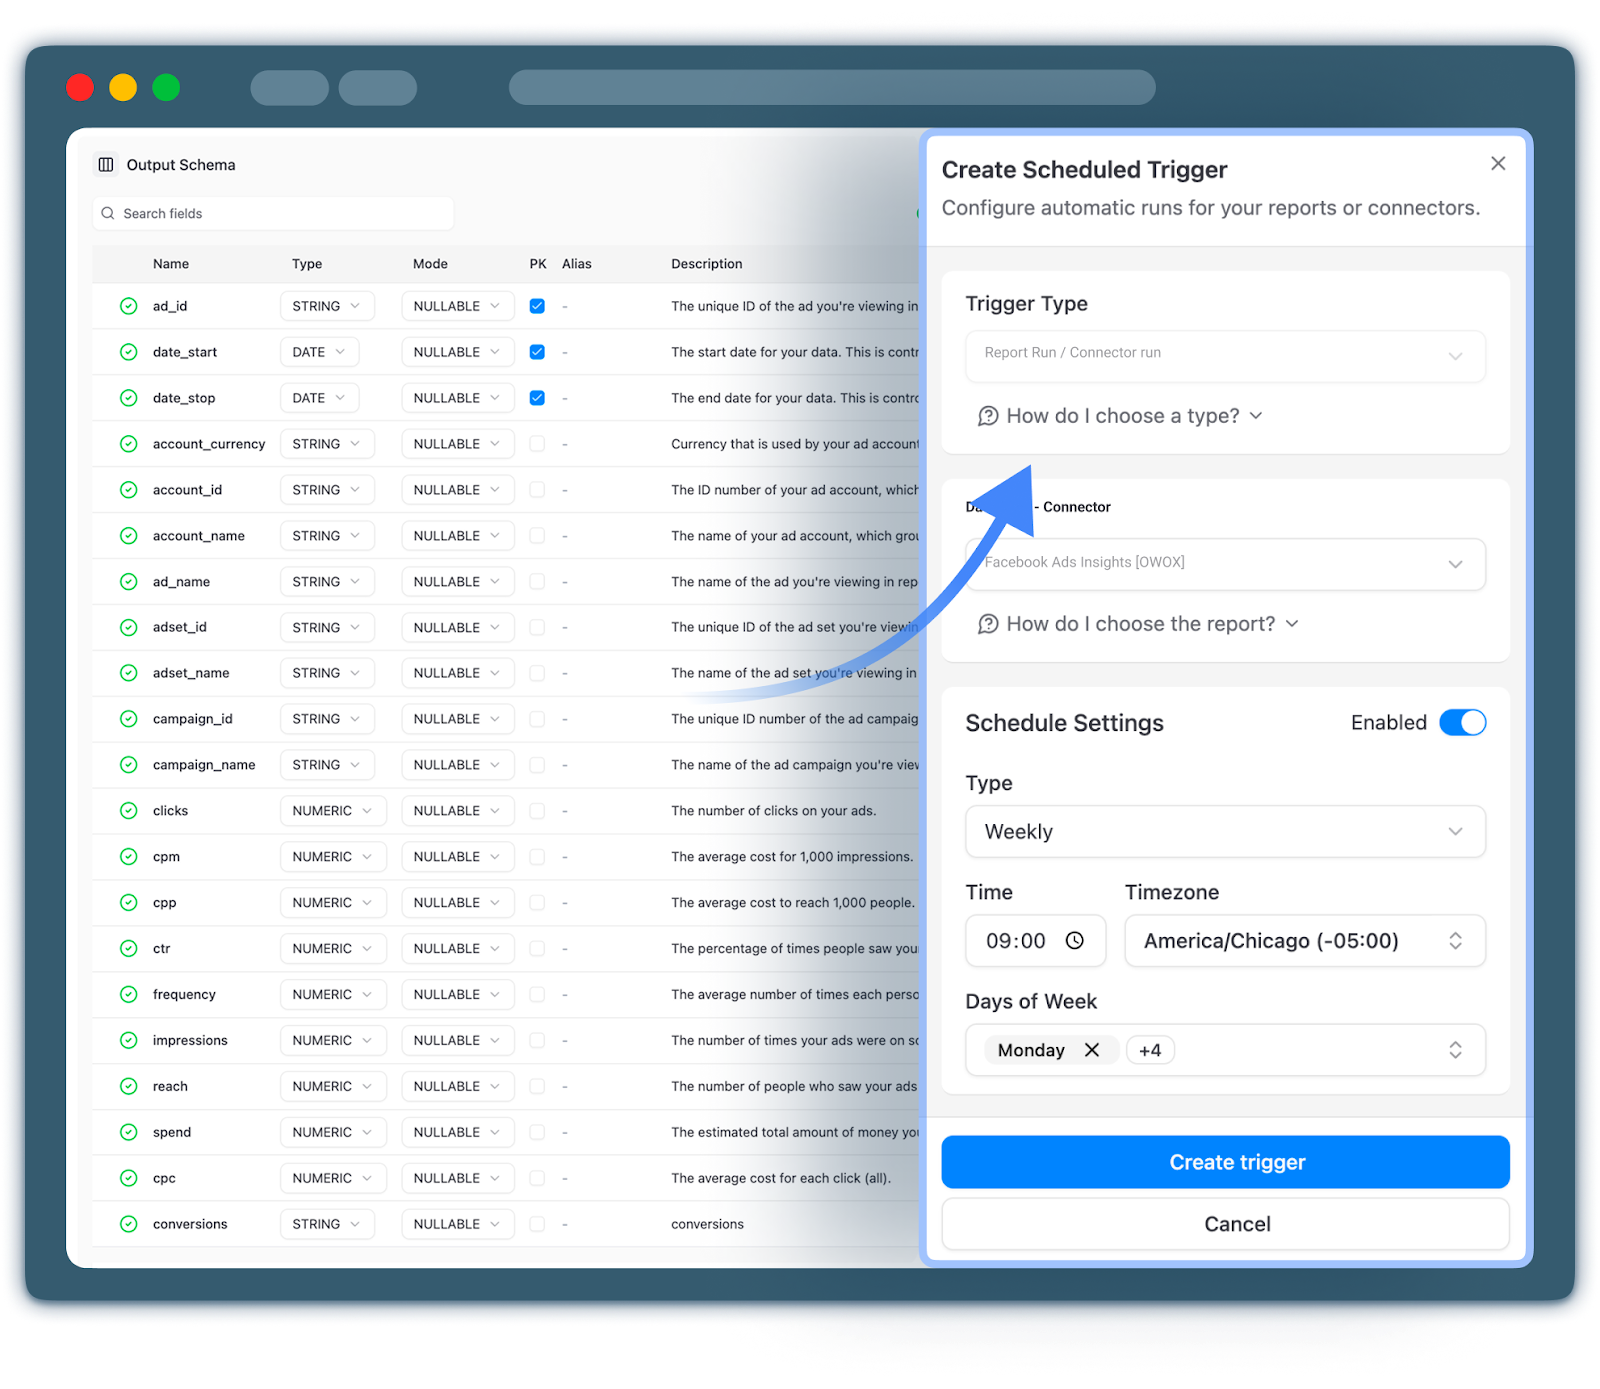
Step 5: Automate Data Freshness with Report Triggers
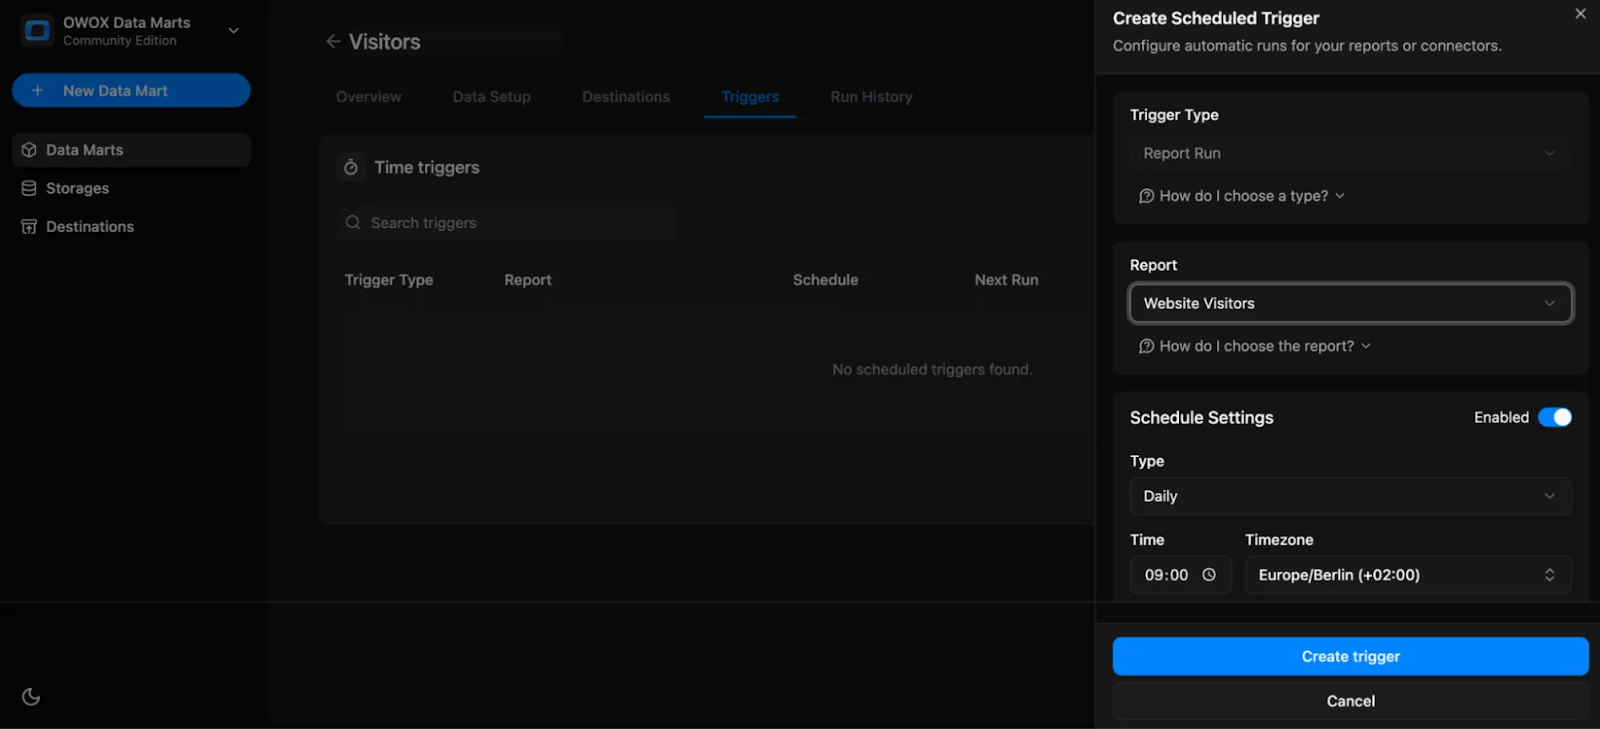
Finally, use Report Triggers in OWOX Data Marts to keep reports automatically refreshed according to your preferred schedule, daily, weekly, or at custom intervals. Once configured, analysts no longer need to manually update reports or respond to endless “Can you refresh this?” messages.
Report Triggers act as a built-in freshness SLA, letting stakeholders know exactly when the data will update next. This visibility eliminates confusion, Slack reminders, and stale dashboards. It ensures every report reflects the latest insights, helping business users make timely, data-backed decisions without depending on analyst intervention or additional ticket submissions.
The Right Framing – OWOX Data Marts Complements, Not Replaces Ticketing
OWOX Data Marts doesn’t replace Jira, Notion, or ServiceNow; it works with them. These platforms still manage new requests and priorities, while OWOX Data Marts prevents repetitive tickets by converting recurring questions into reusable, governed data marts that strengthen your existing reporting workflow.
Ticketing Tools Still Manage Intake and Prioritization
Jira, Notion, and ServiceNow continue to play a vital role in managing new requests, assigning priorities, and keeping project workflows organized. These tools ensure that one-time or complex data needs are handled efficiently with proper tracking and communication.
OWOX Data Marts doesn’t replace these systems; it complements them. By converting repetitive, predictable requests into reusable data marts, OWOX Data Marts reduces the flood of similar tickets that reach analysts. The result is a smoother process where ticketing tools handle new work, and OWOX Data Marts takes care of recurring needs automatically.
OWOX Data Marts Hosts the Governed Data Library, Not the Queue
OWOX Data Marts acts as your central data library where all recurring business questions are stored as reusable, governed data marts. Analysts define the logic once, ensuring that key metrics, like CAC, ROAS, or churn, remain consistent and accessible across the company.
Instead of repeatedly exporting the same datasets or rewriting queries, every department pulls verified data from a single, trusted source. This unified structure helps maintain accuracy, removes redundant work, and ensures everyone relies on one version of the truth across reports and dashboards.
Turning Recurring Tickets into Scalable Reporting Assets
Recurring data requests, such as CAC by product, ROAS by campaign, or churn by region, no longer need to be rebuilt from scratch. With OWOX Data Marts, each of these common questions becomes a permanent, named data mart that powers multiple reports and dashboards.
This approach minimizes manual SQL rework, reduces duplication, and keeps logic standardized across teams. Marketing, finance, and leadership can all access the same governed dataset without submitting new tickets, making reporting faster, scalable, and more reliable for everyone involved.
Shifting Analysts from Reactive to Proactive Work

By removing repetitive, ticket-driven report building, OWOX Data Marts frees analysts to focus on strategic projects that deliver higher business value. They can dedicate more time to modeling, forecasting, and improving data systems instead of manually maintaining the same dashboards.
This shift transforms analytics from a reactive support function into a proactive enabler of growth. Analysts evolve into data architects who create scalable, reusable assets that serve the entire organization, rather than firefighting one request at a time.
A Balanced System of Control and Self-Service
Together, OWOX Data Marts and ticketing tools form a balanced analytics ecosystem. Ticketing platforms continue managing unique or one-off data requests, while OWOX Data Marts handles recurring data delivery through governed, reusable data marts.
This harmony keeps governance and flexibility in sync. Analysts maintain control over logic and accuracy, while business users gain the freedom to access and explore trusted data on their own. It’s a system that scales analytics efficiently without overwhelming the data team.
Key Takeaways for Analysts and Teams
Turning endless reporting requests into reusable systems helps both analysts and business teams work faster and smarter. OWOX Data Marts make this shift possible by replacing repetitive ticket handling with scalable, documented, and self-service data assets. Here’s what teams gain from this approach:
- Shift from Tickets to Systems: Analysts move from reacting to one-off requests to building lasting, reusable data marts that answer recurring questions automatically.
- Governed Reusability: Every data mart serves as a documented, governed source of truth, ensuring consistent metric definitions across all reports and teams.
- Empowered Business Access: Business users get instant, verified data directly in Google Sheets or Looker Studio, no new tickets or manual extracts needed.
- Automated Freshness: Report Triggers keep data continuously updated, removing “Can you refresh this?” requests.
- Balanced Workflow: Jira or Notion handle new requests, while OWOX Data Marts sustains a governed data layer for long-term reporting efficiency.
Build Your Reusable Data Library with OWOX Data Marts
OWOX Data Marts helps analytics teams reduce ticket queues by turning repetitive reporting requests into permanent, documented data marts that your entire organization can trust.
Define logic once using SQL, Table, View, or Pattern-based data marts, document it through Output Schemas, and schedule automatic refreshes with Report Triggers. Publish trusted datasets directly into Google Sheets or Looker Studio, giving business users instant access to up-to-date insights.
With OWOX Data Marts, analysts spend less time fixing reports and more time driving meaningful analysis and strategic decision-making.
Frequently asked questions


Finally, a tool that doesn't ask business users to learn a new dashboarding UI. Our marketing team already knows Sheets. OWOX just delivers the right data.
Joinable data marts concept was the thing that sold us. We can now use the semantic layer without building one.
Self-hosted the OSS version on Digital Ocean. Zero vendor lock-in. Contributed a Shopify connector back in week two.