Google Analytics 4 metrics and dimensions: the key ones explained
In GA4, a dimension is an attribute such as country or session source and a metric is a number such as sessions or revenue. This guide explains the four scopes (user, session, event, item), shows from the BigQuery export why user counts do not add up across rows, lists the custom definition limits, and walks through the metrics and dimensions of every standard report, with key events in place of conversions.
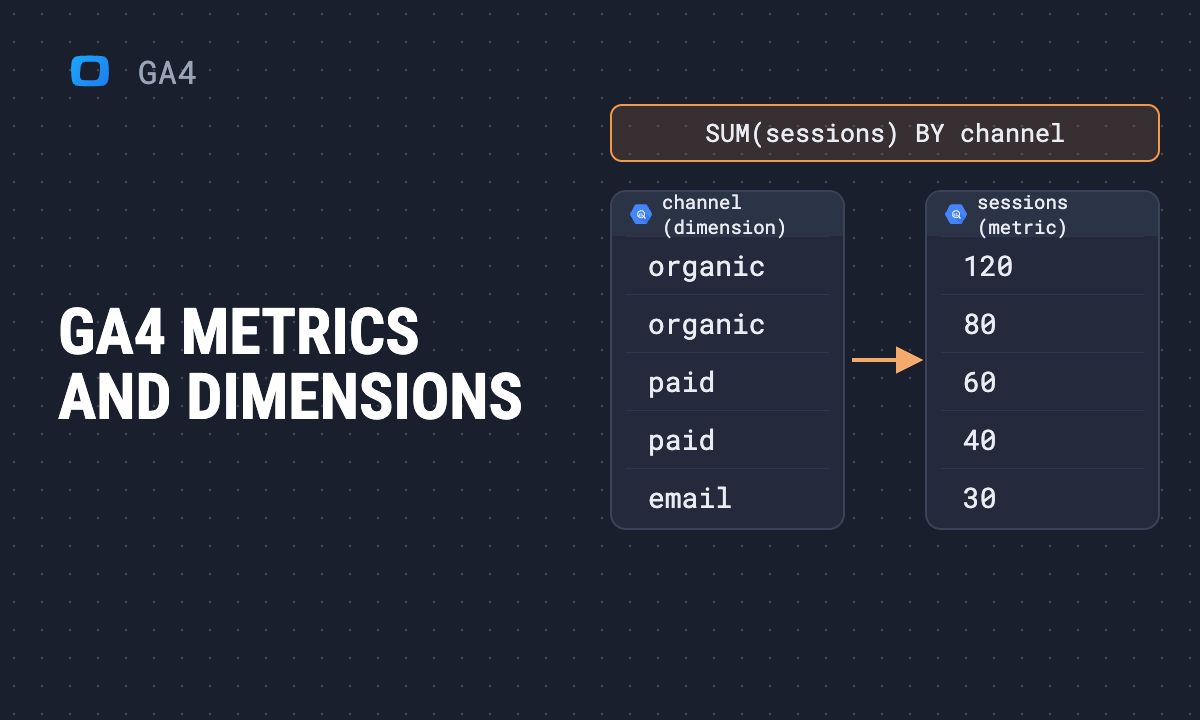
In Google Analytics 4, a dimension is an attribute that describes your data, such as country or session source, and a metric is a number that measures it, such as sessions or revenue. Every GA4 report is built from the two: dimensions in the rows, metrics in the columns. What decides whether a combination makes sense is scope: a dimension belongs to a user, a session, an event or an item, and a metric counted at one scope does not always add up across rows of another.
If you analyse GA4 data for a living, scope is where the wrong numbers come from. A report that puts a user-scoped dimension next to a session-scoped one, or a sum of users across devices that is larger than the total, looks exactly like a right report. This guide covers the definitions, the four scopes, the limits on custom dimensions and metrics, what each standard report shows, and how the same metrics are rebuilt from the BigQuery export, where you can check them.
In this article, you’ll learn:
- what the Google Analytics 4 metrics and dimensions are, and how their scopes differ;
- which metrics and dimensions each standard report uses;
- how to track the state of your e-commerce site;
- how to rebuild a metric from the raw export when the interface is not enough.
Note: This post was originally published in July 2020 and updated in January 2024. It was updated again in November 2026 for scopes, key events (the March 2024 rename of conversions), the custom definition limits and the BigQuery export, and checked against Google’s Analytics Help pages that month.
What are the metrics and dimensions in Google Analytics 4?
What are the metrics and dimensions in Google Analytics 4?
Reports in Google Analytics 4 consist of two types of data: dimensions and metrics.
Dimensions are attributes of your data. Their values are text or dates. For example, the City dimension is the city from which a user accesses your website, and the Page path and screen class dimension is the path of a page that was viewed.
Metrics are quantitative measurements: numbers. For example, Sessions is the number of sessions, and Views per session is the average number of pages or screens viewed per session.
A metric on its own says little. 1,200 sessions is a fact; 1,200 sessions from google / cpc against 300 from newsletter / email is a decision. Dimensions are what turn metrics into answers: who your users are, what they do, and from what channels they come to your site.
Seeing as there are lots of metrics and dimensions in Google Analytics 4, a practical question follows: which of them should you look at for your business, and which can be combined?
Key differences between dimensions and metrics in Google Analytics 4
Key differences between dimensions and metrics in Google Analytics 4
| Dimensions | Metrics | |
|---|---|---|
| Values | text or dates | numbers |
| Role in a report | rows, filters, breakdowns | columns, totals |
| Scope | user, session, event or item | counted over users, sessions, events or items |
| Custom ones come from | event parameters, user properties, item parameters | numeric event parameters |
| Custom ones need | a scope | a unit of measurement (standard, currency, distance, time) |
OWOX Data Marts
See your first report built in real time. 15 minutes.
- Connect your data warehouse
- Pick your metrics
- Get a live Google Sheets report
In the time it takes to write a ticket. Then imagine never writing that ticket again.
Book a DemoWe'll use your actual use case
Scope: User, session, event and item
Scope: User, session, event and item
GA4 organises data in a hierarchy: a user has sessions, and a session is made of events. E-commerce events carry items. Every dimension belongs to one of these levels, and Google’s help page on scopes of traffic-source dimensions shows how much it matters with the traffic-source dimensions:
| Scope | Prefix | Example | What the value means | Where Google shows it |
|---|---|---|---|---|
| User | “First user” | First user source | how the user was first acquired; stays the same on every return | User acquisition report |
| Session | “Session” | Session source | what started this session; new value on every visit | Traffic acquisition report |
| Event | none | Source | the source credited for a key event, by your attribution model; “(not set)” for events that are not key events | Model comparison, Key event paths |
| Item | “Item” | Item name, Item category | the product inside an e-commerce event | E-commerce purchases report |
Google’s own example: a customer first arrives from organic search, returns a few days later from an email and buys. His First user source / medium is google / organic for ever. His two sessions have Session source / medium google / organic and email / newsletter. Which of them gets credit for the purchase as Source / medium depends on the attribution model.
The rule that follows: know which scope each column is counted at before you add rows up. Google’s own Traffic acquisition report puts Users next to a session dimension, and that is fine to read row by row. It goes wrong when rows are summed, or when a session-scoped dimension is combined with an item-scoped one and the rows are read as if they described the same thing.
Why metrics do not always add up across rows
Scope also decides whether a metric can be summed. We ran the query below on Google’s public GA4 sample export (bigquery-public-data.ga4_obfuscated_sample_ecommerce, the obfuscated data of the Google Merchandise Store) for January 2021, on 10 November 2026. It rebuilds two GA4 metrics, Users and Sessions, by the Device category dimension, with a total row:
WITH events AS (
  SELECT
    device.category AS device_category,
    user_pseudo_id,
    CONCAT(user_pseudo_id, '-', CAST(
      (SELECT value.int_value FROM UNNEST(event_params)
       WHERE key = 'ga_session_id') AS STRING)) AS session_key
  FROM `bigquery-public-data.ga4_obfuscated_sample_ecommerce.events_*`
  WHERE _TABLE_SUFFIX BETWEEN '20210101' AND '20210131'
)
SELECT
  device_category,
  COUNT(DISTINCT user_pseudo_id) AS users,
  COUNT(DISTINCT session_key) AS sessions
FROM events
GROUP BY ROLLUP(device_category)
ORDER BY users DESC| device_category | users | sessions |
|---|---|---|
| (total, the ROLLUP row) | 94,790 | 118,380 |
| desktop | 55,236 | 68,649 |
| mobile | 37,934 | 47,088 |
| tablet | 2,166 | 2,643 |
The sessions add up: 68,649 + 47,088 + 2,643 = 118,380, because a session happens on one device. The users do not: the three rows sum to 95,336, which is 546 more than the 94,790 distinct users in the month, because 546 user_pseudo_id values appear under more than one device category and are counted once in each row. A pseudo-ID is a browser or app instance, not a person, so treat the 546 as rows counted twice rather than as 546 people with two devices. In the GA4 interface the same thing happens with any user metric broken down by a session or event dimension. Read the total from the total row, never from a sum of the rows.
Two things to check before you compare such a query with the GA4 interface. The query counts every pseudo-ID that sent an event, which corresponds to Total users; the column called Users in standard reports is Active users, so the numbers will not match exactly. And if your property’s reporting identity uses User-ID, the interface can count one person across devices once, while user_pseudo_id in the export cannot; count user_id as well where you send it.
The query also shows what a metric is: a calculation over events, not a stored field. Users is a count of distinct user_pseudo_id values; Sessions is a count of distinct user and ga_session_id pairs. When a number in a report looks wrong, rebuilding it from the export is the way to find out which part of the calculation is responsible.
Google Analytics 4 metrics
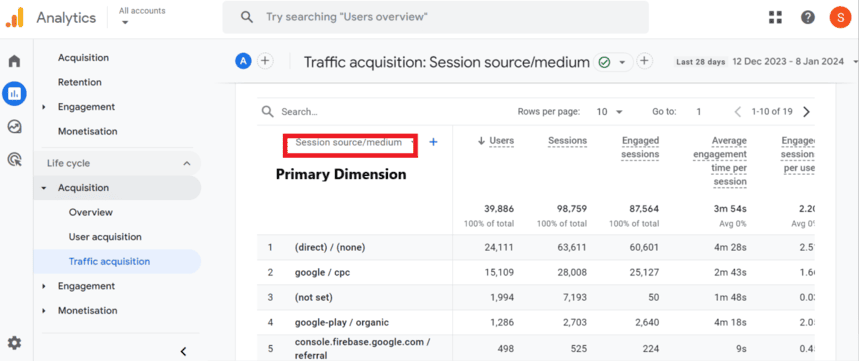
Google Analytics 4 displays data in reports using tables, where each row is a dimension value and each column a metric. For instance, the Session source / medium dimension in the Traffic acquisition report comes with metrics like Users, Sessions, Engaged sessions, Average engagement time per session and Engaged sessions per user.
Types of metrics in Google Analytics 4
Types of metrics in Google Analytics 4
- Predefined metrics: the metrics GA4 provides in its reports and explorations.
- Custom metrics: numeric event parameters you register yourself, with a unit of measurement.
- Calculated metrics: formulas that combine existing metrics or custom metrics, such as revenue per engaged session.
Categories of predefined metrics
- User metrics: Total users, Active users, New users, Returning users.
- Session and engagement metrics: Sessions, Engaged sessions, Engagement rate, Bounce rate, Average engagement time, Views.
- Event metrics: Event count, Key events, Session key event rate, User key event rate.
- E-commerce metrics: Items viewed, Items added to cart, Items purchased, Item revenue, Purchase revenue.
- Revenue and advertising metrics: Total revenue, Total ad revenue, and, with cost data imported, Advertiser ad cost and ROAS.
- Retention metrics: user retention and lifetime value for the cohorts in the Retention report.
An engaged session, which several of these metrics rest on, is defined by Google as a session that lasts longer than 10 seconds, has a key event, or has 2 or more page or screen views (Engagement rate and bounce rate). Bounce rate is its opposite: the share of sessions that were not engaged.
Key events are what GA4 called conversions until March 2024. Google renamed them so that “conversion” means the same thing in Google Ads and Analytics: a key event is any event you mark as important to your business, and a conversion is a key event you also use to measure and bid on ad campaigns (Conversions vs. key events). In the standard reports, the columns read Key events.
Google Analytics 4 dimensions
Dimensions in Google Analytics 4 are attributes of users, sessions, events and items, like Session source / medium, Age, City or Item category. Each dimension has a name and values.
Types of dimensions in Google Analytics 4
Types of dimensions in Google Analytics 4
- Predefined dimensions: the dimensions GA4 provides.
- Custom dimensions: event parameters, user properties or item parameters you register yourself.
Categories of predefined dimensions
- User acquisition dimensions: how users were first acquired (“First user” prefix).
- Session acquisition dimensions: how each session started (“Session” prefix).
- Event and page dimensions: Event name, Page path and screen class, Page title, Landing page, Content group.
- E-commerce dimensions: Item name, Item ID, Item category, Item brand, Transaction ID.
- Demographic dimensions: Country, Region, City, Language, Age, Gender, Interests.
- Tech dimensions: Browser, Device category, Device model, Operating system, Platform, Screen resolution.
Primary and secondary Google Analytics 4 dimensions
- Primary dimension: the dimension a report opens with. You can switch it from the drop-down above the table.
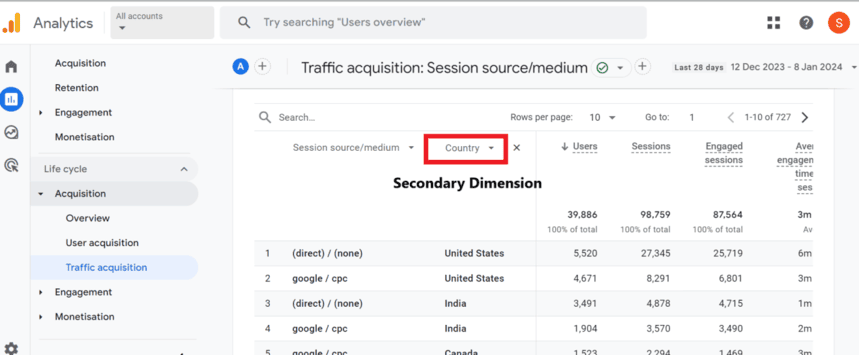
- Secondary dimension: a second dimension added with the + next to the primary one, which splits each row.
Applying more than two dimensions
A standard report takes two dimensions at a time. For more, use Explore: a free-form exploration takes several dimensions as rows and columns, with segments and filters on top.
Custom dimensions in Google Analytics 4
Custom dimensions report on data GA4 does not collect by default: an event parameter such as a form’s name, a user property such as a customer tier, an item parameter such as a product’s colour. You create them under Admin → Custom definitions, and Google says data appears after 24 to 48 hours. Each one needs a scope, and the limits are per property (About custom dimensions and metrics):
| Type | Standard property | Analytics 360 |
|---|---|---|
| User-scoped custom dimensions | 25 | 100 |
| Event-scoped custom dimensions | 50 | 125 |
| Item-scoped custom dimensions | 10 | 25 |
| Custom metrics | 50 | 125 |
| Calculated metrics | 5 | 50 |
Two warnings from the same page. Do not register a unique ID per user or per session, or a timestamp, as a custom dimension: these high-cardinality values push rows into the (other) row of your reports. And after deleting a custom dimension to free a slot, you wait 48 hours before you can add a new one.
What questions can metrics and dimensions answer in standard reports?
What questions can metrics and dimensions answer in standard reports?
Google Analytics 4 typically presents its report information using tables. In these tables, each horizontal line corresponds to a specific dimension’s value, while each vertical column signifies the value of a particular metric. When you open up your Google Analytics 4 account, you can find data in the following types of reports:
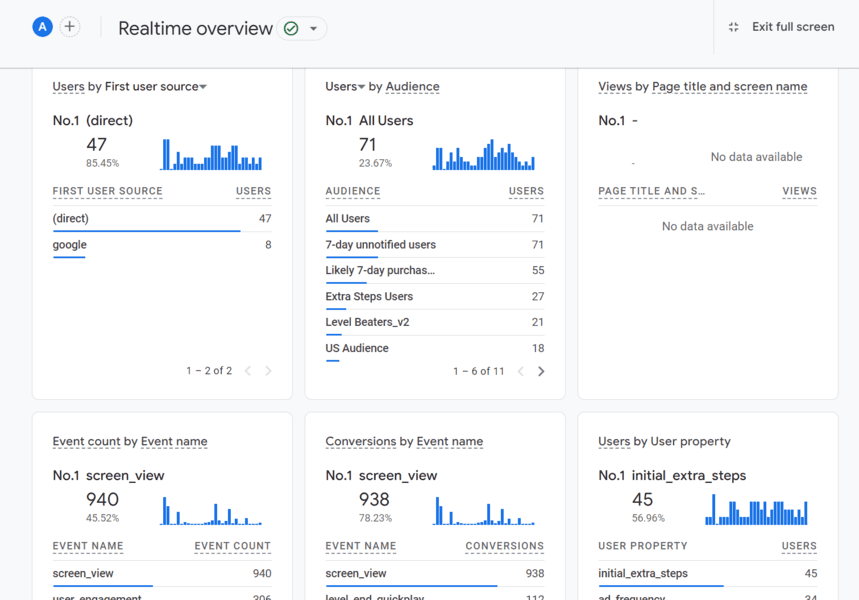
Realtime Reports: These reports provide information about what is happening on your site or app right at the moment. It includes data on active users, the pages or screens they view, triggering events, and the users’ locations.
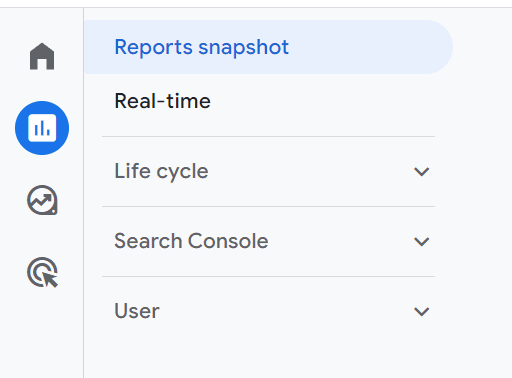
Life Cycle Reports: These reports are centered around the customer life cycle and include
- Acquisition Reports
- Engagement Reports
- Monetization Reports
- Retention Reports
User Reports: These reports provide insights into the characteristics of your users, including demographics, interests, and technology used to access your site or app.
Now, let’s take a look at each type of report and define its main metrics and dimensions.
Realtime reports
The Real-Time report in Google Analytics 4 provides a live overview of user activity on your site or app. It shows current active users, their viewed pages or screens, triggered events, and geographic locations.
Where to find the Realtime Reports: click on Reports in the left panel, then click Realtime.
Metrics
- Active Users: Number of active users on your site or app.
- Views: Total pages or screens viewed.
- Event Count: Number of events triggered.
- Key events: Number of key events.
- Engagement Time: Duration of active engagement.
Dimensions
- Page Title/Screen Class: Title of the webpage or app screen.
- Event Name: Name of the events triggered.
- Location (Country/City): Geographic location of users.
- Source/Medium: Origin of your traffic.
- User Type: New vs. returning users.
Life cycle
The most important reports in this group are Acquisition, Engagement, Monetization, and Retention.
Acquisition
Where to find the Acquisition Metrics and Dimensions: click on Reports in the left panel, then click Lifecycle, then Acquisition.
Overview
Where to find the Overview Report: Click on Reports in the left panel, then click on Lifecycle, Acquisition, and Overview.
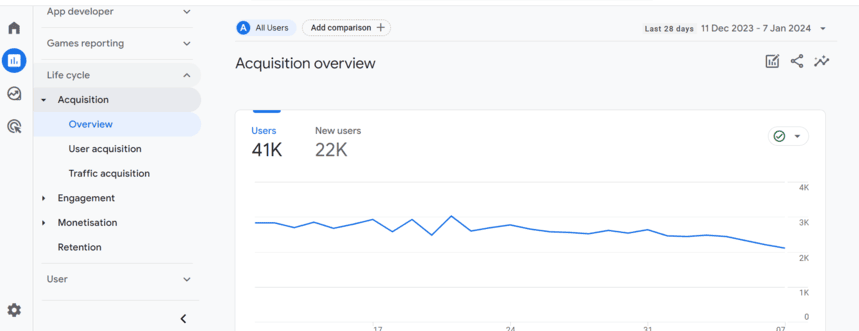
Acquisition Metrics
- Users: The total number of unique users who have visited your site or app in the selected time frame.
- New Users: The number of users who visited your app or site for the first time.
- Sessions: The total number of sessions during the selected period. A session is a group of user interactions with your site or app within a given timeframe.
- Average Session Duration: The average length of a session.
- Engagement Rate: The percentage of engaged sessions based on criteria like session duration or interaction with site elements.
Acquisition Dimensions
- First user default channel group: The channel through which the user first arrived, such as Organic Search, Paid Search, Organic Social, Direct or Referral.
- Source: The origin/source of your traffic, like a search engine (e.g., Google) or a referring domain (e.g., facebook.com).
- Medium: The source category, such as organic (unpaid search), CPC (cost per click, paid search), referral, email, etc.
- Campaign: If you’re using UTM parameters, this dimension shows the specific marketing campaign that directed the user to your site or app.
- Country: The country from which the user is accessing your site or app.
- City: The city from which the user is accessing your site or app.
User acquisition
Where to find the User Acquisition Metrics and Dimensions: Click on Reports in the left panel, then click Lifecycle, then click User Acquisition.
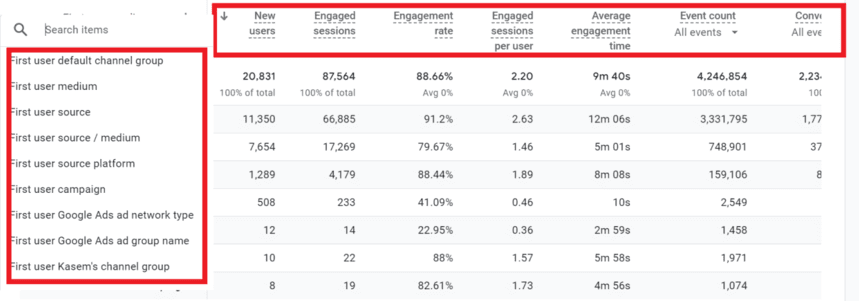
Metrics
- New Users: The count of users who are accessing the platform for the first time within the chosen timeframe.
- Engaged Sessions: The number of sessions that lasted longer than 10 seconds, had a key event, or had at least two page or screen views.
- Engagement Rate: The proportion of sessions in which users engaged meaningfully with your website or application.
- Average Engagement Time per Session: Total engagement time (the time the page was in focus) divided by the number of sessions.
- Event count: The number of events triggered.
- Key events: The number of key events, such as sign-ups or purchases, that new users triggered.
- User key event rate: The percentage of users who triggered any key event, the GA4 counterpart of a conversion rate.
Dimensions
- First User Medium: The term refers to the first type of marketing medium responsible for attracting the user.
- First User Source: This indicates the original website the user visited, which led them to your site.
- First Source/Medium of User: This combination term specifies both the originating website and the marketing medium that directed the user to your site.
- First User Campaign: This refers to the specific marketing initiative that effectively gained the user’s attention.
- First User Google Ads ad network type: This term denotes the category of Google Ads network used when the user was first engaged.
- First User Google Ads ad group name: This is the name of the particular group of ads within Google Ads that succeeded in bringing the user to your website.
Traffic acquisition
Where to find the Traffic Acquisition Metrics and Dimensions: Click on Reports in the left panel, then click Lifecycle, then click Traffic Acquisition.
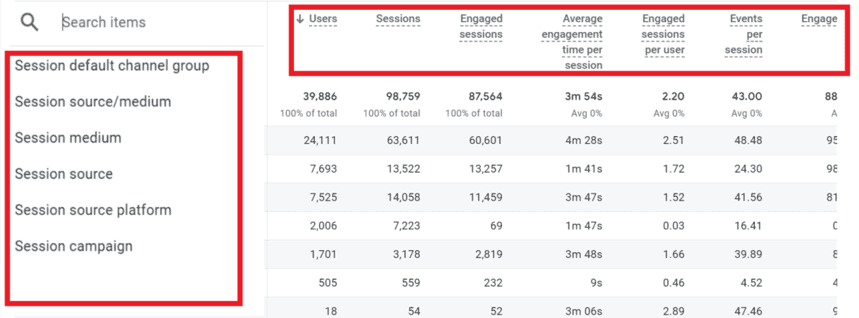
Metrics
- Users
- Sessions
- Engaged Sessions
- Average Engagement Time per Session
- Engaged Sessions per User
- Engagement Rate
- Event Count
- Key events
- Total Revenue
Dimensions
- Session default channel group
- Session Source
- Session Medium
- Session Campaign
- Session Source / Medium
Engagement
The most important reports in this group are Overview, Events, Key events, and Pages and Screens.
Engagement overview
Where to find the Engagement Overview Metrics and Dimensions: click on Reports in the left panel, then click Lifecycle, then click Engagement, and then Overview.
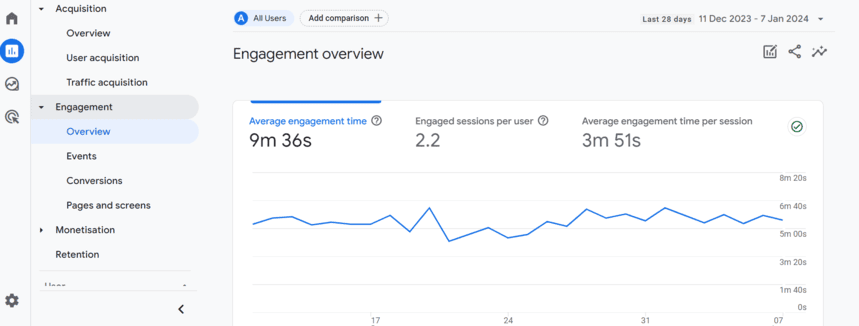
Metrics
- Engaged Sessions: The number of sessions that lasted longer than 10 seconds, had a key event, or had two or more page or screen views.
- Engagements: Total number of engagement events like scrolls, clicks, or video views.
- Engagement Rate: The percentage of sessions that qualify as engaged sessions.
- Average Engagement Time per Session: The average amount of time users spend engaged with your site or app during a session.
- Events: The total number of events recorded.
- Key events: The number of key events users triggered.
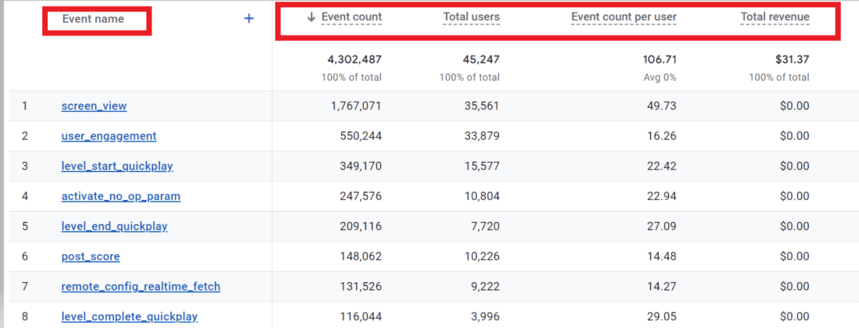
- Event Count per User: Average number of events triggered per user.
Dimensions
- Event Name: The names of the events users are triggering.
- Page Title and Screen Class: The title of the webpage or the name/class of the app screen where engagement occurs.
- User Segment: Different user segments based on predefined or custom criteria.
- Country: The country from which the user is accessing your site or app.
- City: The city from which the user is accessing your site or app.
- Device Category: The type of device (mobile, desktop, tablet) used to access your site or app.
- Platform: The system that operates on the user’s device.
Events report
Where to find the Events Metrics and Dimensions: click on Reports in the left panel, then click Lifecycle, then click Engagement, and then Events.
Key events report
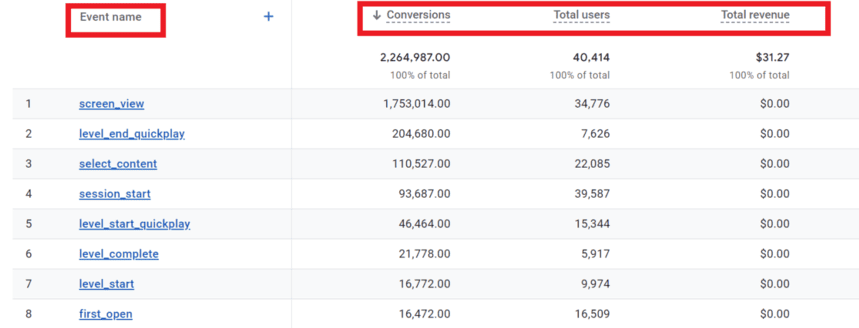
This report was called Conversions until March 2024, and the screenshot below still shows the old name. Where to find the Key events Metrics and Dimensions: click on Reports in the left panel, then click Lifecycle, then click Engagement, and then Key events.
Metrics
- Key events
- Total Users
- Total Revenue
Dimensions
- Event Name
Pages and screens report
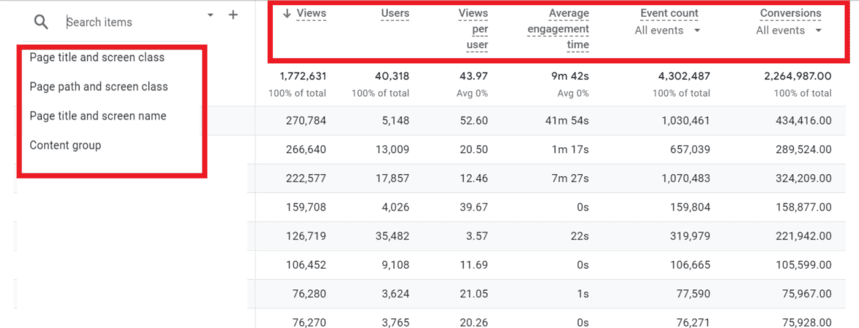
Where to find the Pages and Screens Metrics and Dimensions: click on Reports in the left panel, then click Lifecycle, then click Engagement, and then Pages and Screens.
Metrics
- Views
- Users
- Views per User
- Average Engagement Time
- Event Count
- Key events
Dimensions
- Page Title and Screen Class
- Page Path and Screen Class
- Page Title and Screen Name
- Content group
Monetization
The most important reports in this group are Overview, E-commerce Purchases, In-app Purchases, Publisher ads, Purchase journey, Checkout journey.
Monetization overview
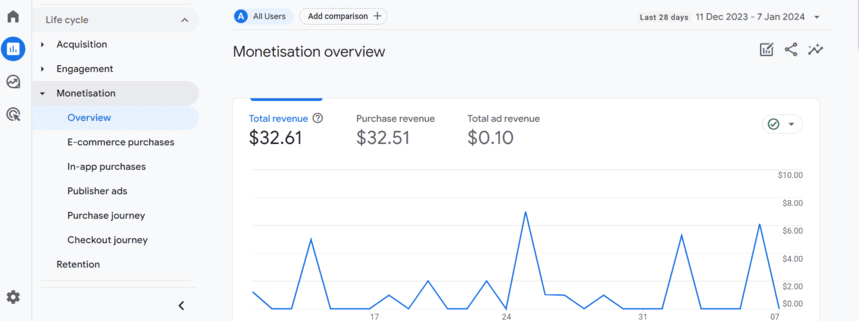
The Monetization Overview report provides insights into the revenue generation and monetization performance of your website or app. This report is essential for understanding how your monetization strategies are performing.
Where to find the Monetization Overview Metrics and Dimensions: click on Reports in the left panel, then click Lifecycle, then click Monetization, and then Overview.
Metrics
- Total Revenue: The total amount of revenue generated from all sources, including e-commerce sales, in-app purchases, and advertising.
- E-commerce Revenue: Revenue generated from e-commerce transactions.
- In-App Purchase Revenue: Revenue from purchases made within an app.
- Ad Revenue: Revenue generated from ads displayed on your site or app.
- Average Revenue per User (ARPU): The average revenue generated per user.
- Transactions: The total number of completed purchase transactions.
- Average Purchase Revenue: The average revenue per purchase transaction.
Dimensions
- Item Name: The name of the item purchased.
- Item Category: The category of the purchased item.
- Affiliation: The store or location where the purchase was made.
- Country: The country from which the purchase was made.
- City: The city from which the purchase was made.
- Date/Time: When the purchase or revenue-generating event occurred.
- Source/Medium: The origin/source and medium of the traffic that led to the monetization event.
- Campaign: The specific marketing campaign associated with the monetization event, identified through UTM parameters.
E-commerce purchases
The E-commerce Purchases report is specifically tailored to track and analyze e-commerce transactions. This report is crucial for understanding the performance of an online store or e-commerce platform.
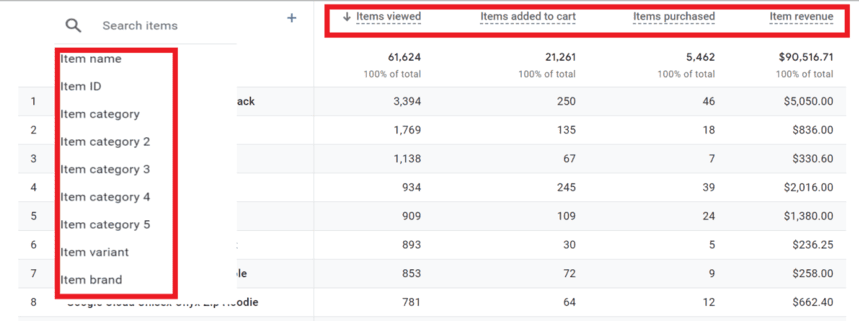
Where to find the E-commerce purchases Metrics and Dimensions: click on Reports in the left panel, then click Lifecycle, then Monetization, and then E-commerce purchases.
Metrics
- Items viewed: The number of times the item’s detail page or screen was viewed.
- Items added to cart: This number reflects how many times users placed products into shopping carts.
- Items purchased: The number of units of each item bought.
- Item revenue: The amount of revenue generated over the purchase.
Dimensions
- Item Name: The name of the item purchased.
- Item ID: The unique identifier of the purchased item.
- Item Category: The category to which the purchased item belongs.
- Item variant: A product’s specific version or variation, distinguished by attributes.
- Item Brand: The trademark or commercial label associated with the product sold.
In-app purchases
The In-app Purchases report is designed to track and analyze transactions made within mobile apps. This report is crucial for app developers and businesses that rely on in-app purchases as a revenue stream.
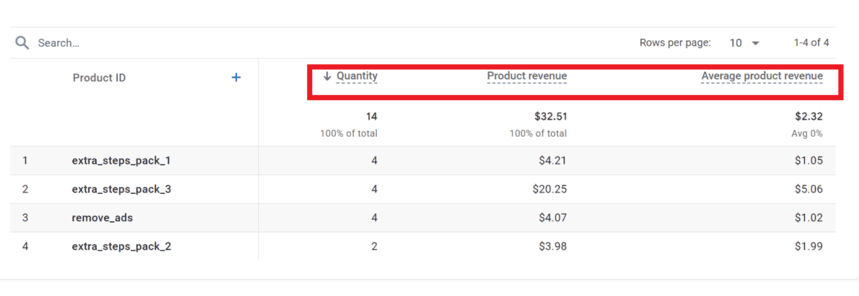
Where to find the In-app Purchases Metrics and Dimensions: click on Reports in the left panel, then click Lifecycle, then Monetization, and then In-app Purchases.
Metrics
- Quantity: The total number of units of a product sold.
- Product Revenue: The total income generated from a product.
- Average Product Revenue: The mean income earned per product sold.
Dimensions
- Product ID: The unique identifier assigned to each product for tracking and analysis.
Publisher ads
In Google Analytics 4 (GA4), the Publisher Ads report is designed for websites and apps that use advertising as a revenue source, particularly those integrated with Google Ad Manager. This report provides insights into the performance of ads published on your site or app.
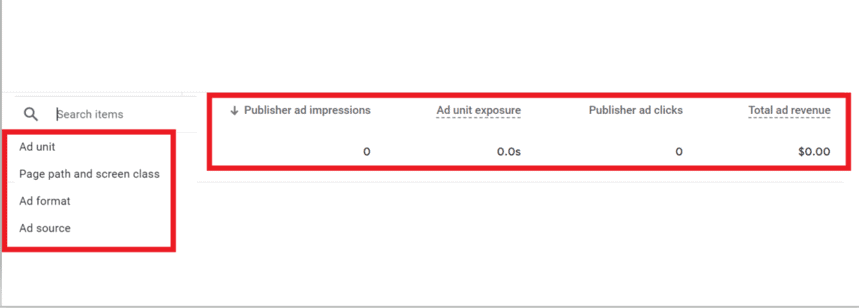
Where to find the Publisher Ads Metrics and Dimensions: click on Reports in the left panel, then click Lifecycle, then click Monetization, and then Publisher Ads.
Metrics
- Publisher ad Impressions: Counts how many times ads from publishers were displayed to users.
- Ad unit exposure: Tracks the visibility and reach of individual ad units.
- Publisher ad Clicks: Tally the number of times users click on publisher ads.
- Total ad revenue: The cumulative earnings from publisher ads.
Dimensions
- Ad Unit: Identifies the specific ad placement or container in GA4 reporting.
- Page path and screen class: Tracks the specific pages or screens where ads appear.
- Ad Format: Classifies the type of ad (e.g., banner, video).
- Ad Source: Specifies the origin or provider of the ad in GA4 analytics.
Purchase journey
This can be used to analyze the customer purchase journey.
Where to find the Purchase Journey Metrics and Dimensions: click on Reports in the left panel, then click Lifecycle, then click Monetization, and then Purchase Journey.
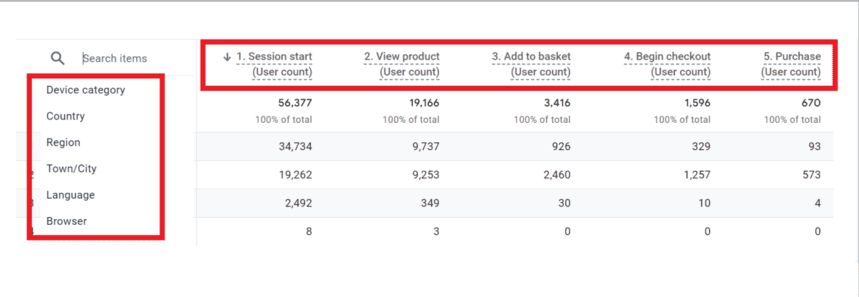
Steps (each shown as a count of users who reached it)
- Session Start
- View Product
- Add to Basket
- Begin Checkout
- Purchase
Dimensions
- Device Category
- Country
- Region
- Town/City
- Language
- Browser
Checkout journey
This analysis is crucial for e-commerce sites to understand how users interact with the checkout process and where potential drop-offs or issues might occur.
Where to find the Checkout Journey Metrics and Dimensions: click on Reports in the left panel, then click Lifecycle, then click Monetization, and then Checkout Journey.
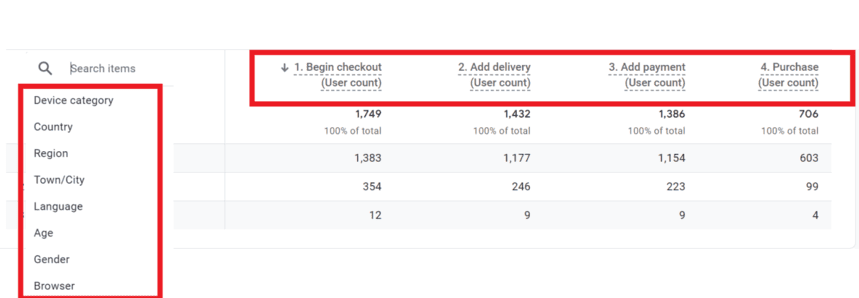
Steps (each shown as a count of users who reached it)
- Begin Checkout
- Add delivery
- Add Payment
- Purchase
Dimensions
- Device Category
- Country
- Region
- Town/City
- Language
- Age
- Gender
- Browser
Retention overview
In Google Analytics 4 (GA4), the Retention Overview report is designed to help you understand how well your site or app retains users over time. This report is crucial for assessing user loyalty and engagement.
Where to find the Retention Overview Metrics and Dimensions: click on Reports in the left panel, then click Lifecycle, then click Retention.
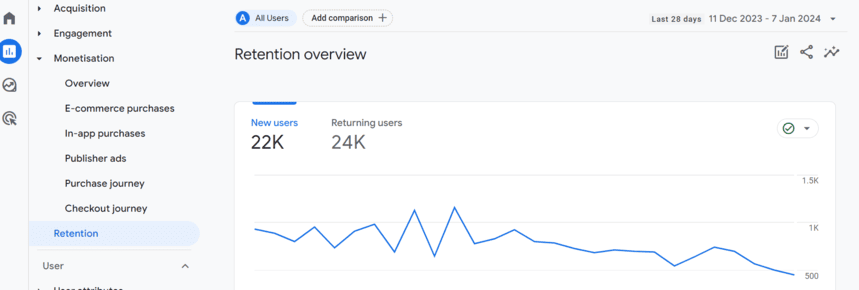
Metrics
- New users and Returning users over time.
- User retention by cohort: the share of users who come back on day 1, day 7 and later after their first visit.
- User engagement by cohort: average engagement time for those cohorts.
- User retention and User engagement over the first weeks.
- Lifetime value: average revenue per user over their first 120 days.
Dimensions
- Date of First Visit: The date when the user first visited the site or app.
- Cohort: The group of users who share a common characteristic, typically defined by their first visit date.
- Cohort Type: The type of cohort, usually based on time (e.g., daily, weekly).
- User Segment: Segments of users based on predefined or custom criteria.
User
The User Report in Google Analytics 4 (GA4) provides a detailed view of user demographics, behaviors, and engagement on your website or app. It emphasizes user-centric metrics and cross-platform tracking, offering insights into user journeys over time. This report aids in understanding user interactions, facilitating more informed marketing and UX decisions. The most important reports in this group are User Attributes and Tech Reports.
User attributes
In Google Analytics 4 (GA4), the User Attributes report provides insights into the characteristics and attributes of your users. This report is essential for understanding your audience’s demographics, interests, and behaviors.
Where to find the User Attributes Overview Metrics and Dimensions: click on Reports in the left panel, then click User, then click User Attributes, and then Overview.
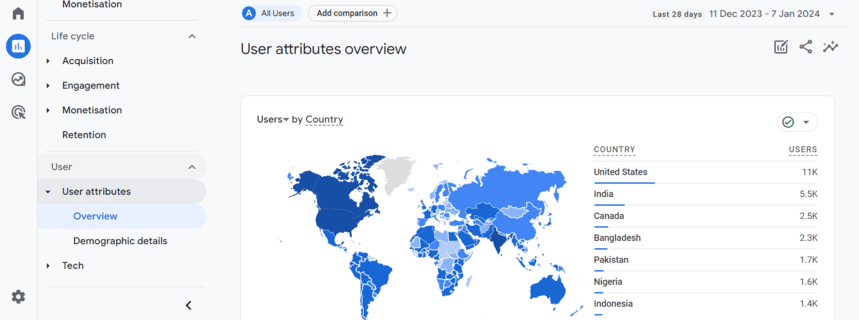
Metrics
- Users: The overall count of distinct users who have engaged with your website or application.
- New Users: The number of users who visited your site or app for the first time.
- Returning Users: The number of users who return to your site or app.
Dimensions
- Demographics: Includes age, gender, and other demographic information.
- Interests: User interests based on their online browsing and behavior.
- Geography: Geographic location of users, including country, region, and city.
- Device Category: The type of device used (e.g., mobile, desktop, tablet).
- Language: The language settings of the user’s browser or device.
- User Type: Differentiates between new and returning users.
Demographic details
In Google Analytics 4 (GA4), the Demographic Details report provides insights into the demographic composition of your audience. This information is crucial for understanding who your users are in terms of age, gender, and other demographic factors.
Where to find the Demographic details Metrics and Dimensions: Click on Reports in the left panel, then click User, then User Attributes, and then click Demographic details.
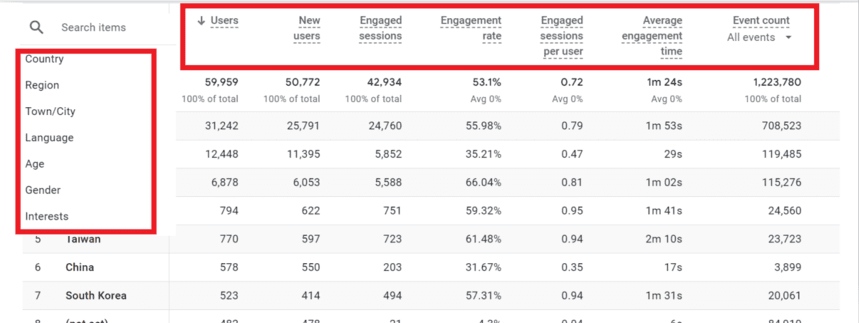
Metrics
- Users
- New Users
- Engaged sessions
- Engagement Rate
- Engaged sessions per user
- Average Engagement Time
- Event count
- Key events
- Total revenue
Dimensions
- Country
- Region
- Town/City
- Language
- Age
- Gender
- Interests
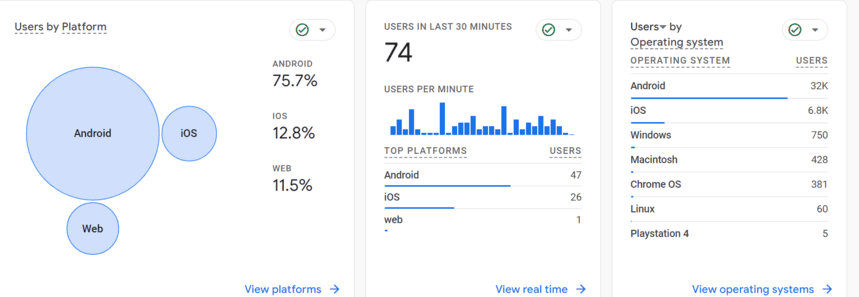
Tech
Offers detailed insights into the technology used by your audience, including device types, operating systems, and browsers.
Where to find the Tech Overview Metrics and Dimensions: Click on Reports in the left panel, then click User, then click Tech, and then Overview.
Metrics
- Users: The total number of unique users interacting with your site or app using different technologies.
- New Users: The number of first-time users on your site or app segmented by technology.
- Engagement Rate: The percentage of engaged sessions for each technology.
- Average Engagement Time: The average duration of time users spend on your site or app, segmented by technology.
- Key events: The number of key events, what Universal Analytics called goal completions, broken down by technology.
- Revenue: Total revenue generated from users, segmented by their technology (relevant for e-commerce or monetized sites/apps).
Dimensions
- Browser: The web browsers used by your audience (e.g., Chrome, Safari, Firefox).
- Operating System: The operating systems of the devices used (e.g., Windows, macOS, Android, iOS).
- Device Category: The type of device used (e.g., mobile, desktop, tablet).
- Screen Resolution: The display resolutions of the devices used.
- App Version (for mobile apps): The version of your mobile app being used.
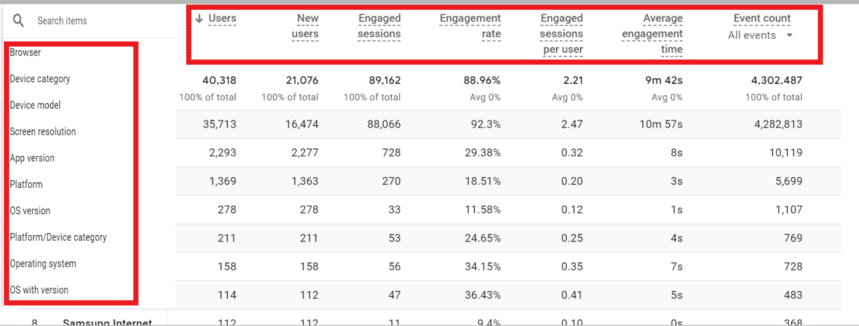
Tech details
Where to find the Tech Details Metrics and Dimensions: Click on Reports in the left panel, then click User, then Tech, and then Tech Details.
Metrics
- Users
- New Users
- Engaged sessions
- Engagement Rate
- Engaged sessions per user
- Average Engagement Time
- Event count
- Key events
- Total Revenue
Dimensions
- Browser
- Device Category
- Device model
- Screen Resolution
- App Version
- Platform
- OS Version
- Platform/Device Category
- Operating System
- OS with version
How can I track the state of my website e-commerce?
How can I track the state of my website e-commerce?
The E-Commerce reports in Google Analytics 4 (GA4) provide a comprehensive view of your online store’s performance, allowing you to track and analyze various aspects of customer interactions and transactions. Here’s an overview of what you can expect from the GA4 E-Commerce reports.
E-commerce purchase report
The metrics related to items in an e-commerce context provide valuable insights into customer behavior and revenue generation.
‘Items viewed’ reflects the number of times customers click on items for more details, highlighting popular products.
‘Items added to cart’ signifies purchase intent, indicating the items customers are considering buying.
‘Items purchased’ directly measures successful transactions, revealing the actual number of items bought.
Finally, ‘Item revenue’ serves as a key financial indicator, representing the total revenue generated from the sale of items, providing a comprehensive view of the e-commerce performance.
Purchase journey report
The Purchase Journey Report in GA4 tracks the customer’s path through stages like product views, cart additions, and purchases. It highlights where customers drop off and which stages drive conversions, offering insights into different user behaviors and the effectiveness of marketing campaigns. This customizable report is key for understanding and improving the e-commerce purchase process.
Checkout journey report
The Checkout Journey Report in GA4 focuses on the checkout process, detailing user progression from cart addition to purchase completion. It emphasizes checkout abandonment, identifying stages where users drop off. This report is essential for pinpointing checkout issues and optimizing the process to enhance user experience and increase conversions.
These reports in GA4 provide valuable insights into consumer behavior, helping businesses optimize their e-commerce strategies for better engagement and increased sales. They play a crucial role in pinpointing obstacles within the purchasing journey and in guiding data-driven choices to improve the overall user experience on your website.
Cost and return on ad spend
If you run ads on more than Google, the metrics you most want next to sessions and revenue are cost, clicks and return on ad spend per campaign. Universal Analytics had a Cost Analysis report for this. GA4 has no report by that name, and it knows the cost of Google Ads campaigns only because the accounts are linked.
For other platforms, GA4 shows cost after you import it. Google now calls the feature campaign data import: direct connections for some platforms, and file or warehouse uploads for the rest. With cost imported, Google’s Import campaign data page says the result appears in Reports → Acquisition → Non Google campaign, and in the Advertising section under All channels. Our guide to cost data import covers the fields, the match on source, medium and campaign, and the limits.
To analyse it your own way:
- Import the cost data first. Without it, cost metrics are empty for non-Google campaigns.
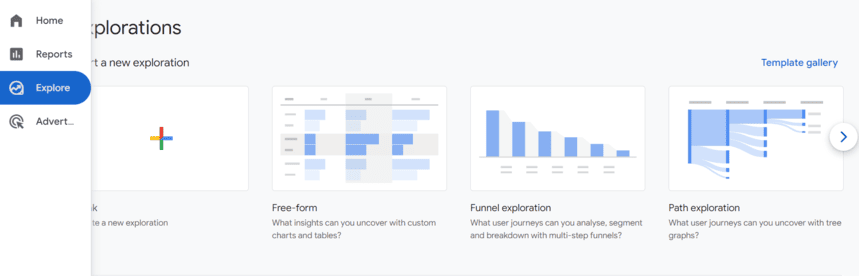
- Go to Explore and start a blank exploration.
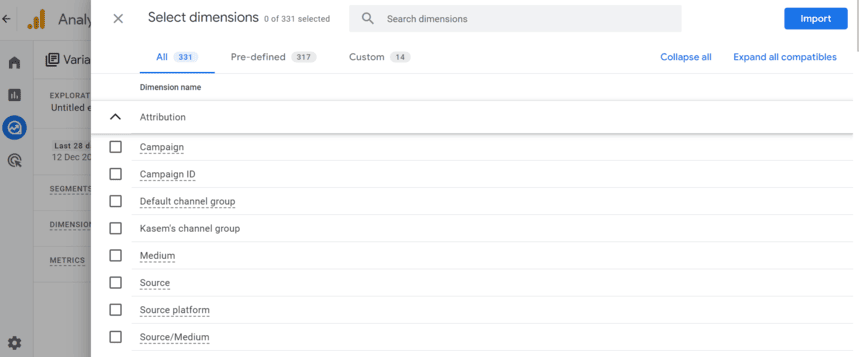
- Add dimensions such as Session source / medium and Session campaign, and metrics such as Sessions, Key events, Total revenue, and the cost and ROAS metrics the import makes available.
- Keep the scope consistent. Imported cost is matched on session source, medium and campaign, so pair it with session-scoped dimensions, not “First user” ones.
- Apply segments and filters for the campaigns or channels you are comparing, choose a table or a chart, and save the exploration to share it.
Two limits to know. Imported cost is joined at reporting time and is not in the BigQuery export, so you cannot rebuild ROAS from the export alone. And a non-Google campaign whose UTM tags do not match the uploaded rows exactly gets sessions but no cost.
Useful links
- How to set up Google Analytics 4 and use it as effectively as possible.
- E-commerce tracking in Google Analytics 4: the events behind the Monetization reports.
- Cost data import in GA4: how to bring non-Google ad costs into the Non Google campaign report and compare the profitability of channels.
- Channel grouping in GA4: the rules behind the default channel group dimension.
Wrapping up
- A dimension describes, a metric counts. Every report is dimensions in rows and metrics in columns.
- Check the scope before you combine: “First user” dimensions describe users, “Session” dimensions describe visits, unprefixed traffic dimensions describe key events, and “Item” dimensions describe products.
- User counts do not add up across rows of a session or event dimension. Read the total row.
- Conversions are now key events in GA4 reports; “conversion” means a key event used for Google Ads.
- Custom dimensions are limited (25 user-scoped, 50 event-scoped, 10 item-scoped on a standard property), so register the ones you will report on, never IDs or timestamps.
- GA4 shows only what happens on your own site and app, and only what its tags collect.
When GA4’s own reports are not enough
When GA4’s own reports are not enough
The GA4 interface samples large explorations, keeps event-level data for 14 months at most on a standard property, and cannot join data from other systems. Its native BigQuery export removes most of those limits: the raw events land in your own project (a standard property’s daily export has an event limit), where it can be queried in full and joined with ad spend, orders or CRM data. The setup is covered in connecting GA4 to BigQuery.
Once the events are in the warehouse, OWOX Data Marts lets an analyst publish the SQL behind a report as a Data Mart and delivers reports on it to Sheets or Data Studio (the former Looker Studio) on a schedule. It does not collect or change GA4 data: it works on the tables the export wrote. How raw export tables become reporting tables is covered in GA4 export to BigQuery and data modeling.
Turn your data into decisions.
Governed data marts give you the clean foundation ML needs to actually work.
- No AI hallucinations
- Analyst-governed definitions
- Every number traces to SQL
Frequently Asked Questions
How do you set up custom dimensions in Google Analytics 4?
In GA4 open Admin, then Custom definitions under Data display, click Create custom dimension, and enter the name, the scope (event, user or item) and the event parameter or user property it reads. The parameter itself has to be sent by your tag. New custom dimensions can show (not set) for the first 24 hours.
What are metrics in Google Analytics 4?
Metrics in Google Analytics 4 are quantitative measurements that track user interactions on a website or app. Examples include page views, sessions, and user engagement time. These metrics provide insights into user behavior, helping businesses understand performance and user experience.
What is the difference between custom dimensions and metrics in GA4?
Custom dimensions in Google Analytics 4 are attributes or characteristics of data, like page category or user type, providing context to data. Custom metrics, on the other hand, are quantifiable measurements, like total spending or number of downloads. Dimensions categorize and segment data, while metrics quantify and measure it.
Why monitor dimensions and metrics in Google Analytics 4?
Monitoring dimensions and metrics in Google Analytics 4 is crucial for understanding user behavior on your website or app. It helps in identifying trends, user demographics, and sources of traffic. This data is invaluable for optimizing marketing strategies, improving user experience, and making data-driven decisions to enhance overall business performance and customer engagement.
What are the metrics and dimensions in Google Analytics 4?
Reports in Google Analytics 4 consist of dimensions and metrics. Dimensions are attributes with text or date values, such as City or Session source / medium. Metrics are numbers, such as Sessions, Engaged sessions or Key events. Each dimension has a scope: user ("First user" dimensions), session ("Session" dimensions), event or item. Scope decides what a row means and whether a metric can be added up across rows: sessions add up across device categories, users do not.
What questions can metrics and dimensions answer in standard reports?
1. Learn more about your users, where they're from, what devices they're using to view your website, what kind of interest they have, etc.
2. Find out how well your site engages users by looking at engagement rate, views per session and average engagement time.
3. Monitor whether users complete purchases and other key events, and generate revenue at the rate you want.
4. Learn from which sources visitors come to your website: search engines, social networks, or website referrals.