Marketing attribution models: how each one works and how to build your own
A marketing attribution model is the rule that decides which touchpoint gets credit for a sale. This guide explains every model with worked examples, shows where machine-learning attribution fits, and walks through building your own model in the warehouse with SQL you can run today.
People rarely buy on the first visit. A customer sees a paid ad, comes back from an email, searches for the brand, and finally orders from a bookmark. Four touchpoints, one order. Which of them earned the revenue? The answer depends entirely on the attribution model you apply, and the model you apply decides where next quarter’s budget goes.
This guide explains every marketing attribution model that matters, from last click to Markov chains and machine learning, with the same worked example throughout so you can see how the credit moves. It then does what most guides skip: it shows how to build an attribution model in your own warehouse, with SQL you can run against a GA4 export today, and how to turn that query into a number a business user can ask for without touching SQL.
Note: Originally published in 2019. Fully rewritten in October 2026: the sections about a retired OWOX product were removed, the machine-learning and build-your-own sections were added, and every third-party fact was re-checked against its source.
What an attribution model is
A marketing attribution model is a set of rules that decides how much credit each touchpoint in a customer’s journey gets for a conversion. The journey is the sequence of sessions a person had before buying or signing up. The conversion is the order, the lead, the subscription. The model is the arithmetic that distributes the conversion’s value across the sessions.
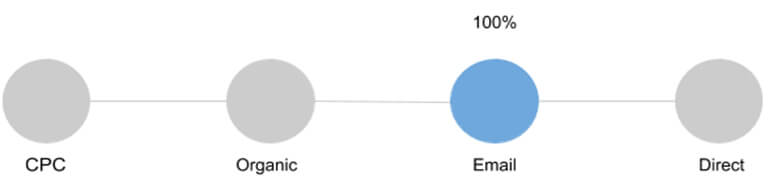
That definition hides the important point: the model is a choice, not a fact. The same journey gives email 100% of the credit under one model, 25% under another and 0% under a third. None of them is “correct”. Each one answers a different question, and the job is to pick the question you actually need answered.
Attribution also has a quieter purpose. It forces a company to decide who owns the number. When nobody does, every team runs the model that flatters its channel, the reports disagree, and the budget meeting becomes an argument about arithmetic instead of a decision.
Why the model moves budget
Attribution is where marketing performance becomes money. Shift credit from the last click to the first, and the channels that look expensive today look cheap tomorrow. A model is only useful if it changes something, and what it changes is spend.
- Budget allocation. Attribution shows which channels and campaigns drive conversions, so money moves from what only looks efficient to what is.
- Proving marketing’s impact. It gives the team evidence for its spend, in terms leadership accepts, instead of a stack of channel reports that each claim the same sale.
- Journey insight. Seeing how customers actually move between channels shows where the funnel leaks and which touchpoints only matter in combination.
- Product decisions. What people engage with before buying is a signal about what they value.
Despite all this, 41% of marketers in a Bazaarvoice survey (December 2022, checked October 2026) said last touch was their most used attribution method. Last touch is popular because it is easy, not because it is right.
OWOX Data Marts
See your first report built in real time. 15 minutes.
- Connect your data warehouse
- Pick your metrics
- Get a live Google Sheets report
In the time it takes to write a ticket. Then imagine never writing that ticket again.
Book a DemoWe'll use your actual use case
The four model families
Dozens of attribution models exist, but they fall into four groups by the logic they use. Knowing the family tells you most of what you need to know about a model.
- Single-touch models give all the credit to one session: the first, the last, or the last that was not direct.
- Multi-touch models split the credit across every session in the path by a fixed rule: equally, by recency, or by position.
- Algorithmic models derive the split from data, by asking what each channel’s presence contributed to the probability of converting. Data-driven attribution, Markov chains and Shapley values belong here.
- Machine-learning models are algorithmic models that learn the weights from converting and non-converting paths, often with features beyond channel order such as time, device and creative.
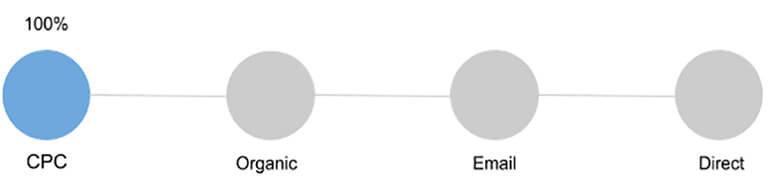
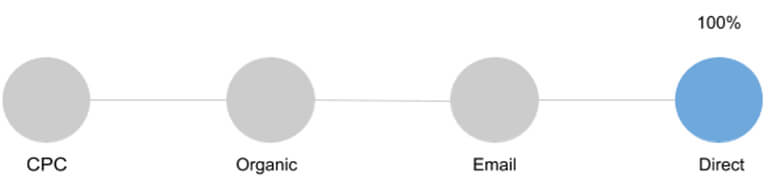
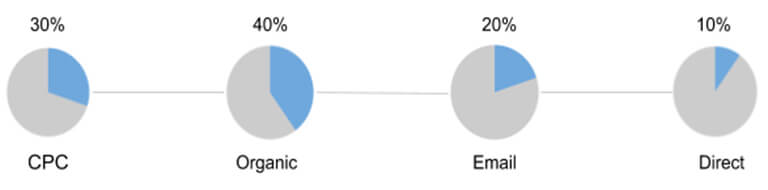
The rest of this guide walks through them in that order, with the same four-touch journey each time: a CPC click, then an Organic visit, then an Email click, then a Direct visit that converts.
Single-touch models
Single-touch models are where almost everyone starts, and most analytics tools default to one of them. They are easy to explain and impossible to argue with, which is also their weakness: they describe one moment of a journey and ignore the rest.
First click
First click gives 100% of the conversion value to the session that brought the user in. In the example journey, the CPC click earns everything.
Pros: nothing to calculate and nothing to argue about. It tells you which channels generate demand that eventually converts.
Cons: it ignores everything that happened after the first visit, so retargeting, email and nurturing look worthless.
Suits businesses focused on acquisition and brand awareness, and products with short sales cycles where the first visit decides the sale.
Last click
Last click gives 100% of the value to the session in which the conversion happened. In the example, Direct earns everything.
Pros: familiar, directly observable, and good at showing which messages close a sale. Useful for short, impulse purchases and for tuning the final stage of a nurture sequence.
Cons: everything before the last session is invisible, and the longer the sales cycle, the more that hides. Direct and brand search absorb credit that paid and content channels earned.
Suits businesses with a short cycle and a handful of channels.
Last non-direct click
Last non-direct click is last click with one exception: if the converting session was Direct, the credit moves back to the previous session. The logic is that a user who typed the URL already knew the brand, and something else got them there. In the example, Email earns everything.
Pros: keeps the focus on channels you pay for and can act on, and is a sensible baseline to compare other models against. Universal Analytics used it by default for years, which is why so many teams still think in it.
Cons: still a single-touch model, so the channels that introduced the customer are undervalued. Email is often the second-to-last step, so it tends to over-earn.
Suits teams evaluating a specific paid channel where brand awareness is no longer the problem.
The three models above share one flaw: they can be gamed and they can mislead. A channel that always appears last will look like the hero under last click no matter how little it contributed. That is why multi-touch models exist.
Multi-touch models
Multi-touch models split a conversion’s value across every session in the path. The split is still a fixed rule rather than something learned from data, but it at least acknowledges that the journey had more than one step.
Linear
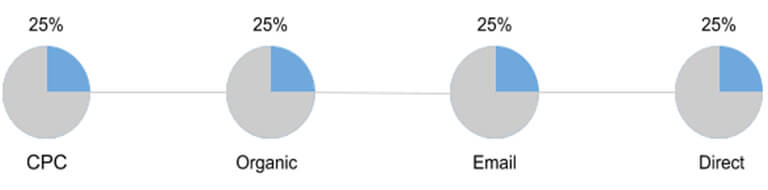
The linear model gives every touchpoint an equal share. Four sessions, 25% each. Because the value is divided into fractions, this is also what people mean by fractional attribution: any model that splits one conversion into partial credits rather than assigning it whole.
Pros: simple, considers the whole path, and the easiest multi-touch model to explain to stakeholders.
Cons: equal credit is almost never true credit. It is useless for reallocating budget, because it assumes every channel is equally effective by construction.
Suits B2B and other long-cycle businesses where staying in touch at every stage matters more than ranking the stages.
Time decay
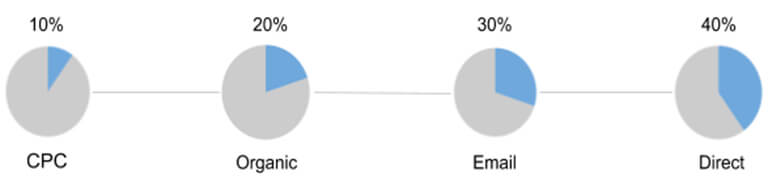
Time decay gives more credit to sessions closer to the conversion and less to earlier ones. In the example, Direct earns most and CPC least.
Pros: every session gets a share, and the ones that closed the sale get the biggest. Useful for optimising the channels that drive last-mile conversions.
Cons: the channels that opened the funnel are systematically underrated, and for short cycles the decay barely matters.
Suits short campaigns and considered purchases where the final nudge is what you want to tune. If the cost of touchpoints differs a lot, a position-based model usually reads better.
Position-based (U-shaped)
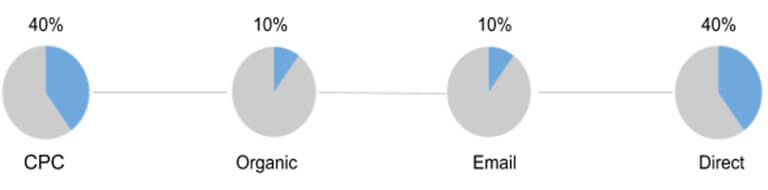
Position-based attribution gives 40% to the first session, 40% to the last, and splits the remaining 20% across the middle. It treats introducing the customer and closing the sale as the two moments that matter most.
Pros: rewards the channels that most often do the important work, acquisition and conversion, without ignoring the middle.
Cons: mid-funnel sessions that added items to the cart or captured an email get a token share, when they may have been decisive.
Suits businesses that need to attract new audiences and convert existing visitors in equal measure.
Worth knowing: Google removed first click, linear, time decay and position-based attribution from Google Analytics 4 in November 2023 (Google’s attribution models page, checked October 2026). GA4 now offers data-driven attribution and two last-click variants. If you want the rule-based models, you build them yourself, which the section below shows.
Algorithmic models
Rule-based models decide the split before looking at the data. Algorithmic models reverse that: they look at every converting and non-converting path and work out how much each channel’s presence changed the outcome. The three you will meet are data-driven attribution, Markov chains and Shapley values, and the last two are the mathematics behind the first.
Data-driven attribution (Shapley values)
Google’s data-driven attribution is the model most people have access to, since GA4 and Google Ads ship it by default. It assigns credit by comparing what happened with what would have happened without each touchpoint. The classical form of that idea is the Shapley value from cooperative game theory: each player’s share of the winnings equals their average marginal contribution across every coalition they could join.
A short example shows the arithmetic. Two paths lead to orders:
- Facebook → Direct → $500 order
- Direct → $300 order
Value by coalition: Facebook and Direct together are worth $500, Direct alone $300, Facebook alone $0.

Where n is the number of channels, v is the value a coalition produces, and k is the number of channels in coalition K.
Facebook: on its own it brought nothing, so the first term is 0. With Direct the pair brought $500 and Direct alone brought $300, so Facebook’s marginal contribution is $200, which the formula halves to $100. Facebook’s value is $100.
Direct: alone it brought $300, halved to $150. Added to Facebook it took the pair from $0 to $500, halved to $250. Direct’s value is $400.
The result does not depend on the order of touches, only on whether a channel’s presence raised the outcome. That is what Google means when it says the model is “data-driven”.
Pros: evidence-based, updates itself as data arrives, and already integrated into Google Ads and GA4.
Cons: you cannot see the weights, cannot change them, and cannot reproduce the number outside Google. The model only sees the touches Google can see, so your CRM, offline sales and refunds are invisible to it. For a team that needs to defend a number to the board, “the platform said so” is a weak answer.
Markov chains
A Markov chain treats the journey as a sequence of states and asks a sharper question: if this channel did not exist, how many conversions would we lose? That quantity, the removal effect, is the channel’s credit. It is the model behind most “custom attribution” projects, and it is the one search query on this page that people actually click through for.
Three paths from an e-commerce site:
- C1 → C2 → C3 → Purchase
- C1 → no conversion
- C2 → C3 → no conversion
C1, C2 and C3 are sessions from three sources, say Google CPC, Facebook and email. Each path gets a Start state and an end state, Conversion or Null, and is broken into pairs of transitions, because the model evaluates every possible step from one state to the next:
- C1 → C2 → C3 → Conversion becomes Start → C1 → C2 → C3 → Conversion, broken into the pairs Start → C1, C1 → C2, C2 → C3 and C3 → Conversion.
- C1 becomes Start → C1 → Null: the pairs Start → C1 and C1 → Null.
- C2 → C3 becomes Start → C2 → C3 → Null: the pairs Start → C2, C2 → C3 and C3 → Null.
From the pairs you count transition probabilities. Two of three paths start at C1, one at C2. From C1, half the users go on to C2 and half leave. From C2 everyone goes to C3. From C3, half convert and half leave.
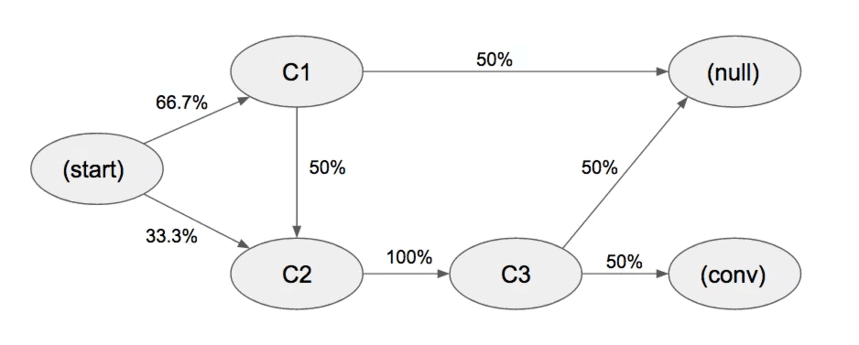
Both routes to a conversion run through C2. The removal effect makes that visible: delete each channel in turn and recompute the conversion probability.
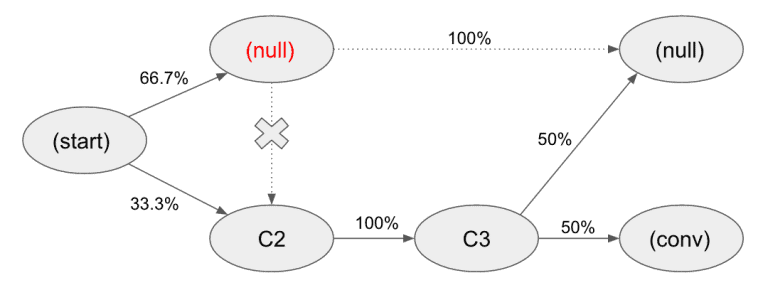
1. Conversion probability without each channel. Remove C1 and the only surviving route is Start → C2 → C3 → Conversion: 0.33 × 1 × 0.5 = 0.167. Remove C2 or C3 and no route survives: 0.
2. Removal effect. The share of conversions lost, relative to the full model’s probability of 0.33:
- R1 = 1 − 0.167 / 0.33 = 0.5
- R2 = 1 − 0 = 1
- R3 = 1 − 0 = 1
3. Channel value. Each removal effect divided by the sum of all of them (2.5): C1 earns 0.2, C2 earns 0.4, C3 earns 0.4.
Pros: every touch counts, the removal effect is intuitive to explain, and the model captures how channels hand users to each other. It adapts to any business because it is built from your own paths.
Cons: it needs a lot of paths to be stable, it assumes the next step depends only on the current state (memorylessness), and it takes statistical skill to build and interpret. Where it is not built in-house, it is bought as a black box.
Machine-learning attribution
Machine-learning attribution is the name for algorithmic models that learn the weights rather than compute them from a fixed formula. Google’s data-driven model is one, since it trains on your converting and non-converting paths. Others fit a logistic regression, a survival model or a gradient-boosted classifier to predict conversion from the touches in a path, then read each channel’s credit off the fitted model. The counterfactual question is the same as Markov’s: how much did this touch change the probability of converting?
What distinguishes an ML model is the features it can use. Beyond channel order it can learn from time between touches, device, creative, landing page, and anything else in the path. That is the promise: a model that notices a retargeting ad only works within three days of a cart abandonment, where a rule-based model gives it a flat share.
The cost is the same as any learned model: it needs volume, it needs non-converting paths as well as converting ones, and it is only as explainable as the person who owns it decides to make it. A vendor’s ML attribution is a black box by design. A model your own analyst trained on your own warehouse data can be inspected, re-run, and challenged. If “machine learning attribution” is what brought you to this page, that is the question to ask of any product offering it: can I see the paths it learned from and reproduce its number?
If you want the wider picture of where ML fits in marketing, machine learning in marketing covers the other use cases.
Why standard models fail
Most teams run the model that is easiest to see, which is whatever their analytics tool defaults to. Three things usually sit behind that.
- Limited awareness of the alternatives. Few teams have seen what their channel mix looks like under a second model, so there is no felt need to change.
- Nobody owns attribution. When no one does, each team reports under the model that favours it, the numbers conflict, and the one with the loudest voice wins.
- The data is scattered. A platform’s built-in model only sees that platform. Google’s model does not see your Facebook spend, your CRM’s closed deals or your refunds, and Facebook’s model does not see Google. Each one claims the same sale.
The fix for the third problem is also the fix for the first two: put sessions, ad spend and conversions in one place your analyst controls, and run the models there. That is what the next section does.
Build your own model
Building your own model sounds like a data-science project. For the rule-based models it is one SQL query, and for the algorithmic ones it is a script that reads from the warehouse and writes a table back. What you need is a session table with a channel on each row and a conversion value where one happened. The GA4 export to BigQuery provides exactly that, and modelling the GA4 export explains its shape if it is new to you.
Step 1: build the path from sessions
The query below runs against a standard GA4 export. It builds one row per session, takes the session’s channel from the first event that carried a traffic source (collected_traffic_source, the UTM values GA4 recorded on the hit), adds any purchase revenue, keeps the users who converted in the window, and computes four models at once, by channel. Replace the project, dataset and dates with yours. The lines are short so the query reads on a phone; it runs as written.
WITH e AS (
  SELECT
  user_pseudo_id AS uid,
  event_timestamp AS ts,
  ecommerce AS ec,
  collected_traffic_source
    AS src,
  (SELECT value.int_value
    FROM
    UNNEST(event_params)
    WHERE key =
    'ga_session_id')
    AS sid
  FROM `p.ga4.events_*`
  WHERE _TABLE_SUFFIX
    BETWEEN '20260801'
    AND '20260930'
),
s AS (
  SELECT
  uid,
  sid,
  MIN(ts) AS started_at,
  ARRAY_AGG(
    CONCAT(
      src.manual_source,
      ' / ',
      src.manual_medium)
    IGNORE NULLS
    ORDER BY ts
    LIMIT 1
  )[SAFE_OFFSET(0)]
    AS channel,
  SUM(ec.purchase_revenue)
    AS revenue
  FROM e
  GROUP BY 1, 2
),
t AS (
  SELECT
  uid,
  COALESCE(channel,
    '(direct) / (none)')
    AS channel,
  ROW_NUMBER() OVER (
    PARTITION BY uid
    ORDER BY started_at
  ) AS touch_no,
  COUNT(*) OVER (
    PARTITION BY uid
  ) AS touches,
  SUM(revenue) OVER (
    PARTITION BY uid
  ) AS path_rev
  FROM s
  WHERE uid IN (
    SELECT uid FROM s
    WHERE revenue > 0
  )
)
SELECT
  channel,
  SUM(IF(touch_no = 1,
    path_rev, 0))
    AS first_click,
  SUM(IF(
    touch_no = touches,
    path_rev, 0))
    AS last_click,
  SUM(path_rev / touches)
    AS linear,
  SUM(CASE
    WHEN touches = 1
      THEN path_rev
    WHEN touches = 2
      THEN path_rev * 0.5
    WHEN touch_no
      IN (1, touches)
      THEN path_rev * 0.4
    ELSE path_rev * 0.2
      / (touches - 2)
    END) AS position_based
FROM t
GROUP BY channel
ORDER BY linear DESC
Each column is a model. Under first_click the whole path’s revenue (path_rev) lands on the first session’s channel; under last_click on the last; linear divides it equally; position_based applies the 40 / 20 / 40 rule, with the two-session case split evenly so no credit is lost.
Two simplifications are deliberate, and a production model fixes both. The query treats all of a user’s sessions in the window as one path, so a session after the purchase still counts; a real model cuts the path at each conversion. And it has no lookback window; most teams cap the path at 30 or 90 days before the conversion. Both are a WHERE clause away once you have decided the rule, and deciding the rule is the actual work.
Step 2: add the models that need more than SQL
Markov chains and Shapley values need every path, converting or not, and iterate over them. That is a job for Python or R reading the touches table above, not for a single query. The R and Python package ChannelAttribution implements both models from a table of paths, and a few dozen lines of your own code do the same. Either way the output is a small table, channel and credit, written back to the warehouse next to the rule-based columns. Build a marketing attribution model in BigQuery walks through sessionising the GA4 events and attributing ad cost to sessions, which is the step before any of this if you want cost in the same table as credit.
Step 3: publish the query as a Data Mart
A query in a notebook is an experiment. The moment someone else needs the number, it becomes a liability: the next person re-runs it with a different window, or copies it into a spreadsheet and the two drift apart. The fix is to publish the SQL once, with its joins and its definitions, and let every report and every question read from that one surface. In OWOX Data Marts that surface is a Data Mart: the analyst’s SQL, the fields it exposes, the joins to the Data Marts it depends on, and who may read it.
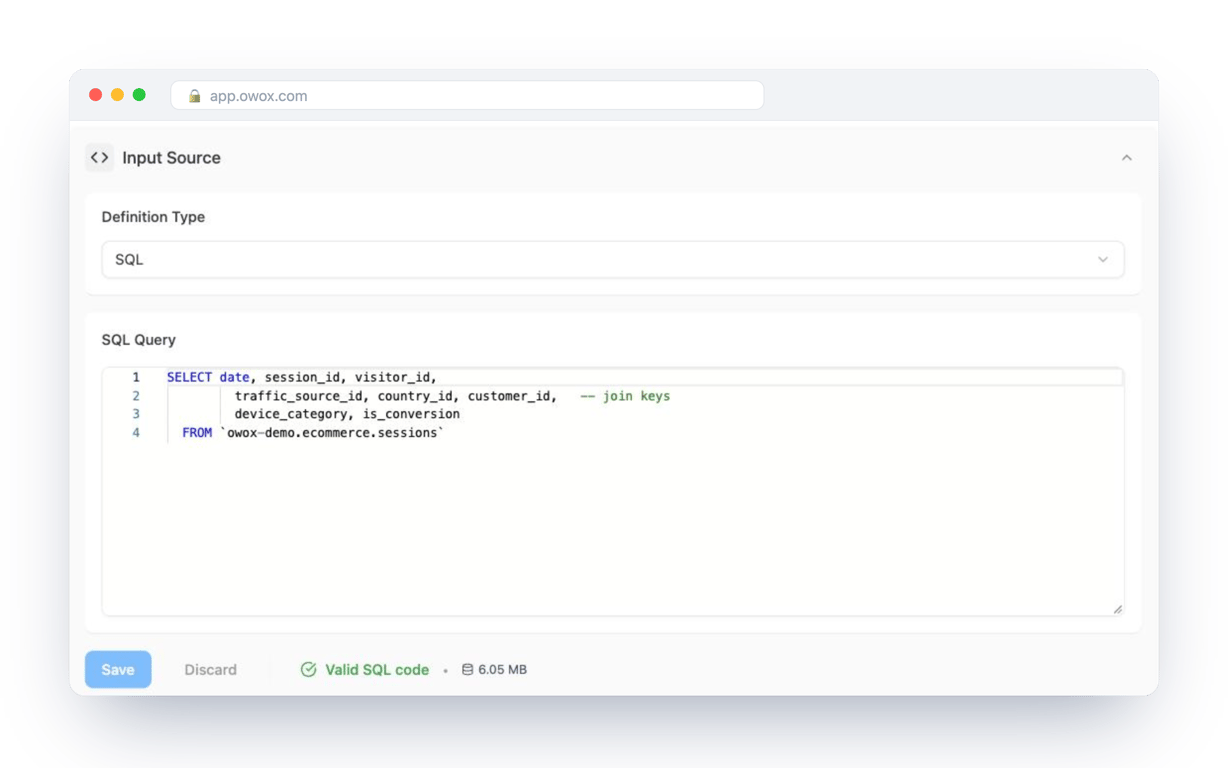
The base query is deliberately thin: one row per session with its join keys. The channel, country, customer segment, order and revenue fields come from the Data Marts it joins to, each of them governed in its own right.
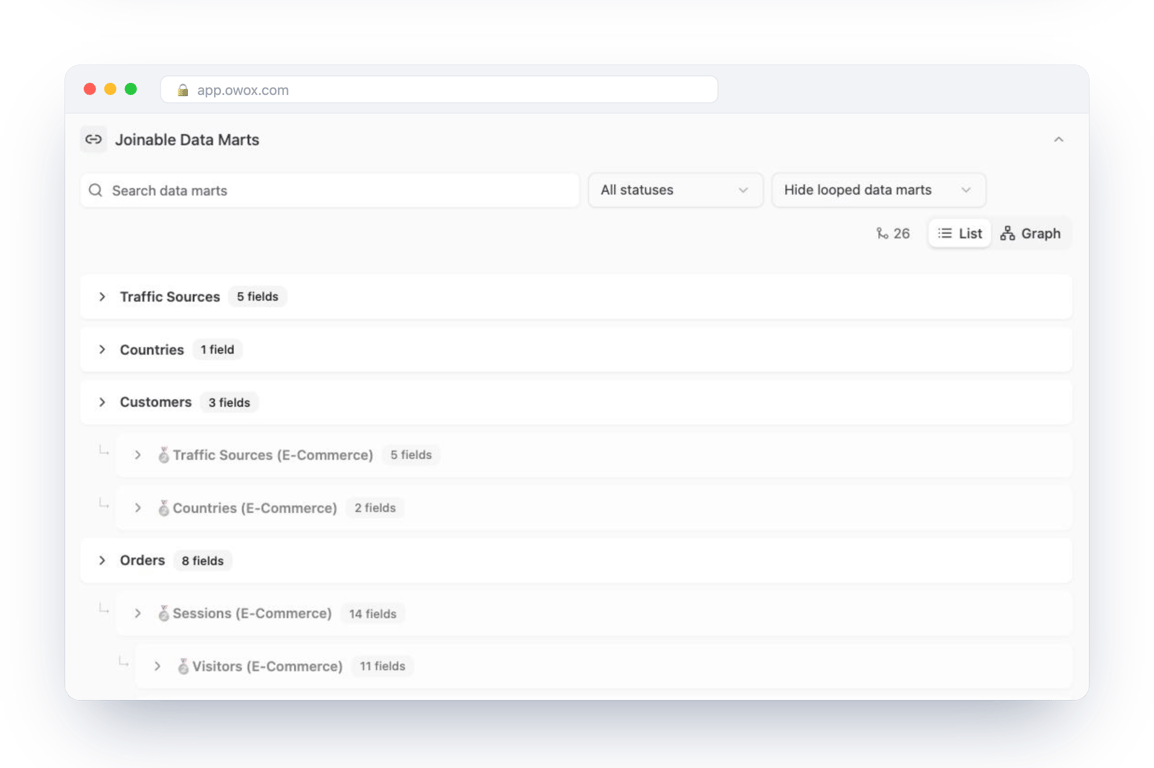
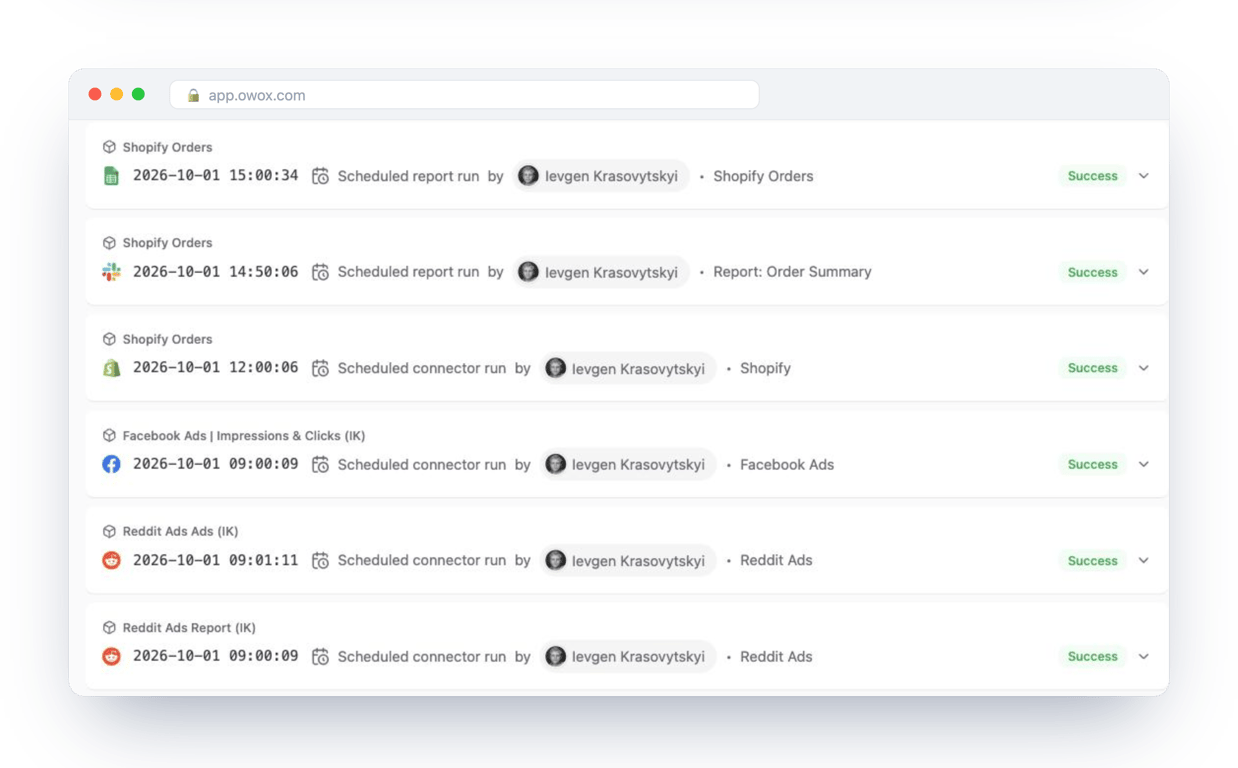
Nothing in those screens was generated. The analyst wrote the SQL and declared the joins; the product publishes and schedules them. That is the distinction that makes the number defensible: when the CMO asks where the revenue-by-channel figure came from, the answer is a query with a name and an owner, not a vendor’s model.
Step 4: let a business user ask for the number
Once the Data Mart exists, the question a marketer actually has can be asked in plain language, against the E-Commerce Data Model that holds it.
Data Model: E-Commerce · Growth Data Mart (sessions → conversion → order → revenue, by channel) Prompt: “Which of our channels bring in the sessions that convert, and how much revenue does each one bring?”
The same question asked of an AI assistant with raw warehouse access and asked of the published Data Mart produces two very different things.
| Ungoverned | Against the Data Mart | |
|---|---|---|
| What the model sees | the raw events and orders tables | the Growth Data Mart |
| What it does | picks a revenue column, guesses which session counts as the conversion, joins orders to sessions on whatever key looks plausible | reads the analyst’s join and the analyst’s definition of a conversion |
| What you get | a plausible number, confidently wrong | the number, and the query behind it |
The prompt is the interface. The guarantee is the Data Mart behind it, and the log that shows which query answered which question. Governed MCP analytics explains that chain of control in full.
How to choose a model
No model fits every business, and using two at once is often more informative than agonising over one. The variables that should drive the choice:
- Sales cycle length. Long cycles with many touches need a multi-touch or algorithmic model; a short cycle may be served by last non-direct click.
- Channel roles. If some channels create awareness (social, display) and others close (search, email), a position-based model reflects that; a linear one hides it.
- The data you actually have. Algorithmic models need volume and non-converting paths. If you have a few hundred conversions a month, a Markov model will be noise.
- What the number is for. A model for proving marketing’s contribution can be generous to top-of-funnel channels. A model for cutting spend has to be strict about incrementality.
- Who has to trust it. A model nobody can explain will be ignored the first time it disagrees with a platform report.
If none of the standard models fits, build a custom one; custom attribution models covers when that is worth doing. And if the question is which tool to run it in, marketing attribution software compares the current options.
How to test a model
A new model is only better if acting on it improves return on ad spend. The test is straightforward and takes one to three months.
Compare ROAS under both models
Build a report with one row per campaign and the same KPI calculated twice: once under your current model, usually last non-direct click, and once under the new one. The difference tells you which campaigns are being over- or under-credited today.
| Campaign | ROAS, last non-direct click | ROAS, new model |
|---|---|---|
| Brand search | 3,003% | 2,610% |
| Prospecting display | 698% | 1,142% |
| Retargeting | 1,671% | 1,380% |
Campaigns whose ROAS rises under the new model were doing work the old model could not see. Campaigns whose ROAS falls were collecting credit for sales other channels created.
Segment the audience rather than A/B test
One user touches many campaigns, so a classic A/B test by campaign does not isolate anything. Split the audience instead into segments that do not overlap but are both exposed to marketing, such as regions. Allocate budget in segment A the old way and in segment B according to the new model’s ROAS, and compare revenue at the end.
Reallocate with a goal in mind
Decide before you move money what you are optimising for: more revenue at the same budget, the same revenue at a lower budget, or more revenue at the current ROAS. Then check that an under-credited channel has room to grow; if more budget only raises its cost per acquisition without adding traffic, the model was right but the market is saturated.
Give it 30 to 90 days
The window depends on your funnel. Top-of-funnel campaigns take longest to show results and are the ones last non-direct click undervalues most, so a test that ends too early will confirm the old model. Use the first part of the window to reallocate and the rest to measure.
Key takeaways
Attribution only pays when it changes a decision. The reports are not the point; the budget is.
- A model is a rule, and every rule answers a different question. Know which question you are asking.
- Single-touch models are easy and misleading. Multi-touch models are fairer and still arbitrary. Algorithmic models are evidence-based and only trustworthy when you can see inside them.
- The rule-based models are one SQL query on your session data. Markov and Shapley are a script that writes a table back. Neither needs a vendor.
- Put sessions, spend and conversions in one warehouse table before comparing models, or each platform will keep claiming the same sale. Tagging traffic consistently is where that starts.
- Publish the model as a Data Mart so the number has an owner, a definition and a log, and so the people who need it can ask for it in plain language.
- Test a new model by reallocating budget in a segment, not by admiring the report.
Free guide: The Ultimate Guide to Marketing Attribution Modeling: Everything You Need to Know →
Turn your data into decisions.
Governed data marts give you the clean foundation ML needs to actually work.
- No AI hallucinations
- Analyst-governed definitions
- Every number traces to SQL
Frequently Asked Questions
What are marketing attribution tools?
Marketing attribution tools are software that reconstructs customer journeys across channels and applies an attribution model to them, so you can see which campaigns contribute to conversions. The platforms' own tools (GA4, Google Ads, Meta) only see their own touches; a warehouse-based model sees all of them, including CRM and offline sales.
What are different attribution models?
Attribution models fall into four families. Single-touch models (first click, last click, last non-direct click) give all the credit to one session. Multi-touch models (linear, time decay, position-based) split it by a fixed rule. Algorithmic models (data-driven, Markov chains, Shapley values) derive the split from converting and non-converting paths. Machine-learning models are algorithmic models that learn the weights from more features than channel order.
What is a marketing attribution model?
A marketing attribution model tells you which channels and campaigns contribute to sales, and at which stage of the funnel. Marketers use it to move budget from channels that only look efficient under one model to the ones that actually drive conversions.
What is the attribution model?
An attribution model is the set of rules that decides how much credit each touchpoint in a customer's journey gets for a conversion. The same journey can give a channel all of the credit, a share of it, or none, depending on the model, so the model is a choice about what question you want answered.