Bitcoin data model: the public BigQuery dataset, visualized
A Bitcoin model is the set of tables – blocks, transactions, inputs, and outputs – and the keys that join them into something you can actually query. Google publishes the whole chain as a public BigQuery dataset, but a raw dataset is not a model: it’s four large tables and a lot of implicit structure you have to hold in your head. Draw the keys and the joins, and tracing value flow, finding unspent outputs, or computing fees becomes one query instead of a research project.
This page gives you a free, ready-made model of the public Bitcoin dataset you can open in your browser, edit like a diagram, and export to OKF – Google’s open, portable format. No sign-up. It’s one of nine in our data model template gallery; this one is built for the public Bitcoin BigQuery dataset.
What the Bitcoin data model is
What the Bitcoin data model is
Bitcoin doesn’t store account balances. It stores a chain of blocks, each holding transactions, and every transaction is a set of inputs that consume earlier outputs and a set of outputs that create new spendable value. That last piece is the UTXO model – Unspent Transaction Output – and it’s what makes Bitcoin different from a bank ledger. There is no “wallet balance” column anywhere; a balance is just the sum of outputs that haven’t been spent yet.
The public BigQuery dataset (bigquery-public-data.crypto_bitcoin) mirrors that structure directly, and this template makes it legible. It’s a shallow dimensional-style model – one small dimension (Blocks) and a chain of facts (Transactions, Inputs, Outputs) – with the grain chosen so the UTXO flow is explicit rather than buried in nested arrays. If the vocabulary is new, start with our guide to data modeling, and for the star-shape idea behind it, see understanding star schema.
The Bitcoin template, mart by mart
The Bitcoin template, mart by mart
The template is four data marts – one dimension and three facts – wired into the UTXO flow. Here’s the whole thing.
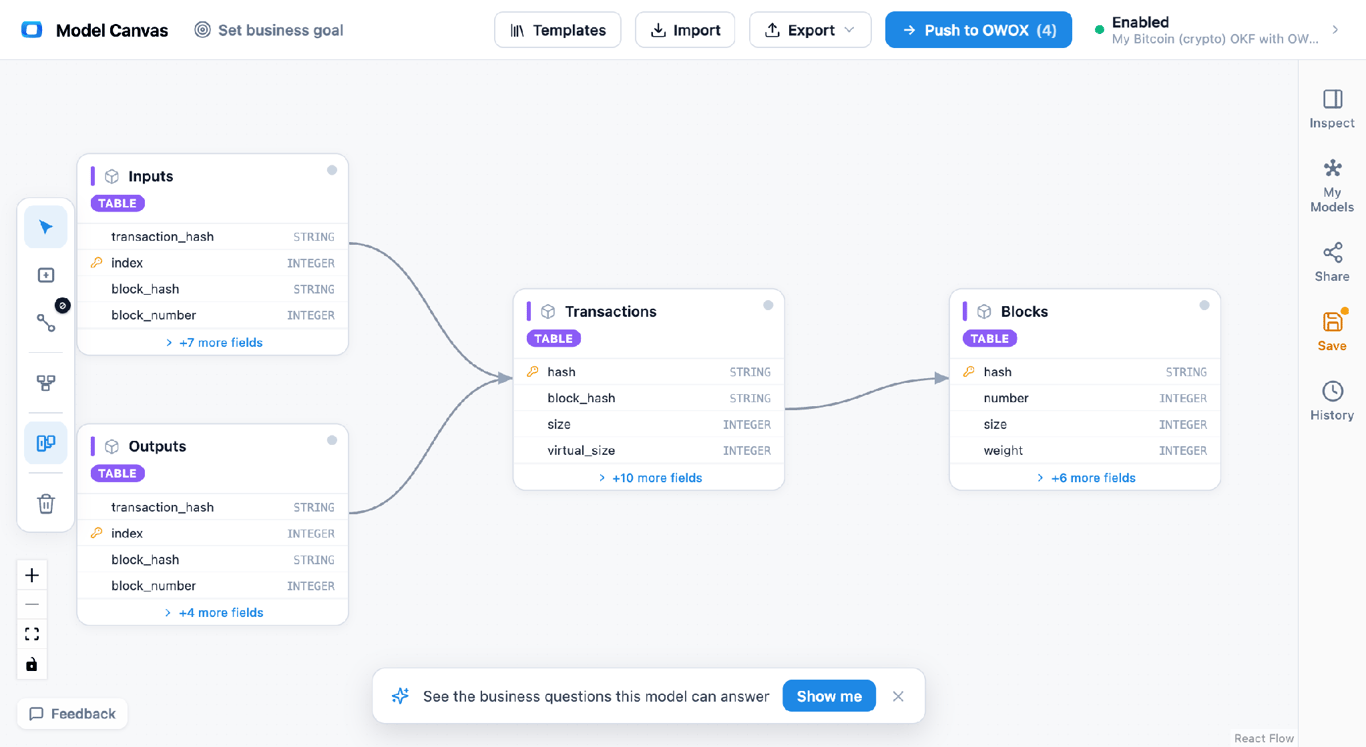
Entity relationship diagram of a Bitcoin data model: a Blocks dimension joined to a Transactions fact, which fans out into Inputs and Outputs fact tables that carry the UTXO value flow. Open the Bitcoin model in the canvas →
• Blocks (dimension) – one row per block. Primary key hash; carries height, timestamp, transaction count, and size. This is the time-and-position anchor: every transaction points back to the block that confirmed it.
• Transactions (fact) – one row per transaction. Primary key hash; foreign key block_hash → Blocks. Carries fee, total input value, total output value, and input/output counts. This is the hub the two UTXO facts hang off.
• Inputs (fact) – one row per transaction input. Foreign key transaction_hash → Transactions, plus a pointer to the earlier output being spent (spent_transaction_hash, spent_output_index). Each input is one consumed UTXO – the “where the money came from” side.
• Outputs (fact) – the centerpiece: one row per transaction output. Foreign key transaction_hash → Transactions. Carries value, address, output index, and a spent flag. Each output is a chunk of spendable value; unspent outputs are the live UTXO set.
The joins make it a star that follows the chain: Transactions → Blocks, Inputs → Transactions, Outputs → Transactions, and the value-tracing link Inputs → Outputs (an input references the specific earlier output it spends). Every table is a reporting-ready data mart in the sense we describe in our approach to data marts.
OWOX Data Marts
See your first report built in real time. 15 minutes.
- Connect your data warehouse
- Pick your metrics
- Get a live Google Sheets report
In the time it takes to write a ticket. Then imagine never writing that ticket again.
Book a DemoWe'll use your actual use case
Inputs and outputs as separate facts (the centerpiece)
Inputs and outputs as separate facts (the centerpiece)
If you take one idea from this template, take this: model inputs and outputs as two separate fact tables under Transactions, not as nested columns on the transaction.
In the raw JSON, inputs and outputs are repeated (arrayed) fields inside each transaction. That’s compact, but it hides the thing that matters. Flatten them into their own tables – one row per input, one row per output – and the UTXO flow becomes a set of joins you can actually reason about. An output has a value, an address, and a spent flag; an input names the exact prior output it consumes. Because those two facts share the transaction key and reference each other, you can trace value across the chain (follow an input back to the output that funded it), find the unspent set (outputs where spent = false), and compute fees (sum of a transaction’s input values minus its output values) without unnesting arrays every time.
That’s the difference between a raw dataset and a model: the grain is explicit, the keys are drawn, and the questions become paths across four tables. This is classic transaction-grain fact-table design; for the grain choices behind it, see the three types of fact tables and dimensional data modeling.
What this model answers
Because inputs and outputs are separate facts that share the transaction key, the hard on-chain questions become joins, not scripts:
• What is this address’s balance? – Outputs filtered to the address where spent = false, summed by value.
• What did a transaction cost in fees? – Inputs value minus Outputs value for that transaction_hash.
• Where did this money come from? – An Input joined back through spent_transaction_hash to the earlier Output that funded it.
• How busy was a given day? – Transactions joined to Blocks on block_hash, grouped by the block timestamp.
• What’s the live UTXO set right now? – All Outputs where spent = false, joined to Transactions and Blocks for context.
None of these need a new table. They’re different paths across the same four data marts.
Bitcoin model vs. the raw public dataset
Bitcoin model vs. the raw public dataset
The public dataset is already free in BigQuery – so why model it at all? Because a raw dataset is storage, not a map. The tables exist, but the relationships live only in documentation and in the analyst’s head. Modeling makes the UTXO structure visible: which key joins to which, where the grain sits, and how value flows from output to input. That’s what turns crypto_bitcoin from four tables you query cautiously into a chain you can navigate confidently.
| Aspect | Raw public dataset | This template |
|---|---|---|
| What you get | Four tables, relationships in the docs | Four marts with keys and joins drawn |
| UTXO flow | Inputs/outputs nested in arrays | Inputs and Outputs as separate facts |
| Value tracing | Unnest arrays on every query | A join on the transaction key |
| Onboarding | Read the schema, hold it in your head | Read the diagram in a minute |
| Export | SQL schema | OKF + diagram image |
How to open and customize the template
How to open and customize the template
Opening it and shaping it to your questions takes about two minutes, then as long as you want to refine.
(1) Open it. Use the link under the diagram above – loads in your browser, no sign-up.
(2) Reshape it. Add fields (script type, coinbase flag, address type), split Outputs by address, or add a derived Addresses dimension; redraw joins on the canvas.
(3) Set grain and keys. Confirm Blocks is one row per block, Transactions one per tx, and Inputs/Outputs one row each per input and output – then check the keys tying each fact back to Transactions.
(4) Export it. Use Export → OKF for a portable model, or grab a diagram image. Keep the OKF in git or push it into OWOX Data Marts to make it live against your warehouse.
Comparing tools while you’re here? Our roundup of free database diagram design tools puts the canvas in context.
Export to OKF: a portable Bitcoin model
Export to OKF: a portable Bitcoin model
The reason this beats a static ER picture is what happens after the diagram. A drawing can’t be diffed or fed to a warehouse, and a schema pasted into a doc drifts out of date the moment someone edits it.
This template exports to OKF (Open Knowledge Format), Google’s open, markdown-based standard. Because it’s plain text, you can keep the model in git, review it in a pull request, and hand it off without lock-in – which matters for a public dataset that many people query the same way. New to it? See our explainer on what OKF is, then open the Bitcoin model and export your own.
Turn your data into decisions.
Governed data marts give you the clean foundation ML needs to actually work.
- No AI hallucinations
- Analyst-governed definitions
- Every number traces to SQL
Frequently Asked Questions
Is the template free, and what can I export?
Yes, free with no sign-up. Export the model as OKF or a diagram image. An OWOX account is only needed to push the model into OWOX Data Marts.
Why model a public dataset that's already free?
Because the raw dataset is storage, not a map – the relationships live only in documentation. Modeling draws the keys, fixes the grain, and makes the UTXO flow navigable, so tracing value or finding unspent outputs is a join instead of a research task.
How do you compute transaction fees?
Sum the input values for a transaction and subtract the sum of its output values; the difference is the fee. With Inputs and Outputs as separate facts sharing the transaction key, that's a single join and two sums.
How do you calculate an address balance from this model?
Filter Outputs to the address, keep only rows where `spent = false`, and sum their `value`. Because outputs carry both the address and the spent flag, a balance is one grouped query, not a chain replay.
Where is the public Bitcoin BigQuery dataset?
Google publishes it as `bigquery-public-data.crypto_bitcoin`, with blocks, transactions, inputs, and outputs tables. It's free to query; this template gives it the keys and joins a raw dataset doesn't ship with.
What is the UTXO model in Bitcoin?
UTXO stands for Unspent Transaction Output. Bitcoin has no balance column – value lives as discrete outputs, and an output is spendable until an input consumes it. A wallet's balance is just the sum of its unspent outputs.
What tables are in the Bitcoin data model?
Four: a Blocks dimension (one row per block), a Transactions fact (one per transaction), an Inputs fact (one per input), and an Outputs fact (one per output). Transactions join to Blocks, and Inputs and Outputs both join to Transactions.