
How to Build a Unified Ad Report in Google BigQuery with Free Connectors (Without SaaS)
Learn how to set up Facebook, LinkedIn, and TikTok Ads to BigQuery pipelines for free. Simplify campaign reporting with open-source tools.

.png)
Struggling to bring your ad performance into focus across platforms? Switching between dashboards for Facebook, Google, LinkedIn, and TikTok Ads often creates confusion, extra work, and scattered insights. Instead of building separate reports in every tool, you can centralize your campaign data in one place, Google BigQuery, without relying on costly ETL software or SaaS platforms.
.png)
This guide walks you through how to create a unified ad report in BigQuery using free, open-source connectors from OWOX. You’ll learn how to automate campaign data collection, standardize metrics across platforms, and write simple SQL queries to monitor performance. No engineering help needed, just clear, hands-on steps to help your team save time and make better decisions.
Importance of Unified Ad Reporting for Marketing Teams
Instead of switching between dashboards for every platform, unified ad reporting brings your campaign data – clicks, spend, conversions – into a single, consistent view. This is critical for marketing and RevOps teams trying to understand which campaigns are performing, where budget is being wasted, and how each channel supports broader goals.
In most ad data pipelines, this type of reporting happens at the final stage - after connectors pull raw data, clean it, and load it into a warehouse like BigQuery. Only then are the raw metrics transformed into structured, query-ready tables for dashboards and cross-channel performance reports.
Here’s why unified ad reporting is essential for marketing teams:
- Saves time by eliminating the need to check multiple dashboards across platforms.
- Enables accurate comparisons between campaigns and channels in one standardized format.
- Improves clarity by aligning metrics (like spend and conversions) across ad networks.
- Supports strategic decision-making with clean, queryable data ready for visualization.
- Boosts reporting consistency by centralizing logic and eliminating manual data stitching.
How Data Connectors Can Help Teams Create Unified Reports
Data connectors streamline how campaign data is collected and unified, making reporting easier and faster for everyone:
- Fetch structured ad data automatically from platforms like Facebook Ads, Google Ads, TikTok, and more using their official APIs.
- Sync to one destination like BigQuery, so metrics like spend, clicks, and conversions land in a shared format.
- Remove the need for manual exports or CSV imports by running automated connector jobs on a fixed schedule.
- Keep data fresh and consistent with scheduled connector triggers that update your tables daily, weekly, or even hourly.
- Enable consistent, cross-platform reporting by ensuring every data source follows the same schema and update rules.
This setup ensures your team always has reliable, query-ready campaign data, without copy-pasting between spreadsheets.
How Marketing API Connectors Integrate with BigQuery
Marketing API connectors let you send campaign data from ad platforms to BigQuery automatically, no coding or manual file handling needed. They fit into your reporting workflow as lightweight, reliable tools that build clean pipelines for analysis. Here's how they fit into the workflow and help build a clean, automated reporting setup:
- API to BigQuery Workflow: These connectors pull data from ad APIs (like Facebook, Google, or TikTok) and push it straight into BigQuery tables, without requiring CSV exports or third-party ETL platforms.
- Authentication Setup: Secure authentication is handled using OAuth tokens or service accounts, ensuring safe access to both your ad accounts and BigQuery environment.
- Destination Table Setup: Once connected, the tool creates or updates tables in BigQuery with key fields such as spend, impressions, clicks, and conversions, ready for querying.
- Sync Frequency: You choose how often to sync, hourly, daily, or at custom intervals, so your data stays fresh, and your dashboards stay up to date.
- Schema Handling: If a platform adds new fields or renames metrics, OWOX connectors adjust automatically. You don’t have to update SQL or rebuild pipelines.
- Examples of Connectors: OWOX offers free, open-source connectors that bring data from Facebook, LinkedIn, TikTok, and X (formerly Twitter) directly into BigQuery, giving teams full flexibility without any licensing costs.
Benefits of Using Free Connectors for BigQuery

Free connectors offer a cost-effective way to bring ad data into BigQuery without relying on expensive or restrictive tools. Here are a few key reasons why they’re a strong fit for marketing teams that need more control, flexibility, and a scalable way to manage reporting pipelines, without giving up visibility or ownership.
Zero License Fees or API Usage-based Pricing
Free connectors let you send ad data to BigQuery without worrying about license fees, usage-based billing, or per-row costs. Unlike commercial ETL tools that charge by source, user, or volume, these open-source connectors are completely free, with no hidden costs, now or later. As your campaign data scales, you won’t be hit with growing subscription fees, making this setup ideal for fast-moving teams with tight budgets.
Full Control Over Schema and Data Freshness
Free connectors give you full flexibility over how your data is structured and updated in BigQuery. You can define your own table schemas, rename fields, and standardize metrics across platforms to suit your reporting logic. Sync schedules are also completely customizable; whether you need updates every hour or just once a day, you stay in control. This ensures your reports remain accurate, up to date, and aligned with your team’s specific needs.
Ideal for Startups and In-house Marketing Ops
Free connectors are ideal for startups, marketing analysts and data analysts who need fast, flexible reporting, without third-party SaaS tools. With support for Google-native workflows like Sheets and BigQuery, they help you build reliable reporting pipelines using tools your team already knows. And because they’re open-source, you get the flexibility to customize and scale without hiring engineers or switching platforms later.
No Vendor Lock-In
Free and open-source connectors give you complete ownership of your reporting pipelines. You're not tied to a vendor's pricing model, platform limitations, or support delays. The logic behind your data flow lives in tools you control, like Google Sheets or Apps Script, so if your needs change, you can adjust, self-manage, or switch tools without worrying about high costs or starting from scratch. You stay in control, every step of the way.
How to Use OWOX’s Free Connectors to Send Ad Data to BigQuery
OWOX provides free connectors for major ad platforms, making it easy to send campaign data directly into BigQuery. Let’s take a closer look at how each connector works, starting with Facebook, LinkedIn, TikTok, and X Ads (formerly Twitter Ads).
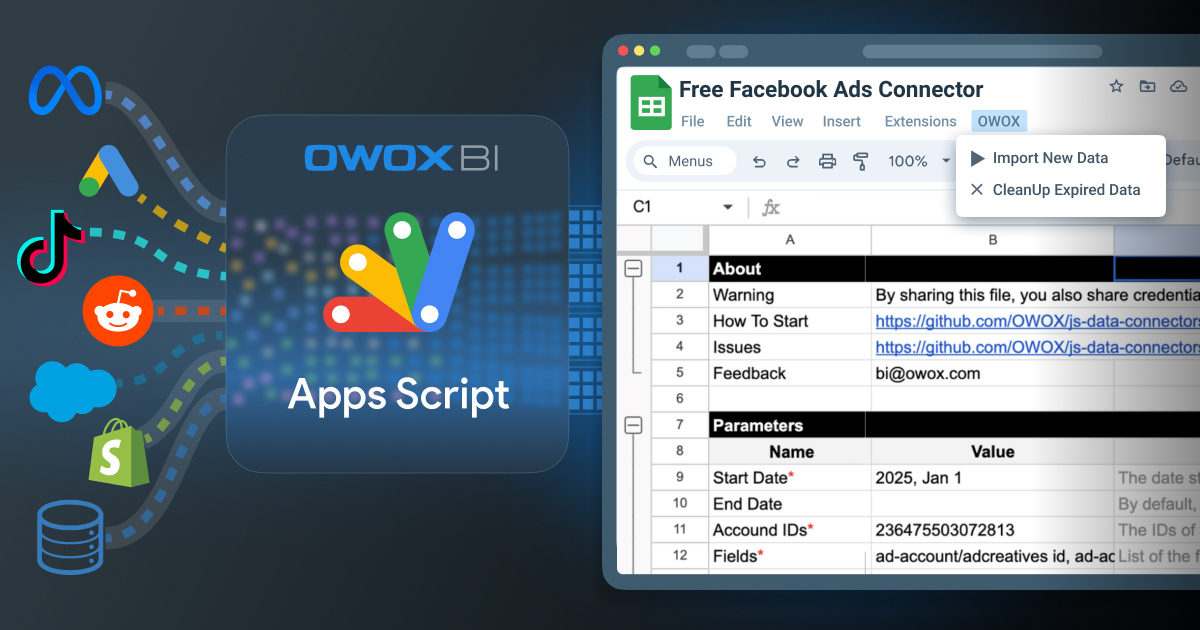
Connect Facebook Ads to BigQuery Using OWOX
OWOX offers a free connector that helps you send Facebook Ads data directly to BigQuery. To get started, you simply copy their Google Sheets template, enter your Facebook Ad Account ID, and configure your preferred metrics and breakdowns. Once that’s done, the connector pulls in your campaign data - things like clicks, spend, impressions, and conversions - directly from Facebook’s API.

Once set up, the connector pushes this data into BigQuery on a schedule you define. You can customize your schema, manage sync frequency, and even apply filters. It’s a no-code, cost-free solution perfect for building custom ad reports without needing third-party ETL tools.

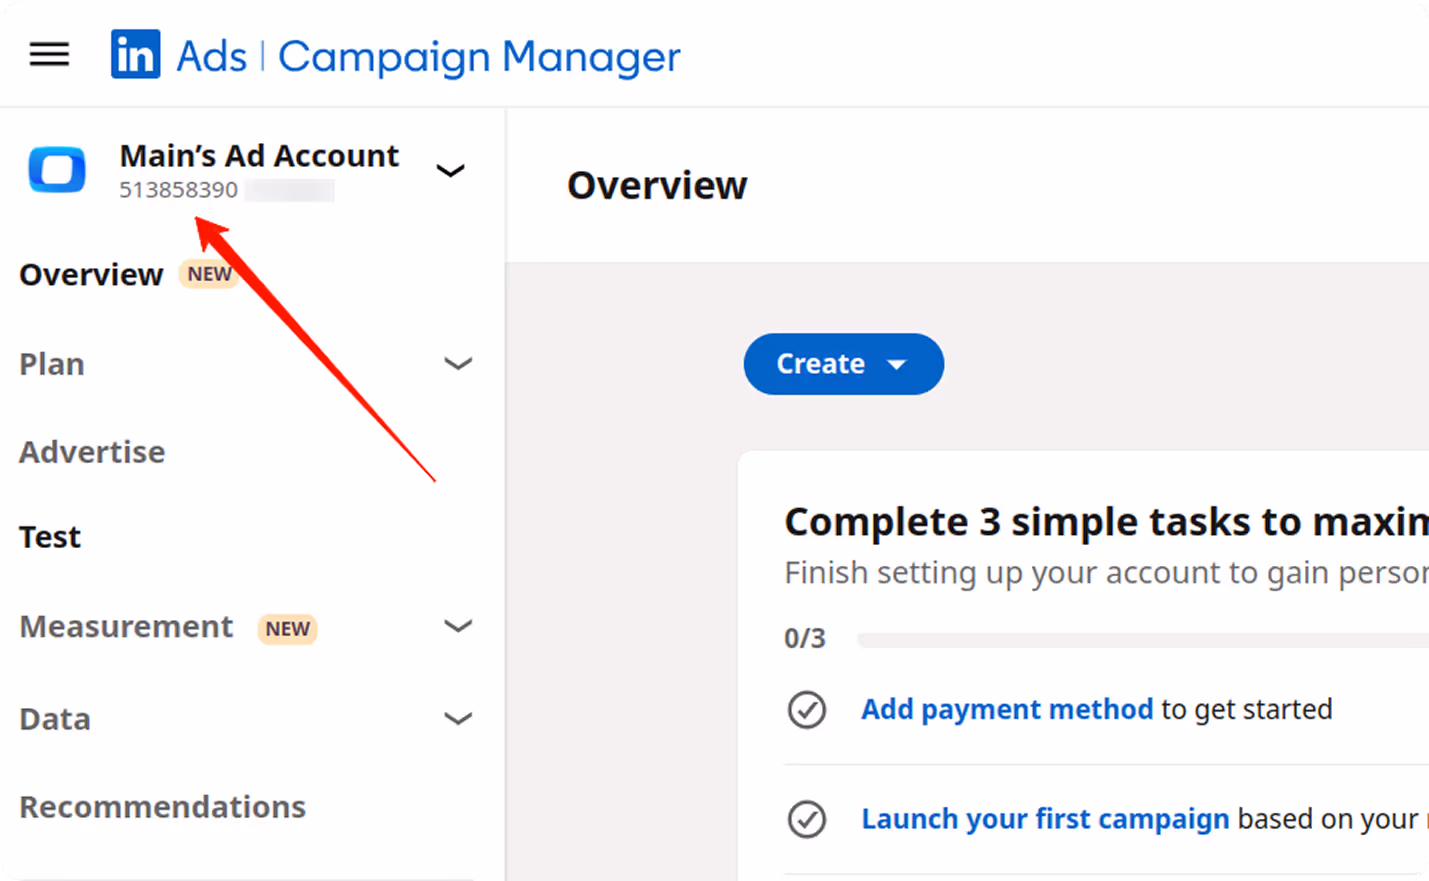
Connect LinkedIn Ads to BigQuery with Free Connector
OWOX’s free LinkedIn Ads connector lets you move campaign data from your LinkedIn account to BigQuery without any technical setup. You start by copying a pre-built template, adding your LinkedIn Ad URNs (account or campaign), and selecting the performance metrics you want to track, such as clicks, impressions, or leads.
The data is pulled through LinkedIn’s Marketing API and loaded directly into your BigQuery tables. You have full control over the structure, fields, and refresh frequency. It’s a simple, flexible way for B2B marketers to integrate LinkedIn Ads into unified reporting dashboards without paying for commercial tools.

Send X Ads (Twitter Ads) Data to BigQuery Without Paid Tools
OWOX’s X Ads connector helps you send performance data to BigQuery without using paid tools. You begin by copying the template, entering your Twitter Ads Account ID and API access tokens, and selecting fields such as impressions, engagement, and spend. The connector uses Twitter’s Ads API to fetch data.
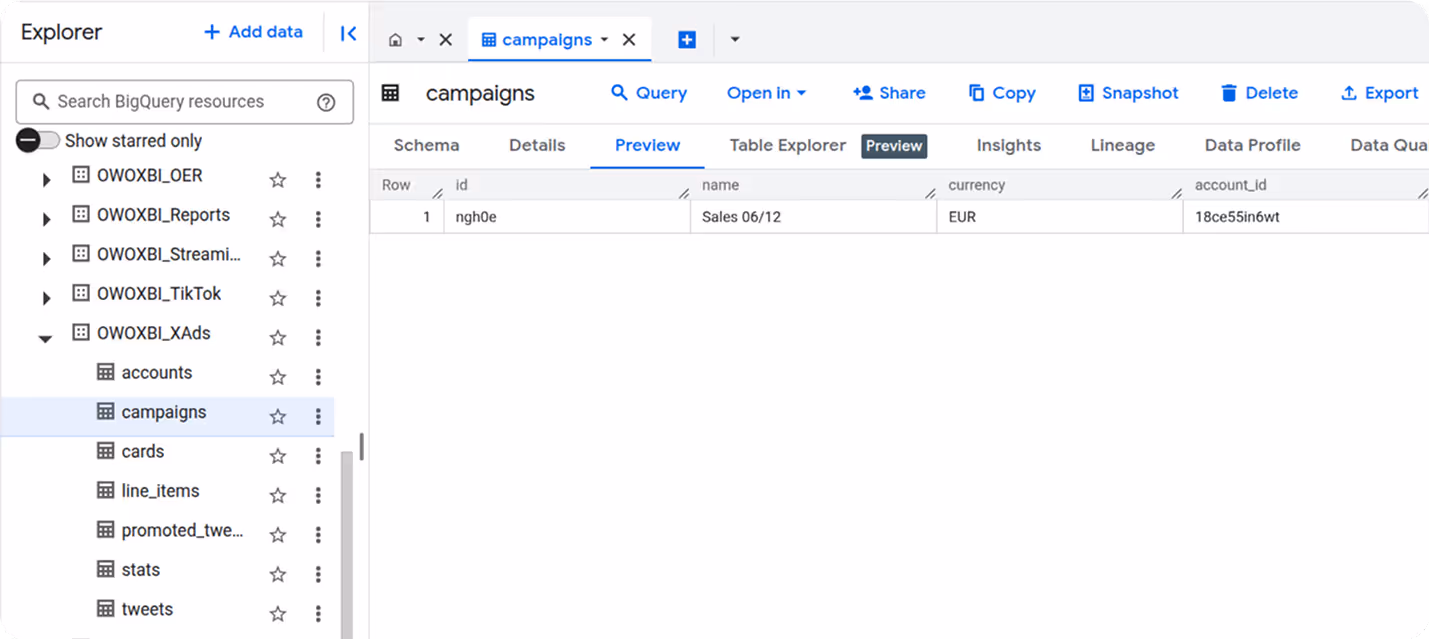
It then uploads the data into BigQuery, where you can build custom reports and dashboards. You get full transparency and control over schema, sync timing, and filters. It’s ideal for teams who want to analyze Twitter Ads performance alongside other platforms in one central place, without any vendor lock-in.

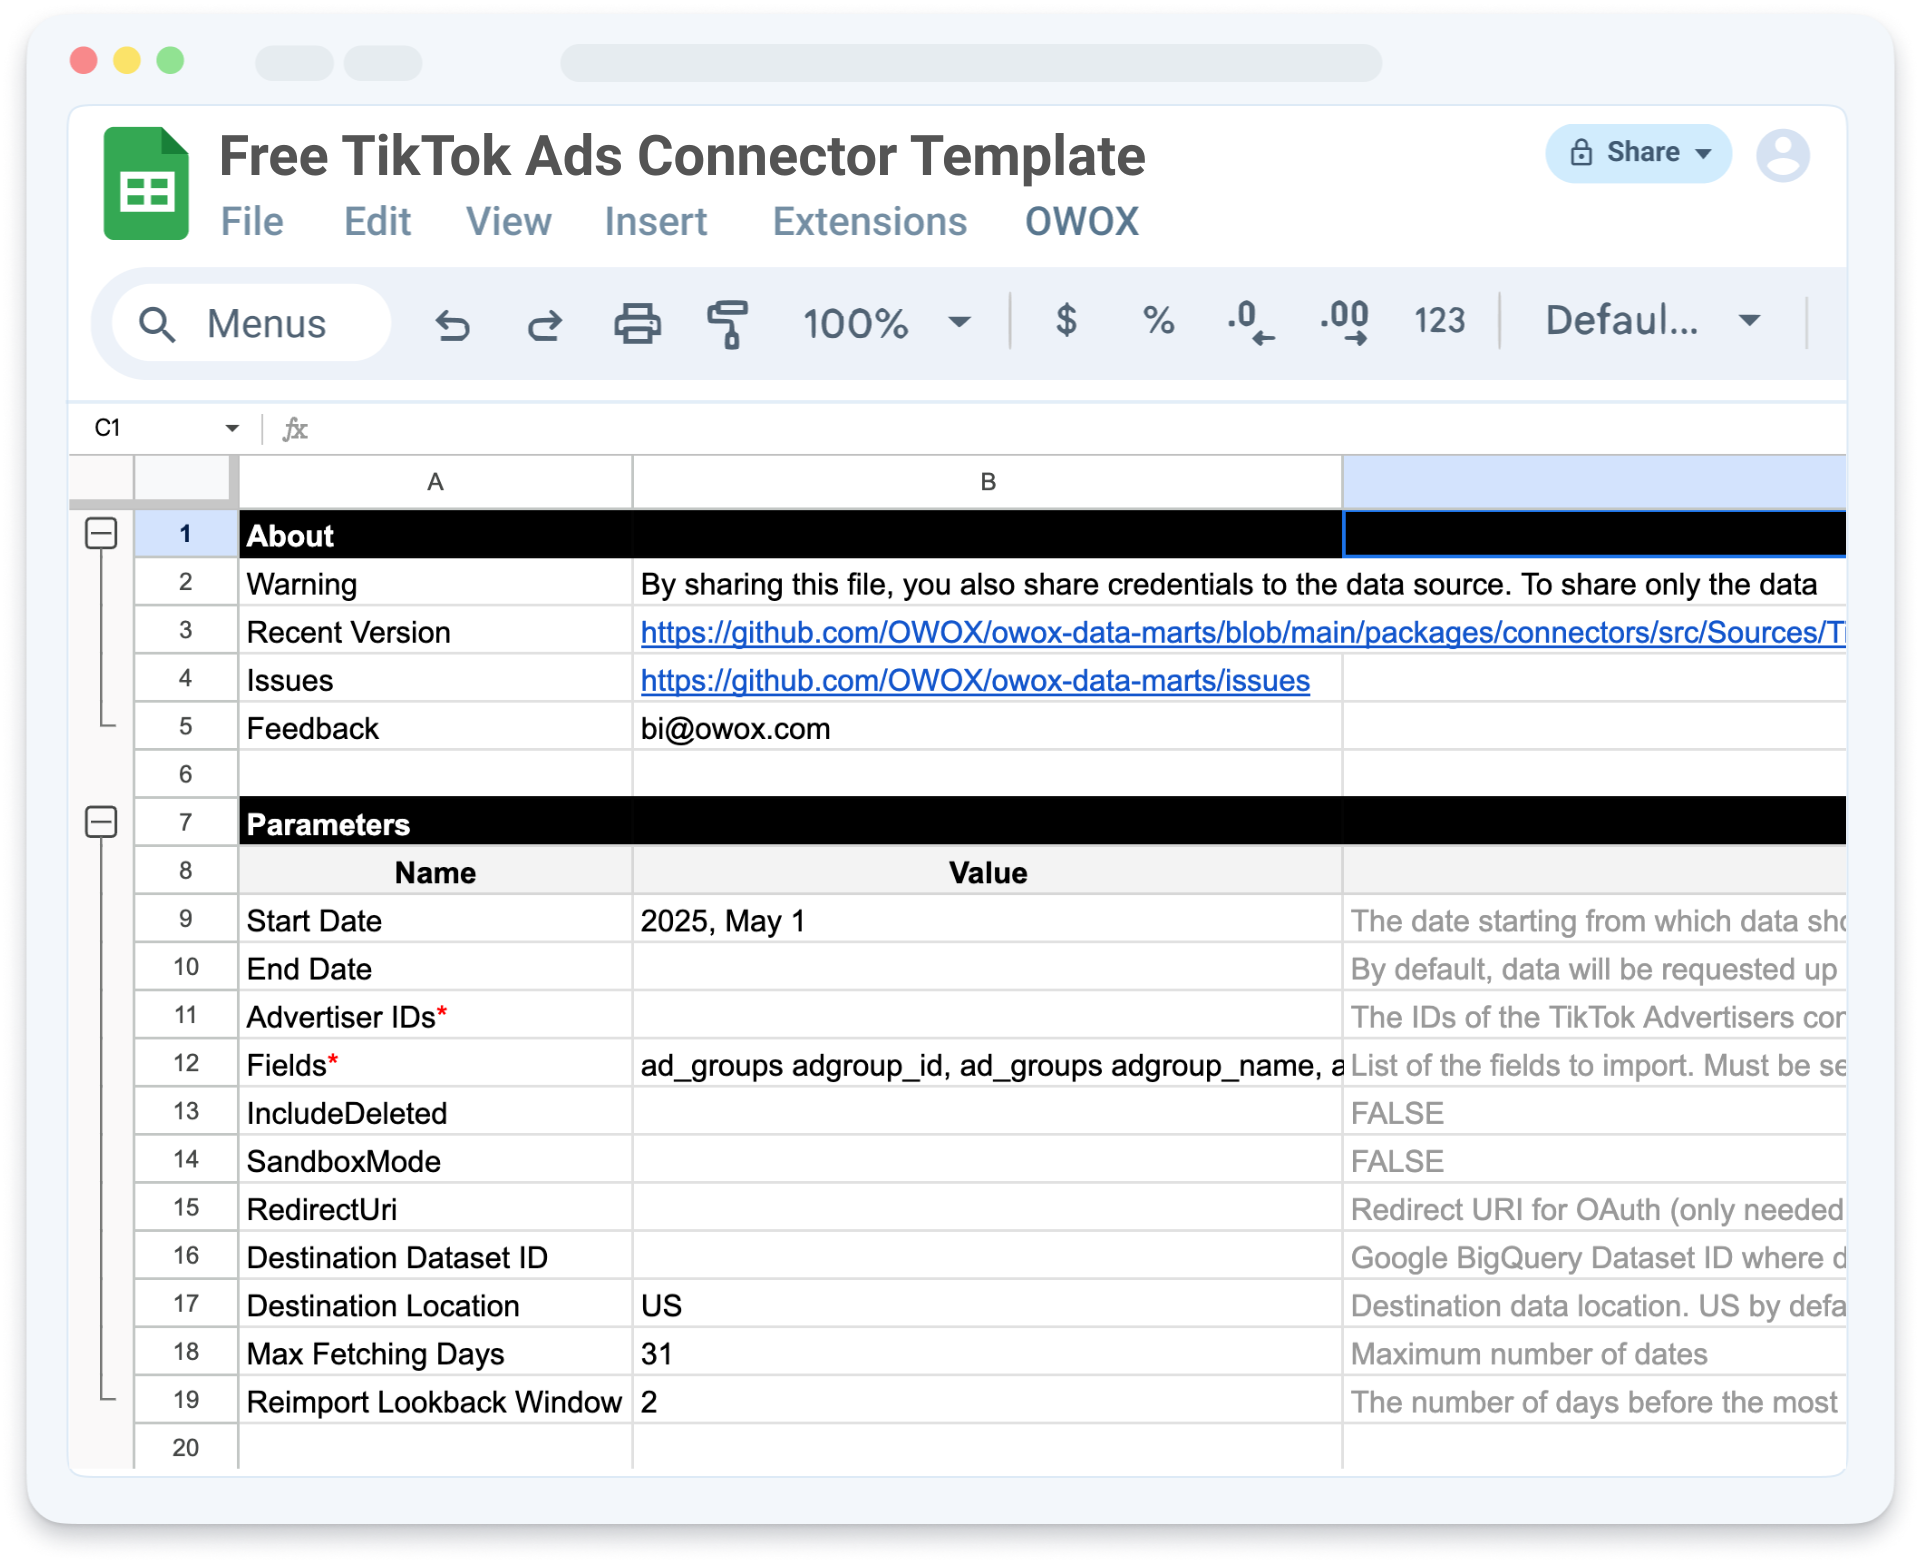
Connect TikTok Ads to BigQuery with OWOX Connector
With the free TikTok Ads connector by OWOX, you can easily bring campaign data into BigQuery. To get started, just copy the Google Sheets template, enter your TikTok Advertiser ID and API token, and choose the metrics you’d like to track, such as video views, CTR, or conversions. It’s a quick setup that doesn’t require any coding.
From there, the connector fetches your TikTok ad data directly through the API and sends it to BigQuery. You can schedule daily updates, customize the schema to fit your needs, and keep a record of past performance. It’s a solid choice for teams running TikTok campaigns who want deeper insights, without paying for third-party ETL tools.
SQL Schema Example for Unified Ad Campaign Reporting
To build reliable reports in BigQuery, your ad data needs a consistent structure. Below is a sample schema that works across platforms like Facebook, Google, and TikTok, using shared fields such as campaign ID, platform, spend, clicks, and conversions.
Field Standardization Across Platforms
Ad platforms often use different names and formats to represent the same metrics. For example, Google Ads uses cost_micros (in millionths of a currency unit), while Facebook Ads reports spend in standard dollars. These inconsistencies can make unified reporting difficult if left unaddressed.
To solve this, fields should be standardized as part of your data transformation step. For instance, converting cost_micros into spend_usd by dividing it by 1,000,000 ensures all spend data aligns across platforms in your BigQuery tables, making it easier to write consistent queries and build cross-channel reports.
Sample SQL Query for Daily Spend and Performance
Here’s a sample SQL query that aggregates daily ad performance across platforms like Facebook, Google, or TikTok. It pulls data from a unified table and calculates total spend, clicks, and conversions for each platform on each day.
1SELECT
2  DATE(report_date) AS day,
3  platform,
4  SUM(spend_usd) AS total_spend,
5  SUM(clicks) AS total_clicks,
6  SUM(conversions) AS total_conversions
7FROM
8  `project.dataset.unified_ad_data`
9GROUP BY
10  day, platform
11ORDER BY
12  day;
It summarizes daily ad spend, clicks, and conversions for each platform by grouping the data by date and platform. This enables you to quickly identify performance trends and budget impact across multiple channels in a single report.
Comparison of Free Connectors vs. SaaS Tools

Free tools like OWOX offer a different approach compared to paid options such as Supermetrics, Airbyte. Below is a quick comparison to help you see which one might be the better fit for your team’s needs.
Cost Comparison
Free connectors let you move ad data to BigQuery without license fees or usage-based costs. Whether you're syncing one platform or several, there’s no charge to connect, making it ideal for teams with tight budgets or those scaling up without adding new expenses. Tools like OWOX’s open-source connectors fall into this category.
In contrast, SaaS platforms often charge by row volume, number of sources, or sync frequency. While they offer convenience, the costs can grow quickly for teams running campaigns across multiple platforms.
Data Control and Customization
Free connectors let you define schemas, rename fields, and adjust metrics, giving you full transparency over how ad data is stored in BigQuery. You can tailor sync schedules and build analysis-ready tables to match your reporting needs. This flexibility is ideal for teams that need analysis-ready tables and want to design reports on their terms.
SaaS tools usually rely on fixed templates, with limited options to reshape data during import. They’re useful for quick setups but may fall short when deeper customization or platform-specific transformations are needed.
Setup Complexity and Maintenance
With free connectors, you handle the setup yourself, including API authentication, schedule configuration, and sync monitoring. While this may take more time upfront, it gives you full control and transparency into how your data moves. For teams with light engineering skills or technical support, this hands-on setup is often worth the flexibility and ownership it provides.
SaaS tools, on the other hand, are built for simplicity. Setup is usually quick and code-free, which is great for non-technical teams. But when issues arise, you're often reliant on vendor support and may be limited in how much you can customize or debug the pipeline.
Scalability
With free connectors, your pipelines scale easily within the cloud. Paired with tools like BigQuery scheduled queries or Google Cloud Functions, they can process large datasets and support growing reporting needs, all without extra fees. You stay in control of how and when data flows, making it easier to fine-tune performance as you scale.
SaaS tools can scale too, but often with rising subscription costs. While they simplify setup, they may not offer the same level of control over performance, storage, or optimization inside your warehouse.
Comparison Table:
Visualize Unified Ad Data in Looker Studio and Google Sheets
Once your ad data is in BigQuery, the next step is making it easy to analyze and share. This section shows how to connect BigQuery to Looker Studio and Google Sheets to build clear, customizable dashboards and reports.
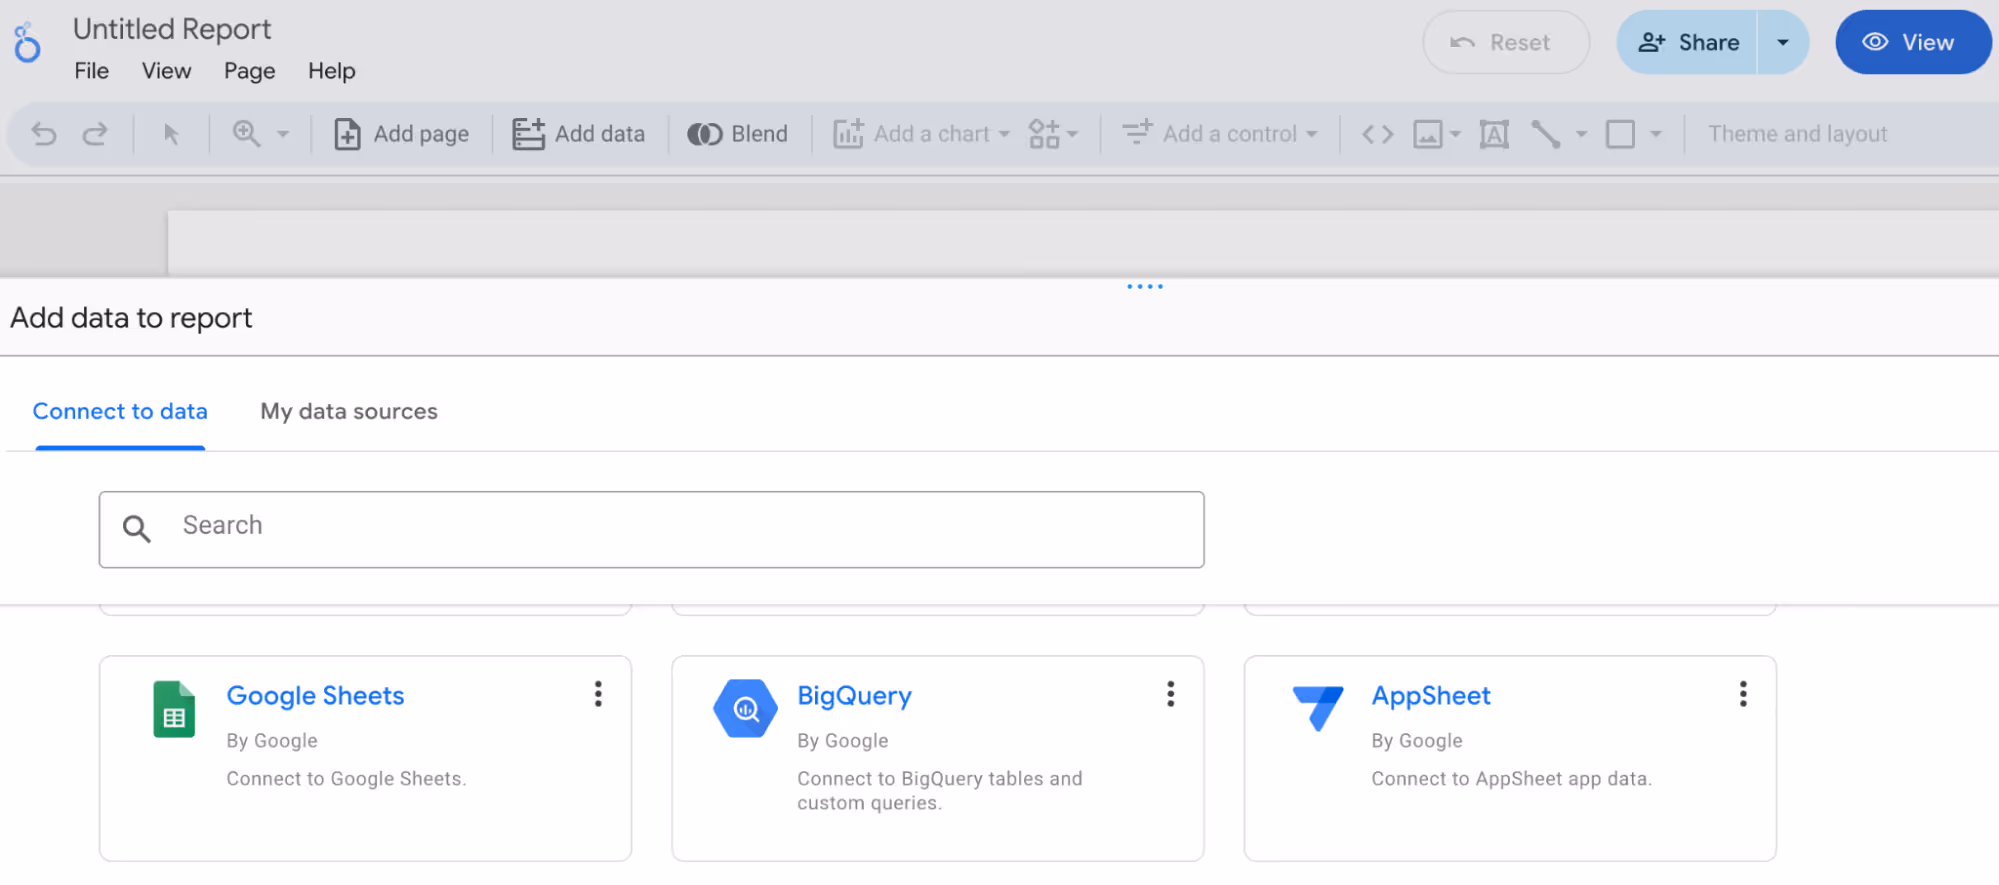
Connect BigQuery to Looker Studio for Campaign Dashboards
Use the native BigQuery connector in Looker Studio to pull data directly from your unified tables. Select Create → Data source → BigQuery, authorize access, and choose your project, dataset, and table. Looker Studio will then display your fields as dimensions (like campaign, date, platform) and metrics (like spend, clicks, conversions).
After connecting, you can build campaign dashboards with charts for spend trends, CTR, and conversions. Add filters for platform, region, or campaign name to narrow the view. Reports stay up to date automatically, so there’s no need for manual refreshes.
Analyze BigQuery Data in Google Sheets with OWOX BigQuery Data Marts
OWOX BigQuery Data Marts lets you analyze BigQuery data directly in Google Sheets - no SQL needed. After linking your BigQuery table, you can select the data you want and bring it into Sheets in just a few clicks.
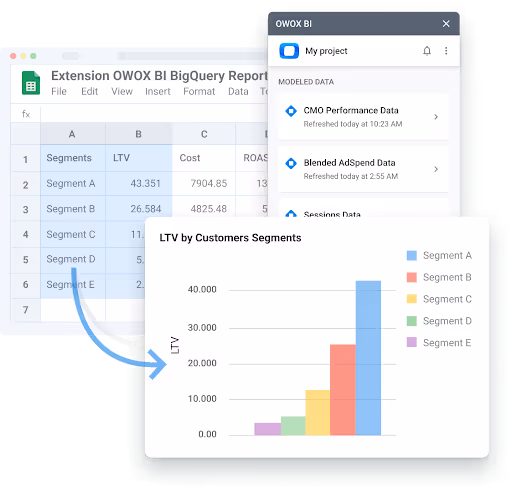
Once connected, you can build pivot tables, charts, and custom reports right on top of your live ad data. OWOX Reports Extension for Google Sheets also supports automatic data refreshes – daily, weekly, or hourly – so your reports always stay current. It’s a great way for marketers to explore and share insights using tools they already know.
In the OWOX framework, Sheets and Looker Studio act as Destinations, receiving fresh data from published Data Marts, either manually or through scheduled Report Triggers
What’s the Best Way to Expand Your Ad Data in BigQuery?
As your reporting needs evolve, expanding your ad data in BigQuery is key to building a scalable, centralized analytics setup. The steps below outline how to begin with one connector and grow into a unified structure ready for automation and deeper analysis.
Start with One Connector and a Unified Schema
Begin with a single ad platform, like Facebook or Google Ads, and connect it to BigQuery. Create a clear and consistent schema with key fields such as campaign name, spend, and conversions. This makes your data easy to query, compare, and maintain from day one.
With the right access and structure in place, your team can explore and use the data across reports and dashboards, without worrying about silos, inconsistent formats, or access issues. It becomes the foundation for a more complete and connected view of your marketing performance.
Add More Channels and Normalize Metrics Across Platforms
Once your base schema is in place, you can connect additional platforms like LinkedIn, TikTok, or Bing. Since each platform reports metrics differently, the next step is to map them into a common structure. For example, unify terms like cost_micros, spend, or amount_spent into a single spend_usd field.
BigQuery makes it easy to organize and query this data at scale. With standardized fields like spend, clicks, and conversions, you can compare campaign performance across channels in one consistent, analysis-ready table.
Build a Central Marketing Dataset in BigQuery
Use SQL views or scheduled queries to bring together campaign, audience, and conversion data into a unified dataset. By joining sources like Facebook Ads, Google Ads, and others into a shared reporting table, you create a consistent foundation for analysis.
This central dataset becomes your team’s single source of truth, ideal for tracking ROI, segmenting audiences, and generating reliable reports across all channels without duplicating effort or logic.
Automate, Partition, and Monitor Your Pipelines
As your marketing data scales, use BigQuery features like scheduled queries to automate updates, table partitioning to improve performance, and monitoring tools to detect issues early. These practices help maintain a fast, reliable reporting pipeline.
By automating routine tasks and optimizing storage, your team can focus less on managing pipelines and more on analyzing trends, optimizing spend, and driving better campaign outcomes.
Explore the Free OWOX Connector Library for Building Unified Reports
You don’t need to rely on costly ETL tools or rigid SaaS platforms to bring all your ad data together. With the OWOX Connector Library, you can:
- Use free, no-code connectors for Facebook, LinkedIn, TikTok, and X (Twitter)
- Send data directly to BigQuery without subscriptions or vendor lock-in
- Customize schemas, schedules, and metrics to fit your team’s reporting needs
- Start with one connector and scale up as your data grows
Explore OWOX’s open-source connectors on GitHub. Build connector-defined Data Marts with automation triggers to keep ad data fresh in BigQuery, all without subscriptions or vendor lock-in.
Frequently asked questions
.png)


Finally, a tool that doesn't ask business users to learn a new dashboarding UI. Our marketing team already knows Sheets. OWOX just delivers the right data.
Joinable data marts concept was the thing that sold us. We can now use the semantic layer without building one.
Self-hosted the OSS version on Digital Ocean. Zero vendor lock-in. Contributed a Shopify connector back in week two.