E-commerce data model: a free template to open and edit
An e-commerce data model is the set of tables – customers, products, orders, and the events around them – plus the keys that join them into something you can actually report from. Get it right and questions like “what’s our true margin by category?” take one query. Get it wrong and every report becomes an argument about which number is correct.
This page gives you a free, ready-made e-commerce data model you can open in your browser, edit like a diagram, and export to OKF – Google’s open, portable format. No sign-up, no install. It’s one of nine in our data model template gallery; this one is built for online retail.
What an e-commerce data model is, and the two kinds
What an e-commerce data model is, and the two kinds
There are really two models hiding behind the phrase “e-commerce data model,” and most search results only show you one.
The first is the transactional (OLTP) schema that runs the store: highly normalized tables for products, variants, carts, checkouts, and payments, tuned for fast writes. The second is the analytics data model: a denormalized, dimensional shape – facts surrounded by dimensions – tuned for fast questions about revenue, retention, and behavior. They aren’t competitors; the analytics model is downstream of the transactional one.
This template is the analytics model – the one you build reports on. It follows a Kimball-style star: a few central fact tables (the things that happen) joined to dimension tables (the things they happen to). If the vocabulary is new, our guide to data modeling and the breakdown of data model types are good companions.
The e-commerce template
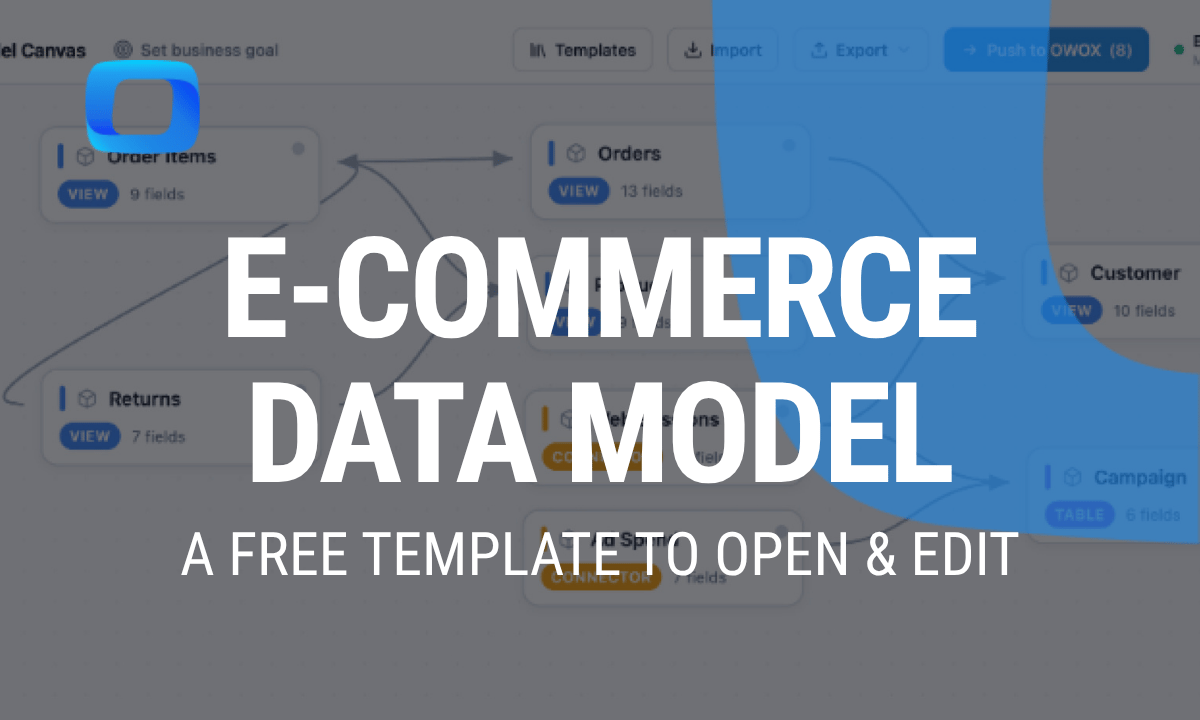
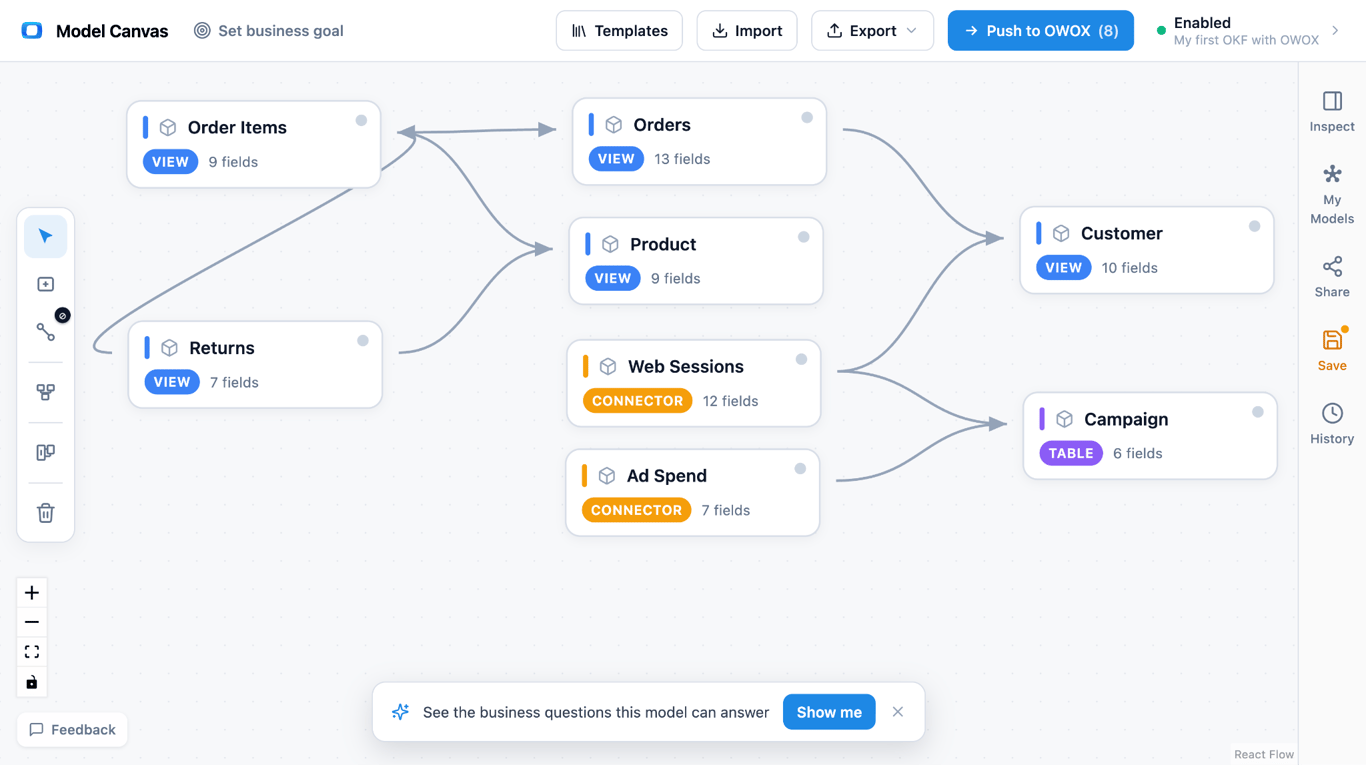
The template is six data marts – two dimensions and four facts – wired into a sales star. Here’s the whole thing.
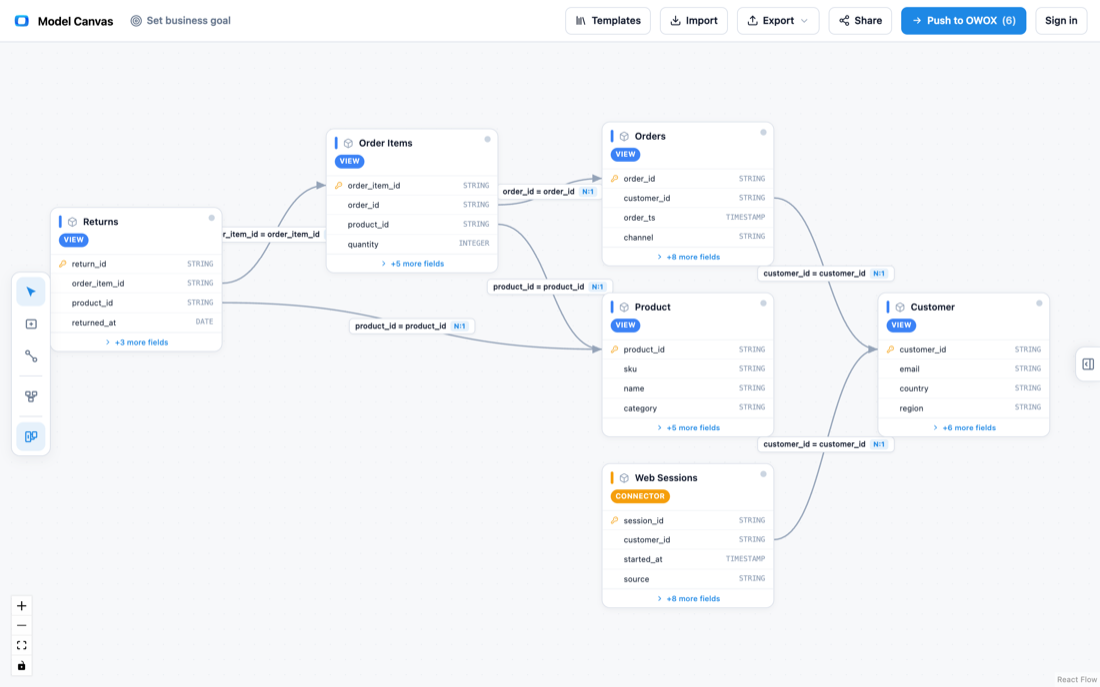
• Customer (dimension) – one row per buyer, with acquisition channel, first-order date, and region.
• Product (dimension) – one row per SKU, carrying category, brand, variant, and cost. This is where SKU, variant, and category attributes live.
• Orders (fact) – one row per order: totals, status, channel, and the Customer key.
• Order Items (fact) – one row per order line (order × SKU). This is where true line margin lives, because price, discount, and cost are per item, not per order.
• Web Sessions (fact) – one row per session, joined to Customer, for the behavioral funnel that orders alone can’t show.
• Returns (fact) – one row per returned line, joined back to Order Items and Product.
The joins make it a star: Orders → Customer, Order Items → Orders and Order Items → Product, Web Sessions → Customer, and Returns → Order Items and Returns → Product. Every table here is a reporting-ready data mart in the sense we describe in our approach to data marts.
OWOX Data Marts
See your first report built in real time. 15 minutes.
- Connect your data warehouse
- Pick your metrics
- Get a live Google Sheets report
In the time it takes to write a ticket. Then imagine never writing that ticket again.
Book a DemoWe'll use your actual use case
The grain that makes it work
The single most important decision in this model is grain – what one row represents – and it’s why there are two order tables instead of one.
Orders sit at order grain (one row per order), which is right for order counts, shipping, and status. Order Items sit at order-line grain (one row per order × SKU), which is the only place you can compute margin, discount, and units per product correctly. Collapse them into one table and you either double-count order totals or lose per-product economics. Keeping both, joined by the order key, is the classic move – the same fact-table thinking covered in the three types of fact tables and understanding star schema. For the broader pattern, see dimensional data modeling.
What this model answers
Because the grain and joins are right, the hard questions become straightforward:
• True line margin by category – from Order Items (price − discount − cost), rolled up through Product.
• Repeat-buyer rate by acquisition channel – from Orders joined to Customer.
• Return rate by product – from Returns joined to Order Items and Product.
• New vs. returning revenue – from order sequence per Customer.
• Browse-to-buy conversion – from Web Sessions joined to Customer and Orders.
None of these need a new table. They’re all just different paths across the same six data marts.
Analytics model vs. transactional schema
Analytics model vs. transactional schema
A common question when people first see this template is “where are the cart, checkout, and payment tables?” The short answer: those are transactional tables, and the analytics model starts one step downstream, at the order.
Carts, checkout sessions, and payment attempts belong to the OLTP schema that runs the storefront. For analytics you usually land the completed order and its lines, because that’s the grain reporting cares about. (And to clear up a frequent mix-up: schema in the SEO sense – product schema markup – is structured data for search engines, not a data model. Different thing entirely).
| Aspect | Transactional (OLTP) schema | Analytics data model (this template) |
|---|---|---|
| Shape | Normalized (carts, checkouts, payments) | Dimensional star (facts + dimensions) |
| Tuned for | Fast writes, app correctness | Fast questions, reporting |
| Starts at | Cart / checkout | Completed order + lines |
| Export | SQL DDL | OKF + diagram image |
How to open and customize the template
How to open and customize the template
Opening the template and shaping it to your store takes about two minutes, then as long as you want to refine.
(1) Open it. Use the link under the diagram above. It loads in your browser with no sign-up.
(2) Reshape it. Rename tables, add fields (loyalty tier, fulfillment center, marketing cost), and redraw joins on the canvas.
(3) Set grain and keys. Confirm what one row means on each fact, and the keys that join them.
(4) Export it. Use Export → OKF for a portable model, or grab a diagram image. Keep the OKF in git or push it into OWOX Data Marts to make it live in your warehouse.
If you’re weighing this against other diagramming apps, our roundup of free database diagram design tools puts it in context.
Export to OKF: a portable e-commerce model
Export to OKF: a portable e-commerce model
The reason this beats a static ER picture is what happens after the diagram. A drawing can’t be diffed or fed to a warehouse.
This template exports to OKF (Open Knowledge Format), Google’s open, markdown-based standard. Because it’s plain text, you can keep the model in git, review it in a pull request, and hand it off without lock-in. New to it? See our explainer on what OKF is, then open the e-commerce model and export your own.
Turn your data into decisions.
Governed data marts give you the clean foundation ML needs to actually work.
- No AI hallucinations
- Analyst-governed definitions
- Every number traces to SQL
Frequently Asked Questions
Is the e-commerce data model template free, and what can I export?
Yes, it is free with no sign-up. You can export the model as OKF or a diagram image. An OWOX account is only needed if you push the model into OWOX Data Marts.
What is schema in e-commerce?
It depends on context. In data modeling, a schema is the structure of your tables and relationships. In SEO, ecommerce schema means product schema markup, which is structured data for search engines and is unrelated to a data model.
How do I model returns and refunds in an e-commerce data model?
As a Returns fact at returned-line grain, joined back to Order Items and Product. That lets you measure return rate by product and net revenue after returns.
What is the grain of the orders vs order items table?
Orders is one row per order; Order Items is one row per order line (order × SKU). Line margin, discount, and units are computed at the Order Items grain, which is why the two tables are kept separate.
Where are the cart, checkout, and payment tables in an e-commerce data model?
Those live in the transactional schema. The analytics model starts at the completed order, which is the grain reporting needs, so cart and payment detail are intentionally upstream.
Is an e-commerce data model a transactional schema or an analytics model?
This template is an analytics model: a dimensional star you report from. The transactional (OLTP) schema that runs the storefront is a separate, normalized model upstream of it.
What tables are in an e-commerce data model?
At minimum: a Customer dimension, a Product dimension (carrying SKU, variant, and category), an Orders fact at order grain, and an Order Items fact at order-line grain. The OWOX e-commerce template adds Web Sessions and Returns facts for behavior and reverse logistics.