Fintech data model: a free neobank & lending template
Most fintech reporting breaks the moment a company does two things at once — a neobank that also lends. Card swipes and money movement are one kind of event; a loan application that gets funded and then repaid over months is a completely different kind. Stuff both into a single “transactions” table and you can never cleanly answer what funded rate, pull-through, or charge-off actually were, because the rows don’t share a grain.
This template keeps them apart on purpose. Engagement lives in one fact stream — every card and money movement — and lending lives in its own sub-model of loans and repayments, each at its own grain, all tied back through the same customers and accounts. That separation is the one hard thing this model gets right. It’s one of nine in our data model template gallery; this one is built for fintech.
What a fintech data model is
A fintech model is the set of tables — and the keys that join them — that describe who your customers are, what products they hold, and every financial event they generate. What makes fintech different from most reporting is that “an event” isn’t one thing. A card purchase, an incoming transfer, a loan being originated, and a scheduled repayment coming due are all events, but they happen at different frequencies, carry different fields, and answer different questions. Force them into one shape and every metric downstream gets fuzzy.
The fix is dimensional. You separate the slowly-changing descriptors (customers, products, accounts) from the high-volume events (transactions, loans, repayments), and you model each event stream at the grain it truly lives at. If those terms are new, start with our guide to data modeling and our explainer on understanding star schema — this template is a star at heart, just with two fact streams instead of one.
The fintech template, mart by mart
The fintech template, mart by mart
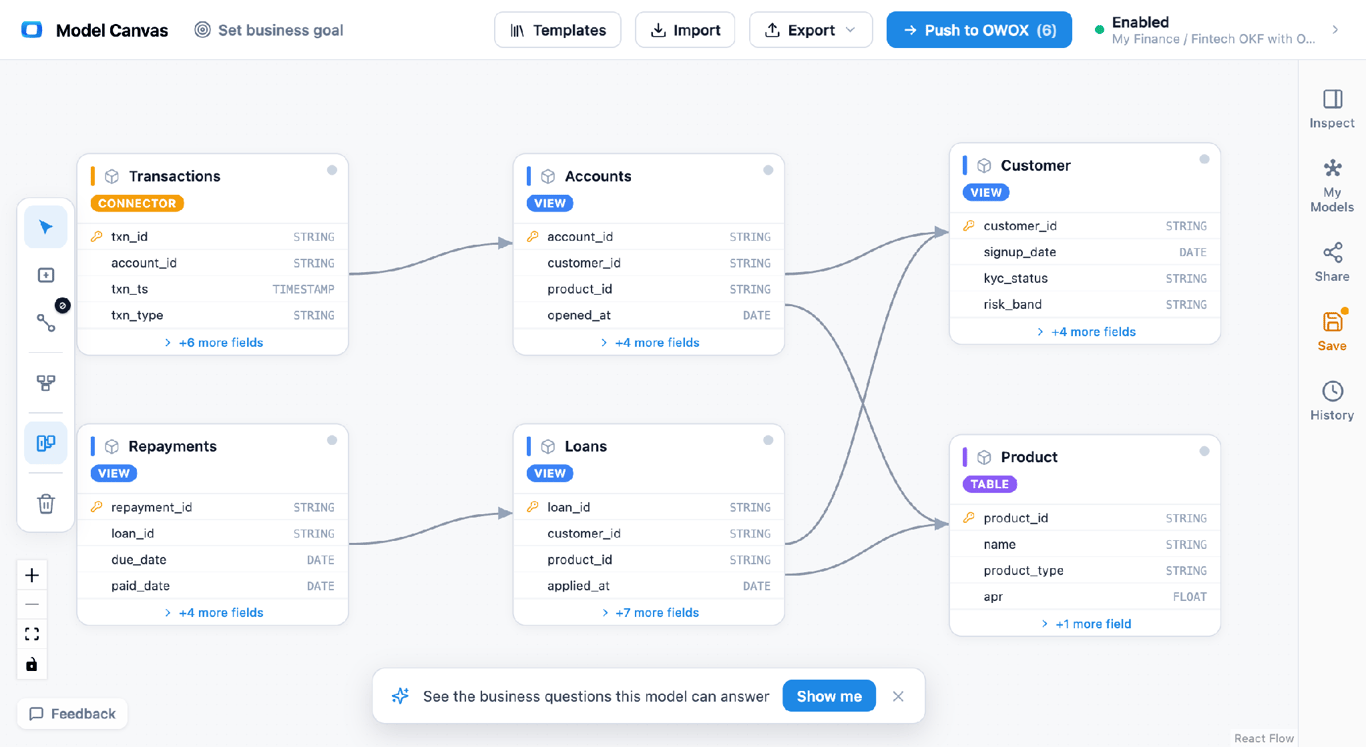
Entity relationship diagram of a fintech data model: three dimensions (Customer, Product, Account) feeding two fact streams — a Transactions fact and a lending sub-model of Loans and Repayments — joined through account and customer keys. Open the fintech model in the canvas →
• Customer (dimension) — one row per customer, keyed by customer_id. Holds KYC attributes (name, date opened, region, verification status) and a risk_band derived at underwriting. This is the spine both fact streams hang off.
• Product (dimension) — one row per product, keyed by product_id. Describes the thing held or borrowed — checking, savings, credit line, term loan — with its type, currency, and pricing tier.
• Account (dimension) — one row per account, keyed by account_id, with customer_id and product_id as foreign keys. This is the bridge: it links a specific customer to a specific product, so both engagement and lending events can point at one place.
• Transactions (fact) — one row per card swipe or money movement, keyed by transaction_id, with account_id as the foreign key. Amount, direction, merchant category, timestamp, status. This is the engagement fact — high volume, one grain: the individual movement.
• Loans (fact) — one row per loan origination, keyed by loan_id, with account_id and customer_id as foreign keys. It carries the application→funded funnel: applied date, decision, funded date, principal amount, term, APR, and current status. The grain is one loan, once.
• Repayments (fact) — one row per scheduled or actual repayment, keyed by repayment_id, with loan_id as the foreign key. Due date, paid date, amount due, amount paid, days-past-due, and charge-off flag. The grain is one installment — far finer than Loans.
The joins make it a two-stream star: Customer → Account, Product → Account, Account → Transactions, Account → Loans, Customer → Loans, and Loans → Repayments. Every fact resolves back to a customer, so engagement and lending sit in the same frame. For how these marts turn into governed, queryable tables, see our approach to data marts.
OWOX Data Marts
See your first report built in real time. 15 minutes.
- Connect your data warehouse
- Pick your metrics
- Get a live Google Sheets report
In the time it takes to write a ticket. Then imagine never writing that ticket again.
Book a DemoWe'll use your actual use case
Two grains, one story: origination vs installment
Two grains, one story: origination vs installment
The centerpiece of a fintech model is refusing to average two different grains. A loan is originated once — that’s the Loans grain, and it’s what drives funded rate (funded ÷ applied) and pull-through across the application funnel. A loan is repaid many times — that’s the Repayments grain, and it’s what drives delinquency (days-past-due buckets) and charge-off. If you tried to compute delinquency off the Loans table you’d be one row short per installment; if you tried to compute funded rate off Repayments you’d double-count every loan by its number of payments.
Modeling them as two separate facts, joined by loan_id, means each metric is computed at its native grain and only rolled up when you want it. Repayments aggregate up to a loan; loans aggregate up to a customer; and both meet transactions at the account. This is the classic distinction between transaction, periodic-snapshot, and accumulating-snapshot facts — worth reading our note on the three types of fact tables and the broader discipline of dimensional data modeling to place each of these tables.
What this model answers
• What’s our funded rate this month? Loans, counting funded ÷ applied by funded date — pure origination grain.
• Where do applications drop off? Loans, comparing applied → decisioned → funded counts to expose the pull-through funnel.
• What’s 30/60/90-day delinquency by risk band? Repayments → Loans → Customer, bucketing days-past-due and grouping by risk_band.
• What’s our charge-off rate on the last cohort? Repayments (charge-off flag) → Loans (funded date cohort) → Customer.
• Do heavy card users borrow more? Transactions rolled to Account, joined to Loans on the same account and customer — engagement meets lending in one query.
Two fact streams vs one flat transactions table
Two fact streams vs one flat transactions table
The naive build is a single transactions table where loans and repayments are just more rows with a type column. It looks simpler until the first lending metric. Because loans and repayments have different grains and fields, cramming them into one shape means every query starts with a filter and every amount column means something different per row.
| Aspect | One Flat Transactions Table | Transactions + Lending Sub-Model |
|---|---|---|
| Grain | Mixed — swipes, loans, and installments share rows | One grain per fact: movement, loan, installment |
| Funded Rate | Needs type filters and dedup gymnastics | Direct count on the Loans fact |
| Delinquency / Charge-Off | Hard — installments aren’t first-class | Native on the Repayments fact |
| Amount Columns | Overloaded, meaning shifts per row type | Clean per fact — clear what each measures |
| Engagement vs Lending | Tangled in one table | Separated, joined cleanly through Account/Customer |
How to open and customize the template
How to open and customize the template
(1) Open it. Launch the fintech model in the canvas — the full three-dimension, two-fact-stream diagram loads ready to edit.
(2) Reshape it. Add or drop columns to match your stack — a merchant_id dimension for transactions, a collections_stage on repayments, whatever your product needs.
(3) Set grain and keys. Keep one PK per table and FKs on the facts (account_id, customer_id, loan_id). This is the part that protects your metrics — don’t let two grains collapse into one table.
(4) Export it. Push it into OWOX Data Marts to turn the model into governed, queryable tables your team can build reports on.
For sketching variants before you commit, see our roundup of free database diagram design tools.
Export to OKF: a portable fintech model
Export to OKF: a portable fintech model
The canvas exports to OKF — the Open Knowledge Format — so your fintech model isn’t trapped in one tool. OKF is a plain, human-readable description of tables, columns, keys, and relationships that you can version in git, review in a pull request, and hand to any tool that reads it. For a model with two fact streams and strict grains, that portability matters: the rules that keep loans and repayments separate travel with the file.
If you’re new to it, here’s what OKF is and why a portable model beats a screenshot of a diagram. When you’re ready, open the fintech model, adapt it, and export.
Ask this model a question
The template above is a diagram you can edit. The same business is also published as a ready Finance Data Model of 8 Data Marts with their relationships, which can be imported into OWOX Data Marts. Once it is in your project, a business user can ask it a question in Claude or ChatGPT through the OWOX MCP server.
Data Model: Finance (8 Data Marts)
Prompt: “How many loan applications were approved, declined or withdrawn last quarter, and how much was actually funded?”
The reason to ask the Data Model and not the warehouse is what the assistant gets to read.
| Asked of raw tables | Asked of the Data Model | |
|---|---|---|
| What the assistant sees | Every table in the warehouse | The published Data Marts and their declared joins |
| What it does | It counts every row of the loans table as a loan and sums the requested amount, so declined and withdrawn applications inflate the loan book | It reads the Loans Data Mart, which records the outcome of each application and the amount actually funded as separate fields |
| What you get | A plausible number with no way to check it | The number, and the query that produced it |
MCP is only the way the question arrives. What makes the answer safe is the Data Mart behind it: SQL an analyst wrote and published, which the assistant reads and does not write. A question the Data Marts do not cover is not approximated. It goes back to the data owner. More on how that works in governed MCP analytics.
Turn your data into decisions.
Governed data marts give you the clean foundation ML needs to actually work.
- No AI hallucinations
- Analyst-governed definitions
- Every number traces to SQL
Frequently Asked Questions
Is the fintech template free?
Yes. Open it in the canvas at no cost, reshape it to your stack, and export it to OKF or push it into OWOX Data Marts.
Can I use this template for a lending-only or neobank-only business?
Yes. Keep the dimensions and drop the fact stream you don't need — Transactions for a pure lender, or Loans and Repayments for a pure neobank. The dimensional spine stays the same.
How does the KYC risk band fit in?
It's an attribute on the Customer dimension, set at underwriting. Because every fact resolves back to a customer, you can group any metric — engagement, funded rate, or delinquency — by risk band without adding it to the fact tables.
How do I calculate delinquency and charge-off in this model?
Both come off the Repayments fact. Delinquency buckets rows by days-past-due; charge-off counts the charge-off flag. Join Repayments → Loans → Customer to slice either by cohort or risk band.
What grain should the Loans table use?
One row per loan origination — the loan happens once. That grain drives funded rate and application pull-through. Repayment behavior belongs in the Repayments fact, at one row per installment.
Why separate transactions from loans and repayments?
Because they live at different grains. A card movement, a loan origination, and a scheduled installment aren't the same kind of event, so keeping them in separate facts lets you compute funded rate, delinquency, and charge-off each at its native grain without filters or double-counting.
What is a fintech data model?
It's the set of tables and joins that describe your customers, the products they hold, and every financial event they generate. In a neobank-plus-lending business it splits into descriptive dimensions (Customer, Product, Account) and event facts (Transactions, Loans, Repayments), each modeled at its own grain.