

Forex & CFD broker data model: a free client-acquisition template
8-mart brokerage acquisition model: session → lead → registration → KYC → FTD → NTC, with cost-per-FTD and client quality on one canvas. Free, exports to OKF.

.png)
A broker data model is the set of tables – ad spend, sessions, leads, clients, deposits – and the keys that join them, arranged around the one question a retail forex or CFD brokerage lives on: what does a funded, trading client cost, and what are they worth once they arrive? The funnel is long and gated – a click becomes a lead, a lead a registration, a registration a KYC-verified client, and only then a first deposit and a first real trade – and a model that can't follow a person across all of those steps can't tell a cheap channel from a good one.
This page gives you a free, ready-made brokerage acquisition model you can open in your browser, edit like a diagram, and export to OKF – Google's open, portable format. No sign-up. It's one of the niche models in our data model template gallery; this one is built for the acquisition and funding side of a trading business. New to the vocabulary? Start with what data modeling is.
What this model covers – and where it stops
This model covers the whole client-acquisition and funding journey: budget bought across platforms and targeting countries, the visits it produces, the short lead-capture forms those visits leave behind, the sales desk that calls them, the identity checks that decide who gets in at all, and the deposits that determine whether any of it paid for itself – plus lifetime value, withdrawals, and the lifecycle segments that say what happened after.
The funnel, in the industry's own vocabulary
If you run a brokerage, you already think in these five steps – the model is built around them so your dashboards and your data speak the same language:
1.Session – a visit from paid or organic traffic.
2.Short form (lead) – the moment a visitor stops being anonymous and leaves a phone number.
3.Long form (registration) – the full account sign-up.
4.FTD – First Time Depositor: the client's first completed deposit. The point the whole funnel finally turns into cash.
5.NTC – New Trading Client: the first real (non-demo) trade.
Between steps 3 and 4 sits the gate that makes brokerage acquisition unlike any other funnel: KYC. A registered user who never clears identity verification never funds, and a model that skips that step will overstate how many of your sign-ups were ever going to convert.
What's deliberately out of scope
It's worth being precise: this model ends where trading begins. Executed trades, instruments, volumes, and the spread or commission a broker earns are out of scope, so "trading revenue by symbol" has no answer here. What it does answer is the acquisition question – what a funded client costs, where they come from, and what they're worth – which is where most brokerages actually lose money.
The model, mart by mart
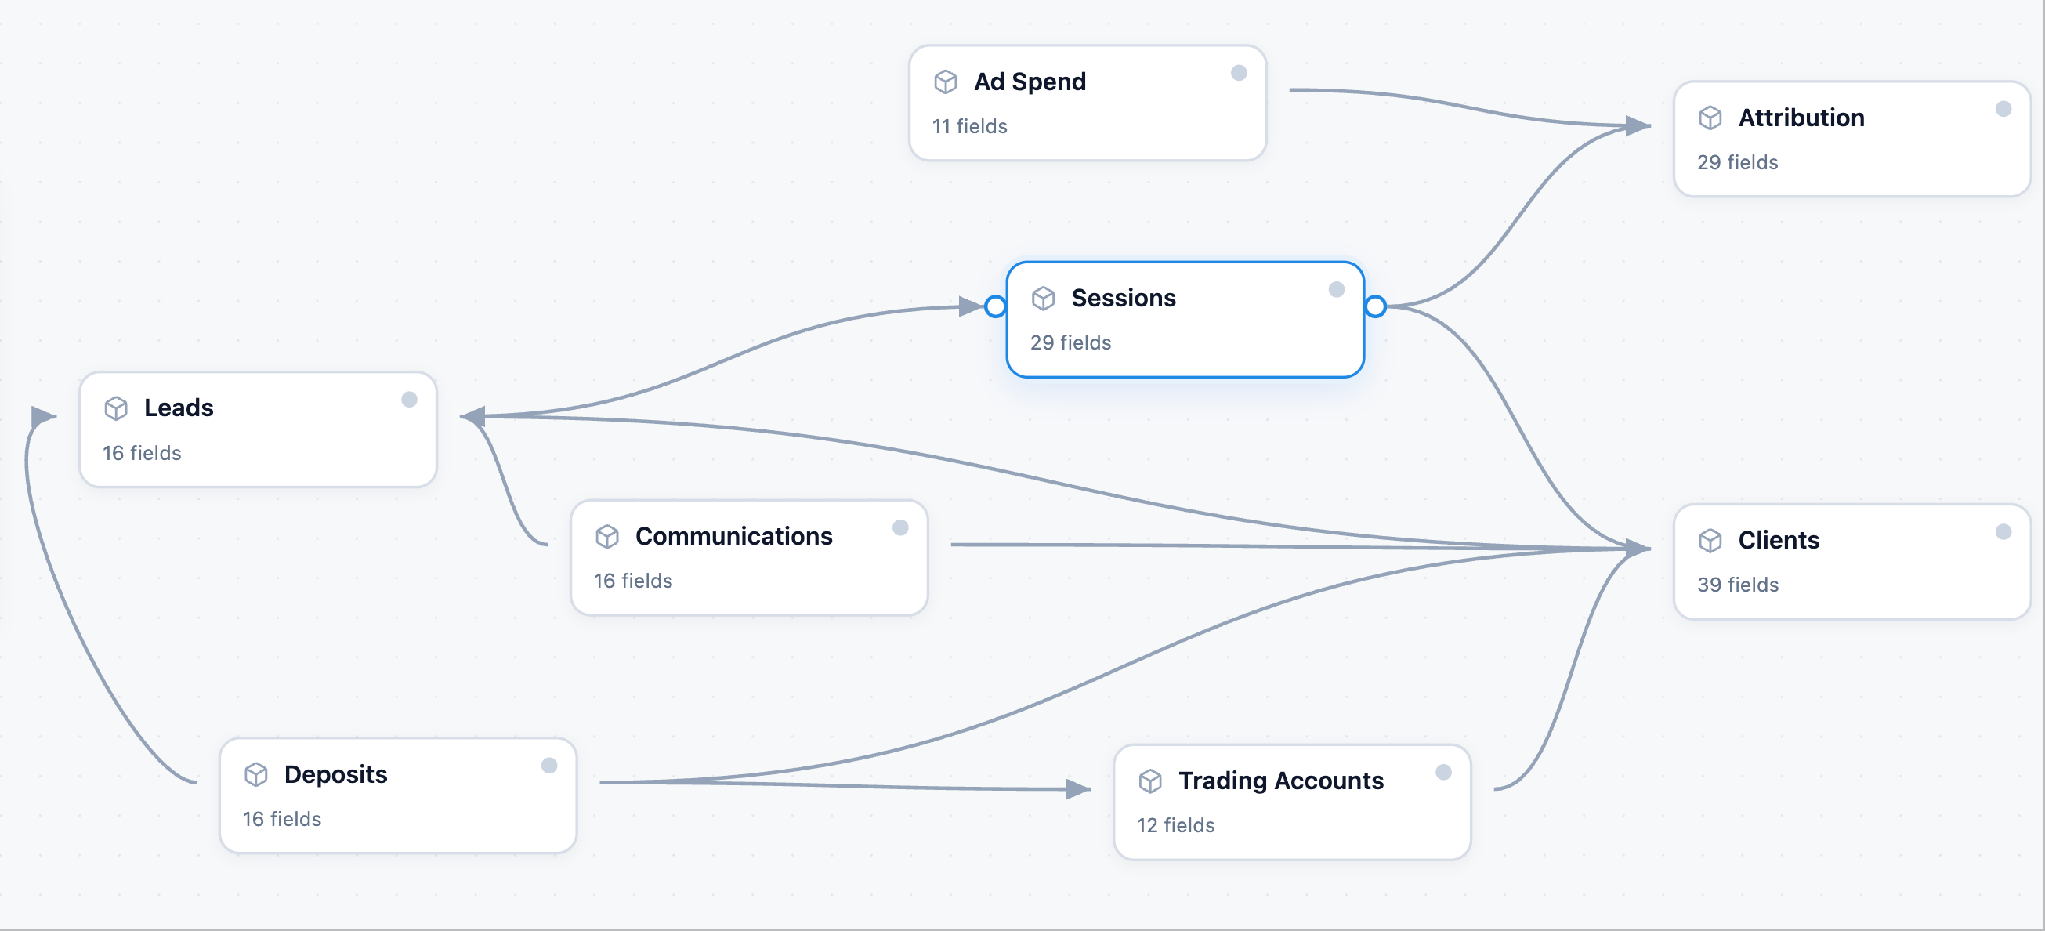
The template is 8 data marts. Two of them – Attribution and Clients – do most of the work, and the other six supply the detail behind them.
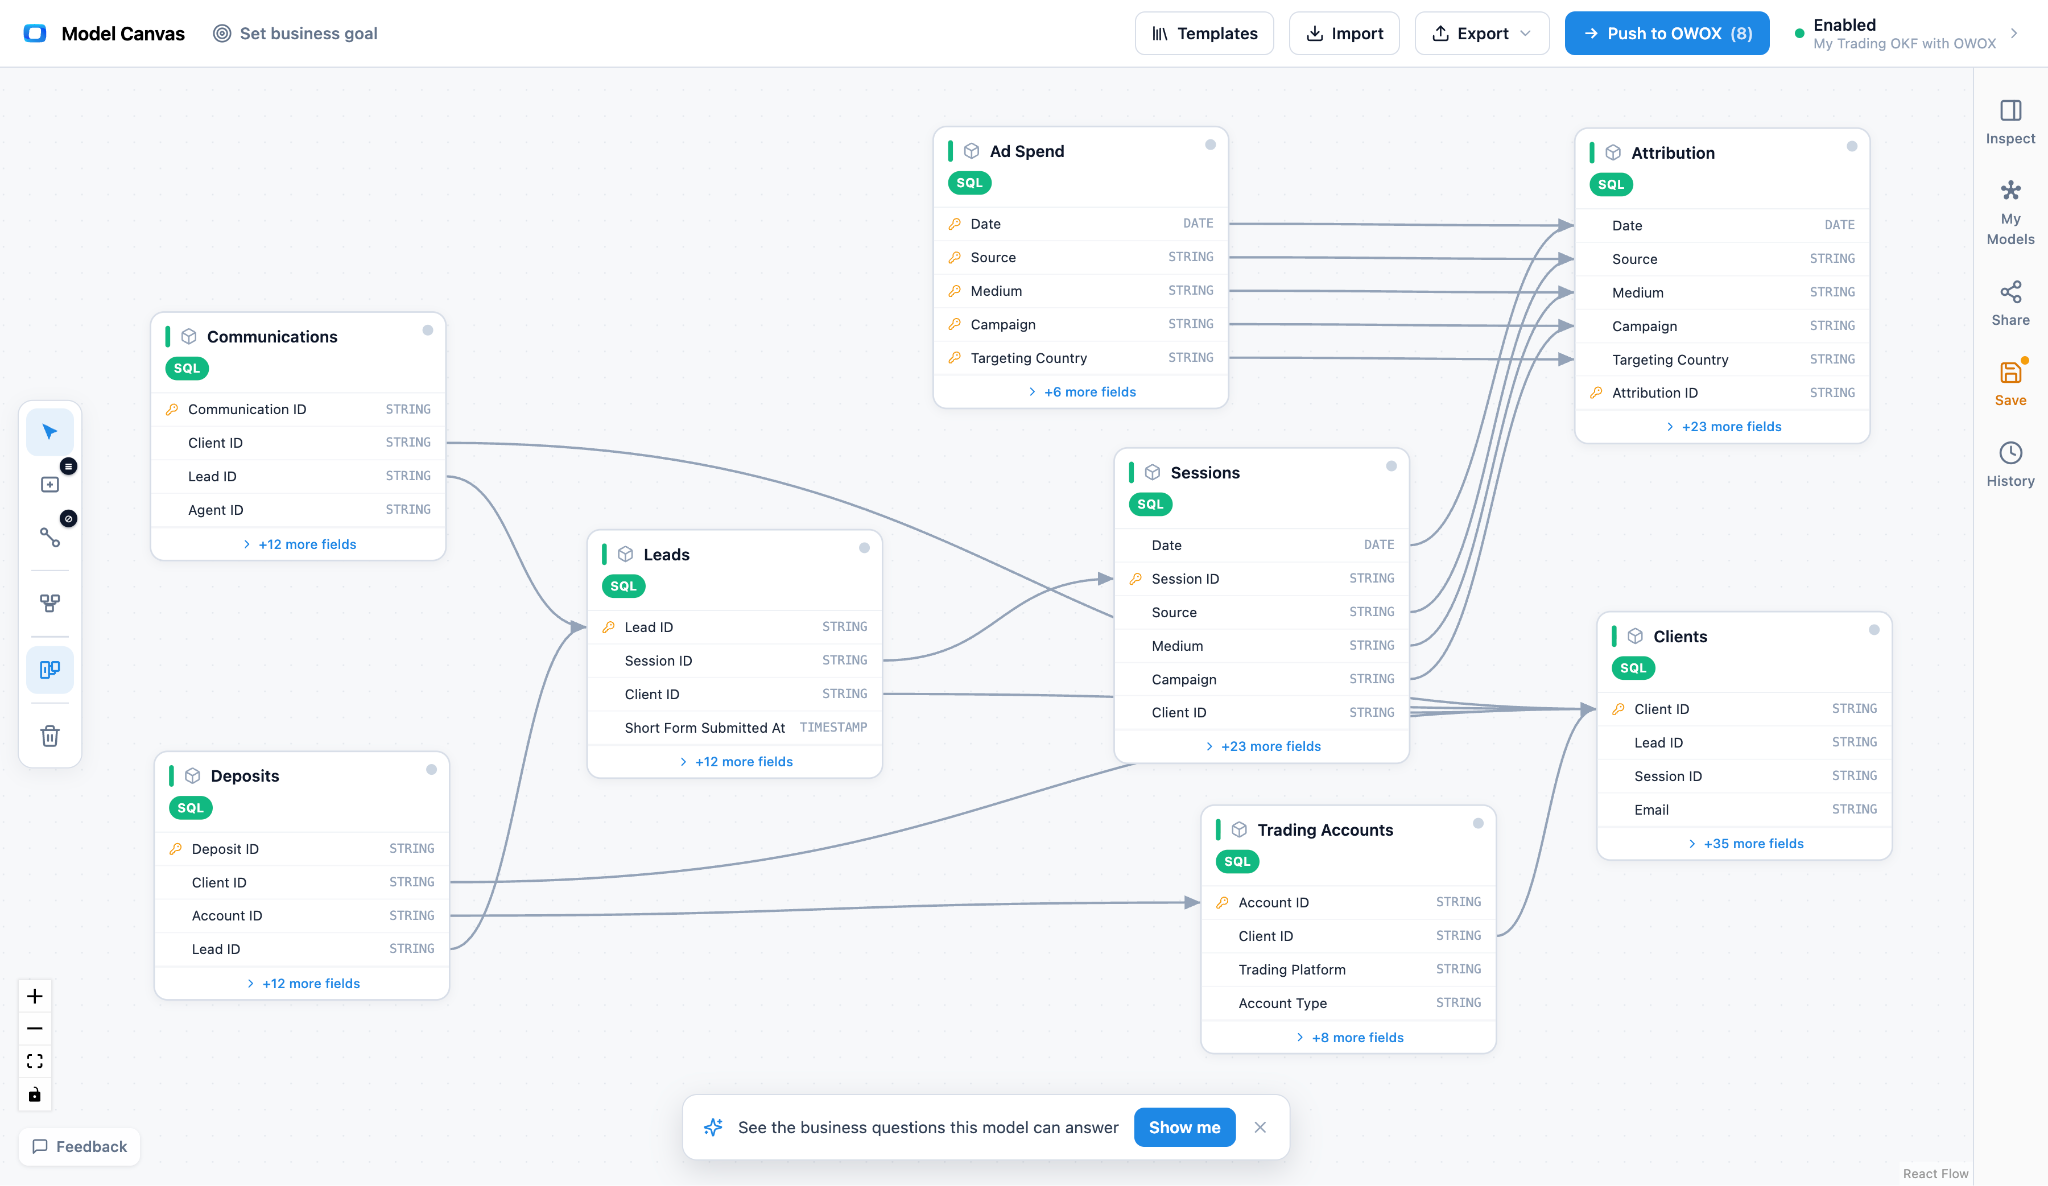
Entity-relationship diagram of an 8-mart brokerage acquisition model: Ad Spend and Sessions feeding Leads and Clients, with Communications (the sales desk), Deposits (the money ledger) and Trading Accounts around the Clients core, and an Attribution mart carrying the whole spend-to-deposit funnel on one row. Open this model in the canvas →
Attribution – the whole funnel on one row
The single hardest thing about brokerage reporting is that the payoff – a first deposit – happens weeks and several identity checks after the click that caused it. Attribution solves that by assembling the entire funnel on one row per day / source / campaign / targeting country: the spend, then every downstream step, side by side. CPL, cost-per-FTD and ROAS become ratios between two columns of the same row, and the stage where a channel actually loses people is visible without joining anything.
This is a pre-aggregated accumulating-snapshot-style fact table; the grain choices are covered in the three types of fact tables.
Clients – the trader profile, and the heart of the model
One row per registered client, carrying the four milestones the business is run on – registration, verification, first deposit, first trade – with the days between them stored as numbers, plus every deposit and withdrawal already totalled, lifetime value, an RFM score, and a lifecycle segment that names what the client is today. This is the mart that answers who the customers are, what they're worth, and which of them are slipping away.
The reason this mart matters isn't the milestones; it's that the milestones sit next to LTV, RFM and the acquisition source on the same row. That's what turns "which channel is cheapest per FTD" into the far more useful "which channel buys clients worth keeping."
Leads – where a visitor stops being anonymous
One row per short-form submission: the handful of contact details someone leaves on a landing page before anyone has spoken to them. Each row keeps the page and session that produced it, the email and phone the desk will call, the system that captured it (`website_form`, `app_form`, `affiliate`, `chatbot`), and a `status` tracking the stage reached – `contacted`, `long_form`, `ftd`, `ntc`, `no_answer`, `rejected`. This is the only place in the model where the leads that were never reached at all are visible next to the ones that converted – which is exactly the comparison a sales-desk budget rides on.
Communications – the sales desk, in the data
Every contact attempt between the desk and the people it's trying to convert: one row per attempt across `call`, `email`, `sms`, `live_chat`, `whatsapp`, `telegram`, recording who handled it, whether the desk reached out (`outbound`) or the client did (`inbound`), and whether it `successful`ly landed or went `unsuccessful`.
Rows are flagged `is_first` / `is_last` / `is_sales`, so the shape of a relationship – how many attempts before someone answered, when the desk last got through, whether the last thing that happened was silence – reads without reconstructing a timeline. A `is_last = true` call with `status = unsuccessful` is what stamps a client `lost` over in the Clients mart. This is the human half of the funnel, and most models don't have it at all.
Deposits – the money ledger, including the money that never arrived
One row per funding transaction, money in and money out, tied to the client, the account it moved through, and the originating lead. The design decision that matters here: attempted funding is first-class. A meaningful share of deposits never complete – they fail, reverse or cancel – and counting those as revenue overstates the business.
"Which payment method fails most, and how much money is it costing us?" is a native question here – not a data project.
Sessions, Trading Accounts & Ad Spend
The supporting cast. Sessions is every site and app visit – first- vs last-touch source, device, country, engagement – and it carries the client id once the visitor registers, which is the bridge from anonymous traffic to a named client. Trading Accounts is one row per MT4 / MT5 account (base currency, leverage, type, balance, equity) – where multi-account behaviour shows up. Ad Spend is daily spend by source, campaign and `targeting_country`, in one reporting currency, with impressions and clicks; it shares its campaign grain with Attribution so cost lines up with outcomes.
Every table above is a reporting-ready data mart in the sense we describe in our approach to data marts.
The design decisions that make it a brokerage model
Four choices separate this from a generic marketing-funnel schema.
The whole funnel lives on one row
Stitching spend to FTDs across five tables is where brokerage numbers usually break, because the deposit lands weeks after the click. Attribution carries every step side by side per channel-day, so cost-per-FTD is a division, not a project – and the leak point is obvious.
Failed funding is first-class
Only completed money (`amount_normalized`) can reach a revenue total, while method and local amount survive on failed attempts. Payment friction becomes measurable and valuable: you can put a dollar figure on the deposits your card processor is quietly losing you.
The sales desk is in the model
Communications lets you answer the question the whole call-centre budget rides on: do the leads someone actually reached deposit more often, and sooner, than the ones that were never answered? Reach becomes a measurable driver, not an article of faith.
Targeting country ≠ where the client lives
Ad Spend carries the `targeting_country` you bought; Clients carries the country of residence. Confusing the two is a classic brokerage reporting error – the model keeps them apart so "FTDs by country" and "spend by targeted region" never quietly merge. It's a dimensional model at heart; the primer is dimensional data modeling, and the join backbone is a star schema.
Cheap clients vs. good clients
The metric most brokerages optimise – lowest cost-per-FTD – quietly rewards the wrong channels. The cheapest first deposits are often one-and-done: a client funds once, never trades, and goes dormant. This model is built to catch that, because Clients carries LTV, RFM and a lifecycle segment next to the acquisition source.
So instead of ranking channels by cost-per-FTD alone, you can ask whether the cheap channels produce `champions` with real deposit volume or `lost` accounts that never came back – and re-allocate budget toward clients worth keeping. That single re-frame, from cost per funded account to value per funded account, is usually worth more than any bid optimisation.
What this model answers
Because the funnel is assembled and the client carries their own history, the hard brokerage questions become joins, not projects:
- Cost per FTD and ROAS by channel – straight off the Attribution row.
- Channel quality, not just channel cost – cheapest CPFTD campaigns cross-checked against the LTV and RFM label of the clients they produced.
- Does the desk change the outcome – reached vs never-answered leads compared on deposit rate and time-to-FTD.
- Where money leaks in funding – deposit failure rates and lost volume by payment method.
- Which regions pay back – deposit volume vs budget by acquisition region, and how much is withdrawn again within months.
None of these need a new table – they're different paths across the same 8 data marts.
How to open and customize the template
Opening it and shaping it to your brokerage takes about two minutes, then as long as you want to refine.
- Open it. Use the link under the diagram above – it loads the live model in your browser, no sign-up.
- Reshape it. Add fields (affiliate / IB id, bonus flags, regulatory entity), split Communications by desk, or add a demo-account dimension; redraw joins on the canvas.
- Set grain and keys. Confirm Deposits is one row per transaction and that the identity bridge (`email` / `phone` across Leads and Clients) ties an anonymous lead to a funded client.
- Export it. Use Export → OKF for a portable model, or grab a diagram image. Keep the OKF in git, or push it into OWOX Data Marts to make it live in your warehouse.
Comparing tools while you're here? Our roundup of free database diagram design tools puts the canvas in context, and the marketing lead-gen template is the closest sibling if your funnel ends at a qualified lead rather than a funded account.
Export to OKF: a portable, AI-readable model
The reason this beats a static ER picture is what happens after the diagram. A drawing can't be diffed, version-controlled, or fed to a warehouse – or to an AI assistant.
This template exports to OKF (Open Knowledge Format), Google's open, markdown-based standard. Because it's plain text, you can keep the model in git, review it in a pull request, and hand it to a text-to-SQL agent as trustworthy context so it stops guessing your joins – which matters more in a domain this acronym-dense (FTD, NTC, KYC, CPL). New to it? See our explainer on what OKF is, then open the broker model and export your own.
Ready to build? Open the broker acquisition model free in the canvas →
Frequently asked questions


"AI by its nature will hallucinate. You need guardrails so you can trust your data."
"We had six or seven different channels and no single source of truth. It was almost impossible"
"We regained time. And time is the one resource that never comes back."