Mobile game data model: a free analytics template
Free-to-play mobile games live and die on a handful of numbers: how many players come back on day 1, day 7, and day 30; how much the payers spend; how much the ads earn; and whether the money spent acquiring a cohort ever comes back. The hard part is that none of these numbers exist in your app’s raw logs. They have to be reconstructed — and the shape of your model decides whether that reconstruction is a five-minute query or a month of workarounds.
This template gets one thing right that most homegrown game analytics get wrong: it keeps a single fact table at the grain of one row per gameplay event. From that one table you can rebuild retention, payer conversion, ad revenue per user, and return on ad spend, without re-instrumenting the client. It’s one of nine in our data model template gallery; this one is built for free-to-play mobile game analytics.
What free-to-play mobile game analytics data model is
What free-to-play mobile game analytics data model is
A mobile game data model is the set of tables — and the keys that join them — that turn raw client and server logs into the metrics a live-ops or UA team actually reports on. In free-to-play, the model has to carry two very different money streams (in-app purchases and ad revenue) alongside behavioral signals (sessions, levels, features used) and acquisition data (which campaign brought each player in), and it has to let you slice all of them by install cohort.
What makes it different from a generic analytics schema is the centrality of the event. A retail model can lean on orders; a game has no single “order” — it has a firehose of small actions, and almost every important metric is an aggregation over those actions filtered by time-since-install. So the model is built as a star: player and time dimensions in the middle, wide fact tables of events, sessions, purchases, impressions, and spend radiating out. If you’re new to the pattern, start with our guide to data modeling and this walkthrough of understanding star schema.
The mobile game template, mart by mart
The mobile game template, mart by mart
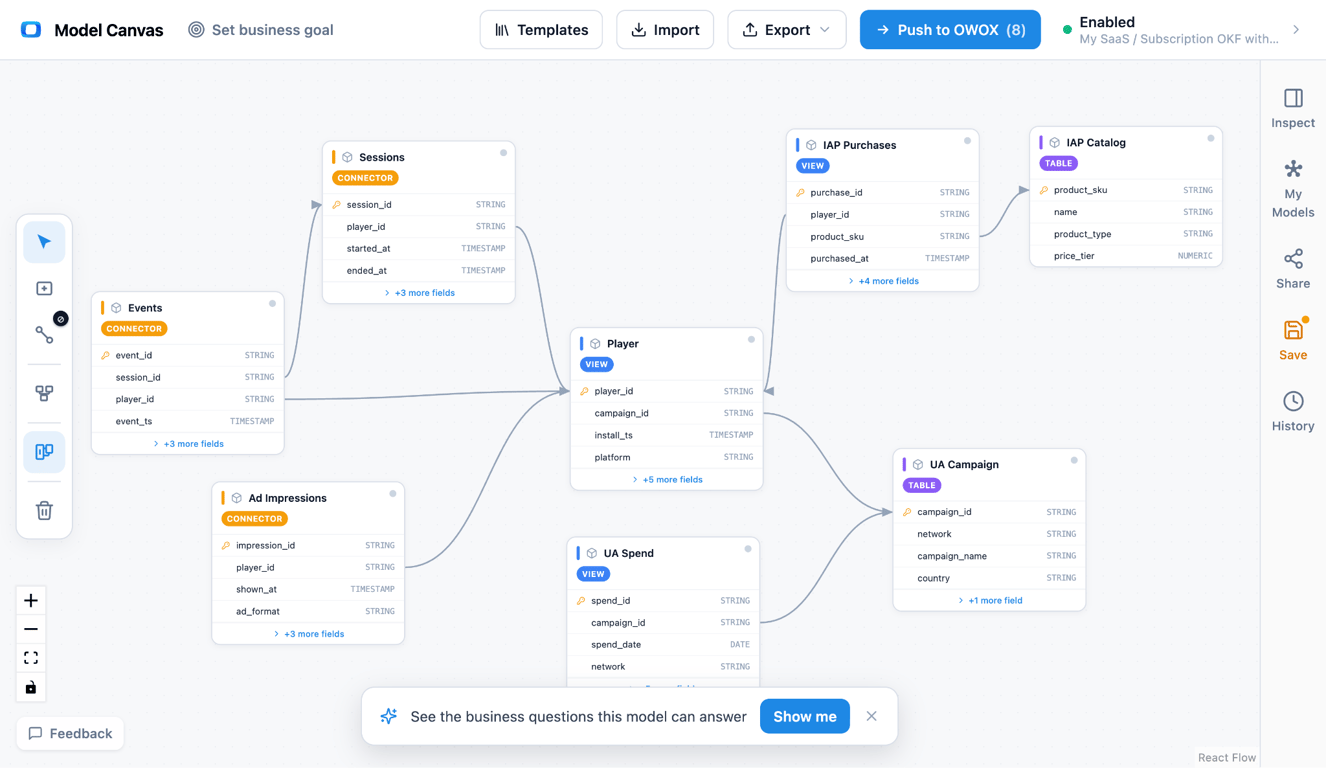
Entity relationship diagram of a free-to-play mobile game data model: a central Player dimension joined to Sessions, Events, IAP Purchases, and Ad Impressions fact tables, with a separate UA Spend fact keyed by acquisition campaign and day. Open the mobile game model in the canvas →
• Player (dimension) — one row per installed player, keyed by player_id. Holds acquisition_source, install_date, and platform. This is the cohort spine every fact joins back to.
• Sessions (fact) — one row per session, keyed by session_id with a player_id foreign key. Carries session_start, session_end, and duration. This is what powers DAU, session length, and stickiness.
• Events (fact) — one row per gameplay event (level_up, purchase_view, tutorial_complete, and so on), keyed by event_id with player_id and session_id foreign keys, plus event_name and event_timestamp. This is the central fact table — the widest and the most valuable.
• IAP Purchases (fact) — one row per in-app purchase, keyed by purchase_id with a player_id foreign key, carrying amount, currency, and purchase_timestamp. The source of revenue, ARPPU, and payer conversion.
• Ad Impressions (fact) — one row per ad shown, keyed by impression_id with a player_id foreign key, carrying ad_revenue, ad_network, and impression_timestamp. The source of ad ARPDAU.
• UA Spend (fact) — one row per campaign-day, keyed by spend_id, carrying acquisition_source, spend_date, and cost. It joins to players through the acquisition source rather than a per-row key, because spend is reported by campaign, not by user.
The joins make it a star: Sessions → Player, Events → Player, Events → Sessions, IAP Purchases → Player, Ad Impressions → Player, and UA Spend → Player by acquisition source. Everything measurable hangs off the Player dimension, which is exactly what lets you cohort by install date and source. For how these fact tables become the reports a team reads every morning, see our approach to data marts.
OWOX Data Marts
See your first report built in real time. 15 minutes.
- Connect your data warehouse
- Pick your metrics
- Get a live Google Sheets report
In the time it takes to write a ticket. Then imagine never writing that ticket again.
Book a DemoWe'll use your actual use case
The event-grain fact table
The single most important decision in this model is the grain of the Events table: one row per gameplay event, not one row per player per day. That choice is what makes free-to-play analytics possible.
Because every event carries a player_id, a session_id, and a timestamp, and because the Player dimension carries install_date, you can compute time since install for any event on the fly. That one derived value is the key to nearly everything. D1/D7/D30 retention is “did a player who installed on day X produce any event on day X+1, X+7, X+30.” Payer conversion is the same filter applied to IAP Purchases. Feature adoption, funnel drop-off, level-completion curves — all of them are just different event_name filters over the same grain. Nothing has to be pre-decided at instrumentation time, because the raw grain is preserved. When you later want a metric nobody thought of at launch, it’s already in the data. This is a classic transactional fact table, and it pairs with a periodic-snapshot rollup for reporting; see the three types of fact tables and the broader pattern in dimensional data modeling.
What this model answers
• What’s our D7 retention by acquisition source? Player → Events, filter events to install_date + 7 days, group by acquisition_source.
• What’s ARPPU this month? IAP Purchases → Player, sum amount over distinct paying player_id.
• What share of players convert to payers in their first week? Player → IAP Purchases, count players with a purchase within 7 days of install_date over the cohort.
• What’s our ad ARPDAU? Ad Impressions → Player joined to Sessions for daily actives, sum ad_revenue divided by DAU.
• Is our UA profitable? UA Spend → Player by acquisition_source, compare cost against combined IAP and ad revenue for the same cohort — that’s ROAS.
Mobile game data model vs pre-aggregated daily rollups
Mobile game data model vs pre-aggregated daily rollups
The tempting shortcut is to log a daily rollup per player — one row with today’s sessions, revenue, and events counted up — and throw the raw events away. It’s smaller and it feels tidy. It’s also a trap: a daily rollup bakes in the questions you thought to ask on day one, and any new metric means re-instrumenting the client and waiting weeks for data to accumulate.
| Aspect | Pre-aggregated daily rollups (rigid) | Raw event grain (this template) |
|---|---|---|
| Grain | One row per player per day | One row per gameplay event |
| New metrics | Require re-instrumentation and backfill | Query the existing data |
| Retention windows | Fixed to what you pre-computed | Any window — D1, D7, D30, D90 |
| Funnel / drop-off analysis | Impossible without event-level data | Native — filter by event_name |
| Storage cost | Lower | Higher, but cheap relative to lost insight |
How to open and customize the template
How to open and customize the template
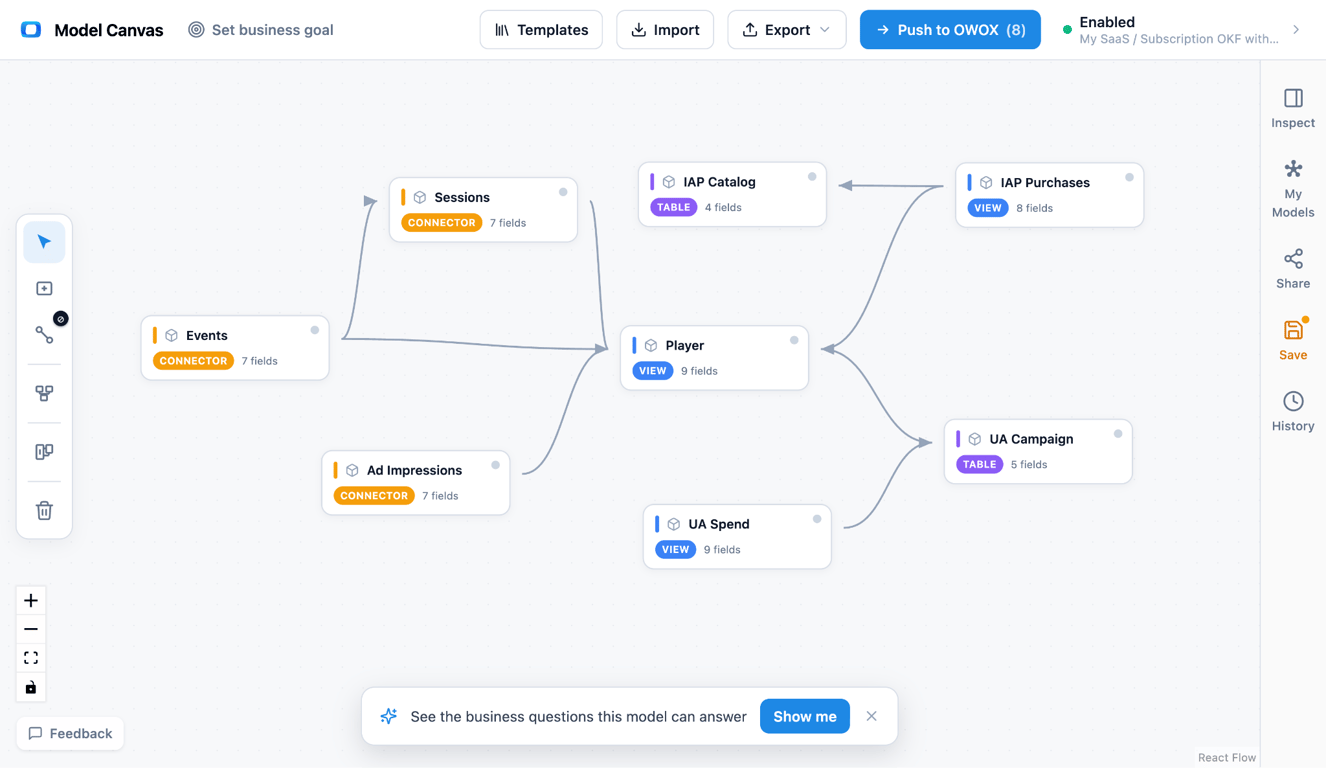
(1) Open it. Launch the mobile game model in the canvas → to see all six marts and their joins on one screen.
(2) Reshape it. Add the dimensions your game needs — a Levels dimension, a Currency dimension, or an A/B-test variant on the Player row. Rename event_name values to match your own taxonomy.
(3) Set grain and keys. Confirm each fact stays at its intended grain (one event, one session, one purchase, one impression, one campaign-day) and that every fact carries the player_id foreign key back to the Player dimension.
(4) Export. When the shape is right, push it into OWOX Data Marts to turn the model into governed, queryable tables. If you want to sketch variations first, try these free database diagram design tools.
Export to OKF: a portable mobile game model
Export to OKF: a portable mobile game model
The template isn’t locked to one tool. You can export it as OKF — the Open Knowledge Format — a plain-text, human-readable description of every table, column, key, and join. That means the model travels with you: into version control, into a code review, into another BI stack, or into a teammate’s editor, without a proprietary file getting in the way.
For a live-ops team, that portability matters because the model is a shared contract. When your analyst, your UA manager, and your engineers all read the same OKF file, “D7 retention” means the same thing to everyone. Learn what OKF is, then open the mobile game model and export it in a couple of clicks.
Turn your data into decisions.
Governed data marts give you the clean foundation ML needs to actually work.
- No AI hallucinations
- Analyst-governed definitions
- Every number traces to SQL
Frequently Asked Questions
Can I export this model to use outside OWOX?
Yes. Export it as OKF, a plain-text format describing every table, key, and join, so the model works in version control, another BI tool, or a teammate's setup without lock-in.
Why not just store a daily rollup per player?
A daily rollup only answers the questions you pre-computed. The moment you need a new metric or a different retention window, you have to re-instrument the client and wait for fresh data. The raw event grain answers new questions immediately against data you already have.
How is ROAS calculated in this model?
Join UA Spend to players by `acquisition_source`, then compare each cohort's `cost` against its combined IAP and ad revenue over the same period. Because spend is keyed by campaign-day and revenue is keyed by player, the Player dimension's `acquisition_source` is the bridge between them.
How do I model in-app purchases and ad revenue together?
Keep them as two separate fact tables — IAP Purchases at one row per purchase, Ad Impressions at one row per ad shown — both joined to the Player dimension. You combine them only at query time when you need total revenue per cohort, which keeps each stream clean and auditable.
What grain should the events fact table use?
One row per gameplay event, with `player_id`, `session_id`, `event_name`, and `event_timestamp`. This transactional grain is what lets you reconstruct retention, funnels, and feature adoption from a single table instead of pre-aggregating and losing detail.
How do you calculate D1/D7/D30 retention from event data?
Join events back to the Player dimension, compute time-since-install from each event's timestamp and the player's `install_date`, and check whether a player produced any event on the target day. Because the event grain is preserved, you can compute any retention window without re-instrumenting the game.
What is a mobile game data model?
It's the set of tables and joins that turn raw game logs into the metrics a live-ops or UA team reports on — retention, ARPPU, ad revenue, and ROAS. In this template it's a star schema with a Player dimension in the center and fact tables for sessions, events, purchases, ad impressions, and UA spend.