Stack Overflow data model: the public BigQuery dataset
A Stack Overflow model is the set of tables – users, questions, answers, comments, votes, badges, and tags – plus the keys that join them into something you can actually report from. The public Stack Overflow dataset in BigQuery ships with all of that data, but as a pile of raw tables no one has drawn the lines between. Draw those lines once and questions like “what’s our answer rate by tag?” or “how does reputation build over time?” become a single query instead of a scavenger hunt.
This page gives you a free, ready-made Stack Overflow data model you can open in your browser, edit like a diagram, and export to OKF – Google’s open, portable format. No sign-up, no install. It’s one of nine in our data model template gallery; this one is built for the public Stack Overflow BigQuery dataset.
What a Stack Overflow data model is
What a Stack Overflow data model is
The public Stack Overflow dataset is one of the most-used samples in BigQuery – a full mirror of the Q&A site’s public content, refreshed periodically. It’s brilliant for learning SQL and testing warehouse queries. But it lands as a set of independent tables (posts_questions, posts_answers, users, comments, votes, badges) with no enforced foreign keys and no picture of how they connect. You have to know that an answer’s parent_id points at a question, or that a post’s owner_user_id points at a user, before any of it is useful.
A data model is that missing picture. It names each table, declares one row’s meaning (the grain), and makes the join keys explicit – so the graph of who-asked-what, who-answered, and who-voted is something you can navigate instead of reverse-engineer. This template is a dimensional-style model: a couple of dimensions (Users, Tags) around the entities and events that happen on the site. If the vocabulary is new, start with our guide to data modeling and understanding star schema.
The Stack Overflow template, mart by mart
The Stack Overflow template, mart by mart
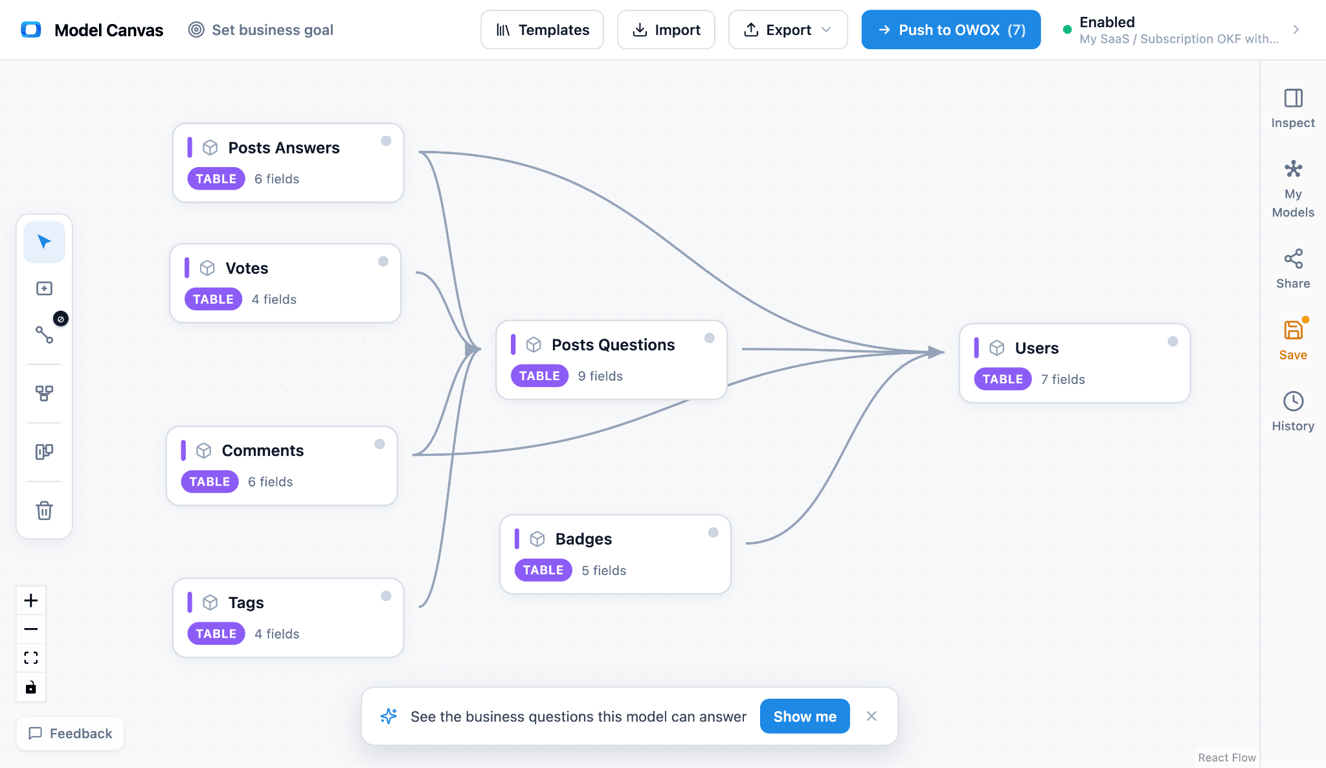
The template is seven data marts – two dimensions and five entity/event tables – wired around the posts graph. Here’s the whole thing.
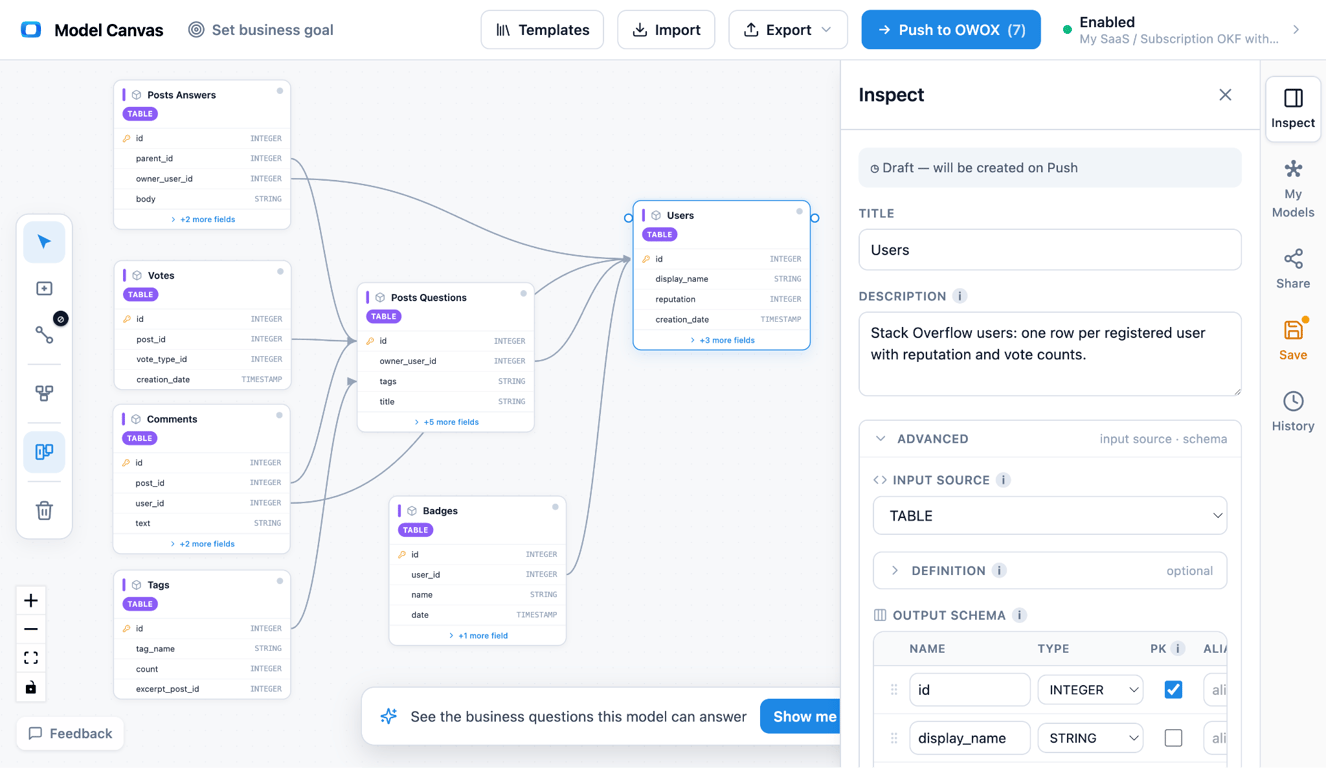
Entity relationship diagram of a Stack Overflow data model: Users and Tags dimensions joined to Questions and Answers (the posts graph), with Comments, Votes, and Badges hanging off users and posts. Open the Stack Overflow model in the canvas →
• Users (dimension) – one row per user (PK user_id), carrying reputation, display name, creation date, and location. Every post, comment, vote, and badge points back here.
• Tags (dimension) – one row per tag (PK tag_id), with the tag name and total usage count. Joined to Questions.
• Questions (entity/fact) – one row per question (PK question_id), with title, body, score, view count, creation date, and FK owner_user_id → Users. The central node of the graph.
• Answers (entity/fact) – one row per answer (PK answer_id), with score, is_accepted, creation date, FK question_id → Questions, and FK owner_user_id → Users.
• Comments (fact) – one row per comment (PK comment_id), with text and score, FK post_id to the question or answer it hangs off, and FK user_id → Users.
• Votes (fact) – one row per vote (PK vote_id), with vote type (up, down, accept) and date, FK post_id to the post it targets.
• Badges (fact) – one row per badge awarded (PK badge_id), with badge name and date, FK user_id → Users.
The central fact is Questions, with Answers linked to it through the posts relationship. The joins make it a star-with-a-bridge: Questions → Users, Answers → Questions and Answers → Users, Questions → Tags, Comments → Questions/Answers and Comments → Users, Votes → Questions/Answers, Badges → Users. Every table here is a reporting-ready data mart in the sense we describe in our approach to data marts.
OWOX Data Marts
See your first report built in real time. 15 minutes.
- Connect your data warehouse
- Pick your metrics
- Get a live Google Sheets report
In the time it takes to write a ticket. Then imagine never writing that ticket again.
Book a DemoWe'll use your actual use case
The posts graph (the centerpiece)
The posts graph (the centerpiece)
If you take one idea from this template, take this: Questions and Answers are two grains of the same “post,” linked to each other and to Users.
A question is a post owned by a user; an answer is a post owned by a (usually different) user that points at a question through parent_id. That single parent-child relationship is the spine of the whole site. Model it as an explicit Answers → Questions join, keep both at their own grain (one row per question, one row per answer), and everything else – votes, comments, accepted-answer flags – hangs cleanly off the right node. Try to flatten questions and answers into one “posts” table and you lose the ability to count answers per question, or to say which user earned reputation for what. Keeping them separate but joined is the classic move; for the grain thinking behind it, see the three types of fact tables and dimensional data modeling.
What this model answers
Because the posts graph is explicit and the dimensions carry the context, the interesting questions become joins, not projects:
• Answer rate by tag – Questions joined to Tags, checking whether an accepted (or any) Answer exists per question.
• Time to first answer – Answers joined to Questions, comparing the two creation dates.
• Top contributors by reputation – Users ranked by reputation, or by summed Answer scores.
• Accepted-answer rate per user – Answers where is_accepted is true, grouped by owner_user_id.
• Most-active tags over time – Questions joined to Tags, bucketed by creation date.
None of these need a new table. They’re different paths across the same seven data marts.
Why a public dataset is worth modeling
Why a public dataset is worth modeling
A common reaction is: “the data is already in BigQuery – why model it at all?” Because a raw public dataset is a set of tables, not a map. The rows are there, but the relationships that make them answerable live only in your head (or in a query you rewrite every time). Modeling turns that tacit knowledge into a shared, navigable artifact.
Declaring the grain and the keys once means anyone can see that an answer belongs to a question, a vote belongs to a post, and a badge belongs to a user – without opening the raw schema docs. It also catches the traps the raw dataset sets for you: posts_questions and posts_answers are separate tables, so a naive join across “posts” silently misses half the graph.
| Aspect | Raw BigQuery dataset | This modeled template |
|---|---|---|
| Relationships | Implicit, in your head | Explicit FKs on the canvas |
| Questions vs answers | Two separate tables, easy to miss | A drawn posts graph (Answers → Questions) |
| Grain | Undocumented | One row per question / answer / vote, stated |
| Reuse | Re-learned per analyst | Shared, versioned, diffable |
| Export | SQL only | OKF + diagram image |
How to open and customize the template
How to open and customize the template
Opening the template and matching it to your copy of the dataset takes about two minutes, then as long as you want to refine.
(1) Open it. Use the link under the diagram above. It loads in your browser with no sign-up.
(2) Reshape it. Rename tables to match the exact BigQuery table IDs, add fields (up/down vote counts, close reasons, edit history), or add a PostLinks table for related/duplicate questions; redraw joins on the canvas.
(3) Set grain and keys. Confirm one row per question, one per answer, one per vote, and the parent_id/owner_user_id/post_id keys that wire the graph together.
(4) Export it. Use Export → OKF for a portable model, or grab a diagram image. Keep the OKF in git or push it into OWOX Data Marts to make it live in your warehouse.
If you’re weighing this against other diagramming apps, our roundup of free database diagram design tools puts it in context.
Export to OKF: a portable Stack Overflow model
Export to OKF: a portable Stack Overflow model
The reason this beats a static ER picture is what happens after the diagram. A drawing can’t be diffed or fed to a warehouse.
This template exports to OKF (Open Knowledge Format), Google’s open, markdown-based standard. Because it’s plain text, you can keep the model in git, review it in a pull request, and hand it off without lock-in – which matters even more for a public dataset, where the whole point is that others can pick up your model and run. New to it? See our explainer on what OKF is, then open the Stack Overflow model and export your own.
Turn your data into decisions.
Governed data marts give you the clean foundation ML needs to actually work.
- No AI hallucinations
- Analyst-governed definitions
- Every number traces to SQL
Frequently Asked Questions
Is the template free, and what can I export?
Yes, it's free with no sign-up. You can export the model as OKF or a diagram image. An OWOX account is only needed if you push the model into OWOX Data Marts.
How is user reputation modeled?
Reputation is an attribute on the Users dimension, and it's built from the events around it – Votes on a user's posts and Badges awarded to the user. The model links all three so you can trace where reputation came from.
How do you calculate answer rate from this model?
Join Questions to Answers on the question key and, per question, check whether any answer (or an accepted answer) exists. Aggregate that flag by tag or by time to get answer rate by segment.
What is the grain of the questions and answers tables?
One row per question and one row per answer. Keeping them at separate grains, joined by the parent key, is what preserves both question-level and answer-level metrics.
Why model a dataset that's already in BigQuery?
Because the raw dataset has no enforced foreign keys and no diagram – the relationships live in your head. Modeling makes the grain and join keys explicit and shareable, so anyone can navigate the data instead of re-learning its structure.
How are questions and answers related?
An answer is a separate post that points at its question through `parent_id`. In the model that's an explicit Answers → Questions foreign key – the posts graph – which is what lets you count answers per question and compute answer rate.
What tables are in the Stack Overflow BigQuery dataset?
The public dataset includes `posts_questions`, `posts_answers`, `users`, `comments`, `votes`, `badges`, and tag data, plus a few post-link and history tables. This template models the core seven as Users, Tags, Questions, Answers, Comments, Votes, and Badges.