
How to get marketing reporting nobody can argue with
Stop building shadow spreadsheets before board meetings. Get governed, always-fresh marketing reports your data team signs off on.


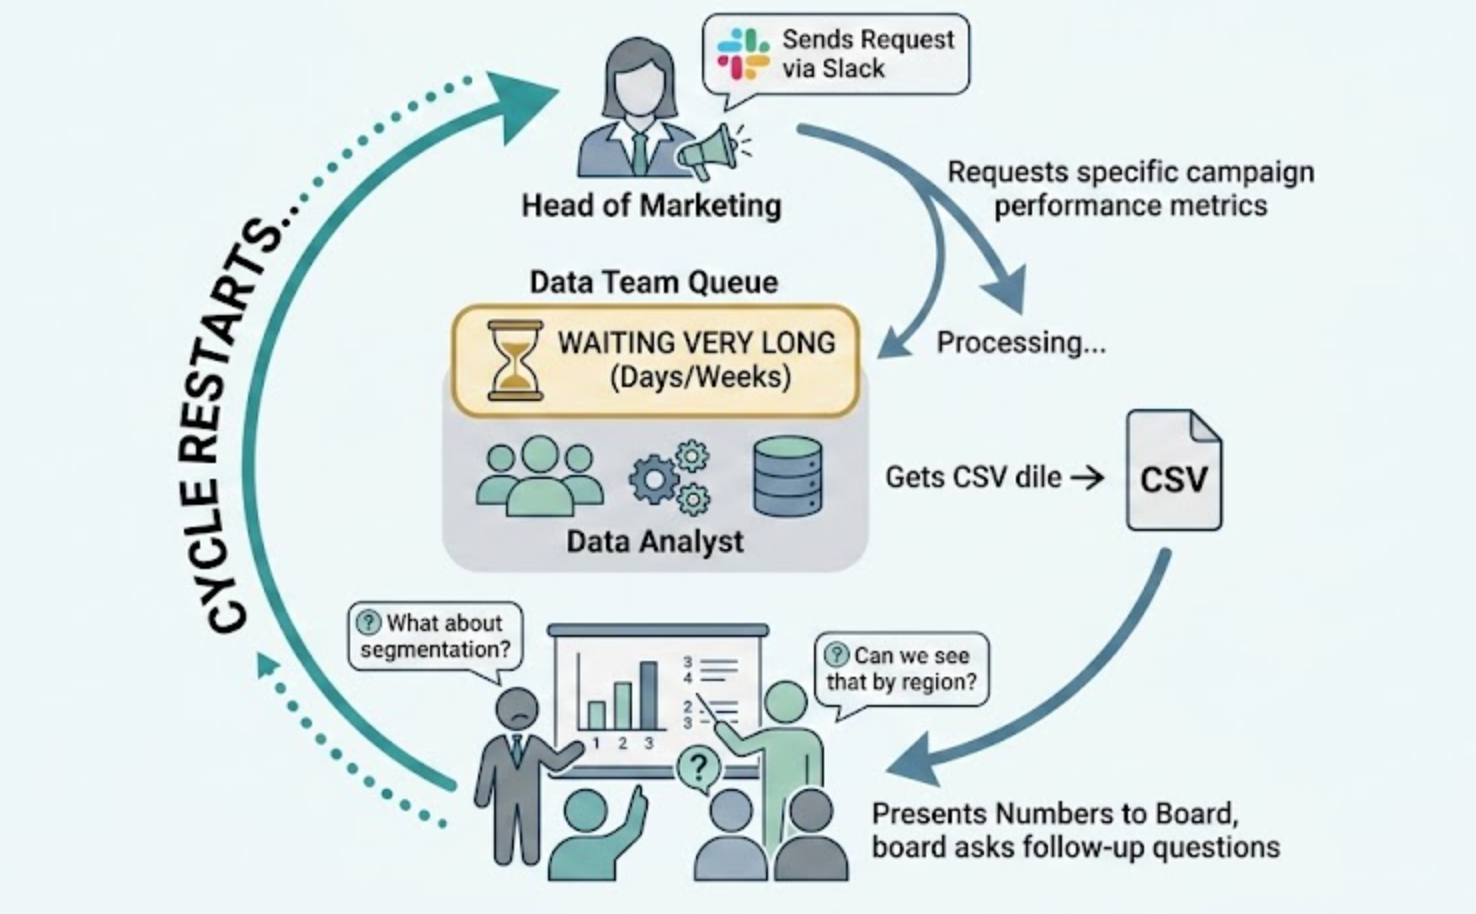
The board meeting is Thursday. You need pipeline contribution by channel. Your data team says it's in the queue – behind finance's reconciliation report, product's churn analysis, and three other requests that arrived before yours. You've been waiting two weeks.
So you do what every Head of Marketing eventually does: you open Google Sheets, pull numbers from the ad platforms, combine them manually, hope the definitions match finance's version, and present numbers you can't fully defend...
The board asks a follow-up question.
You say "I'll get back to you."
You Slack the data team. The cycle restarts.
You're not alone. 53% of marketers say data analysis is their top bottleneck slowing down marketing cycles (eMarketer/Adjust, 2026).
Not the creative. Not having enough budget. Not even the headcount - AI helps here. Data.
The problem isn't that your data team is slow. The problem is that the model forces every marketing question through a 3-person team serving 15 stakeholders. There's a way to get the numbers you need – fast, governed, and defensible – without building a shadow analytics stack or starting a war with your data lead.
Why the data team can't just "give you access"
Before you blame your data team, understand why they're slow. It's not what you think.
They're protecting you from bad numbers
Your data team isn't gatekeeping for fun. Raw warehouse data is messy – column names don't match business terms, joins are ambiguous, and "revenue" has at least three valid definitions depending on who's asking. If the data team gives you direct access and the first wrong number hits a board deck, it's on them. Their reputation, their problem.
The ad-hoc reporting model exists because the alternative – uncontrolled access to raw data – is worse. The data team knows this. That's why they queue.
They're drowning in the same backlog you're waiting in
Your request is one of 200. Marketing, sales, finance, product – everyone wants data, and the data team is 3–4 people. Each "quick question" takes 2–4 hours of SQL, formatting, and delivery. They're not slow; they're overloaded.
The painful irony: the more valuable their work, the more people ask for it, and the longer the queue gets. Hiring another analyst helps – for about a month, until demand scales to match the new capacity.
The BI dashboard didn't solve it either
They built you a Data Studio dashboard last quarter. You used it for a week. Then you needed a breakdown by region that wasn't on the dashboard, and you were back in the queue. BI dashboards answer pre-built questions; marketers have new questions every week. The dashboard becomes a bottleneck with a nicer interface.
What "governed self-service" actually means for marketing
There's a model where you get your numbers fast AND the data team keeps control. It's not a compromise – it's an architecture that gives both sides what they need.
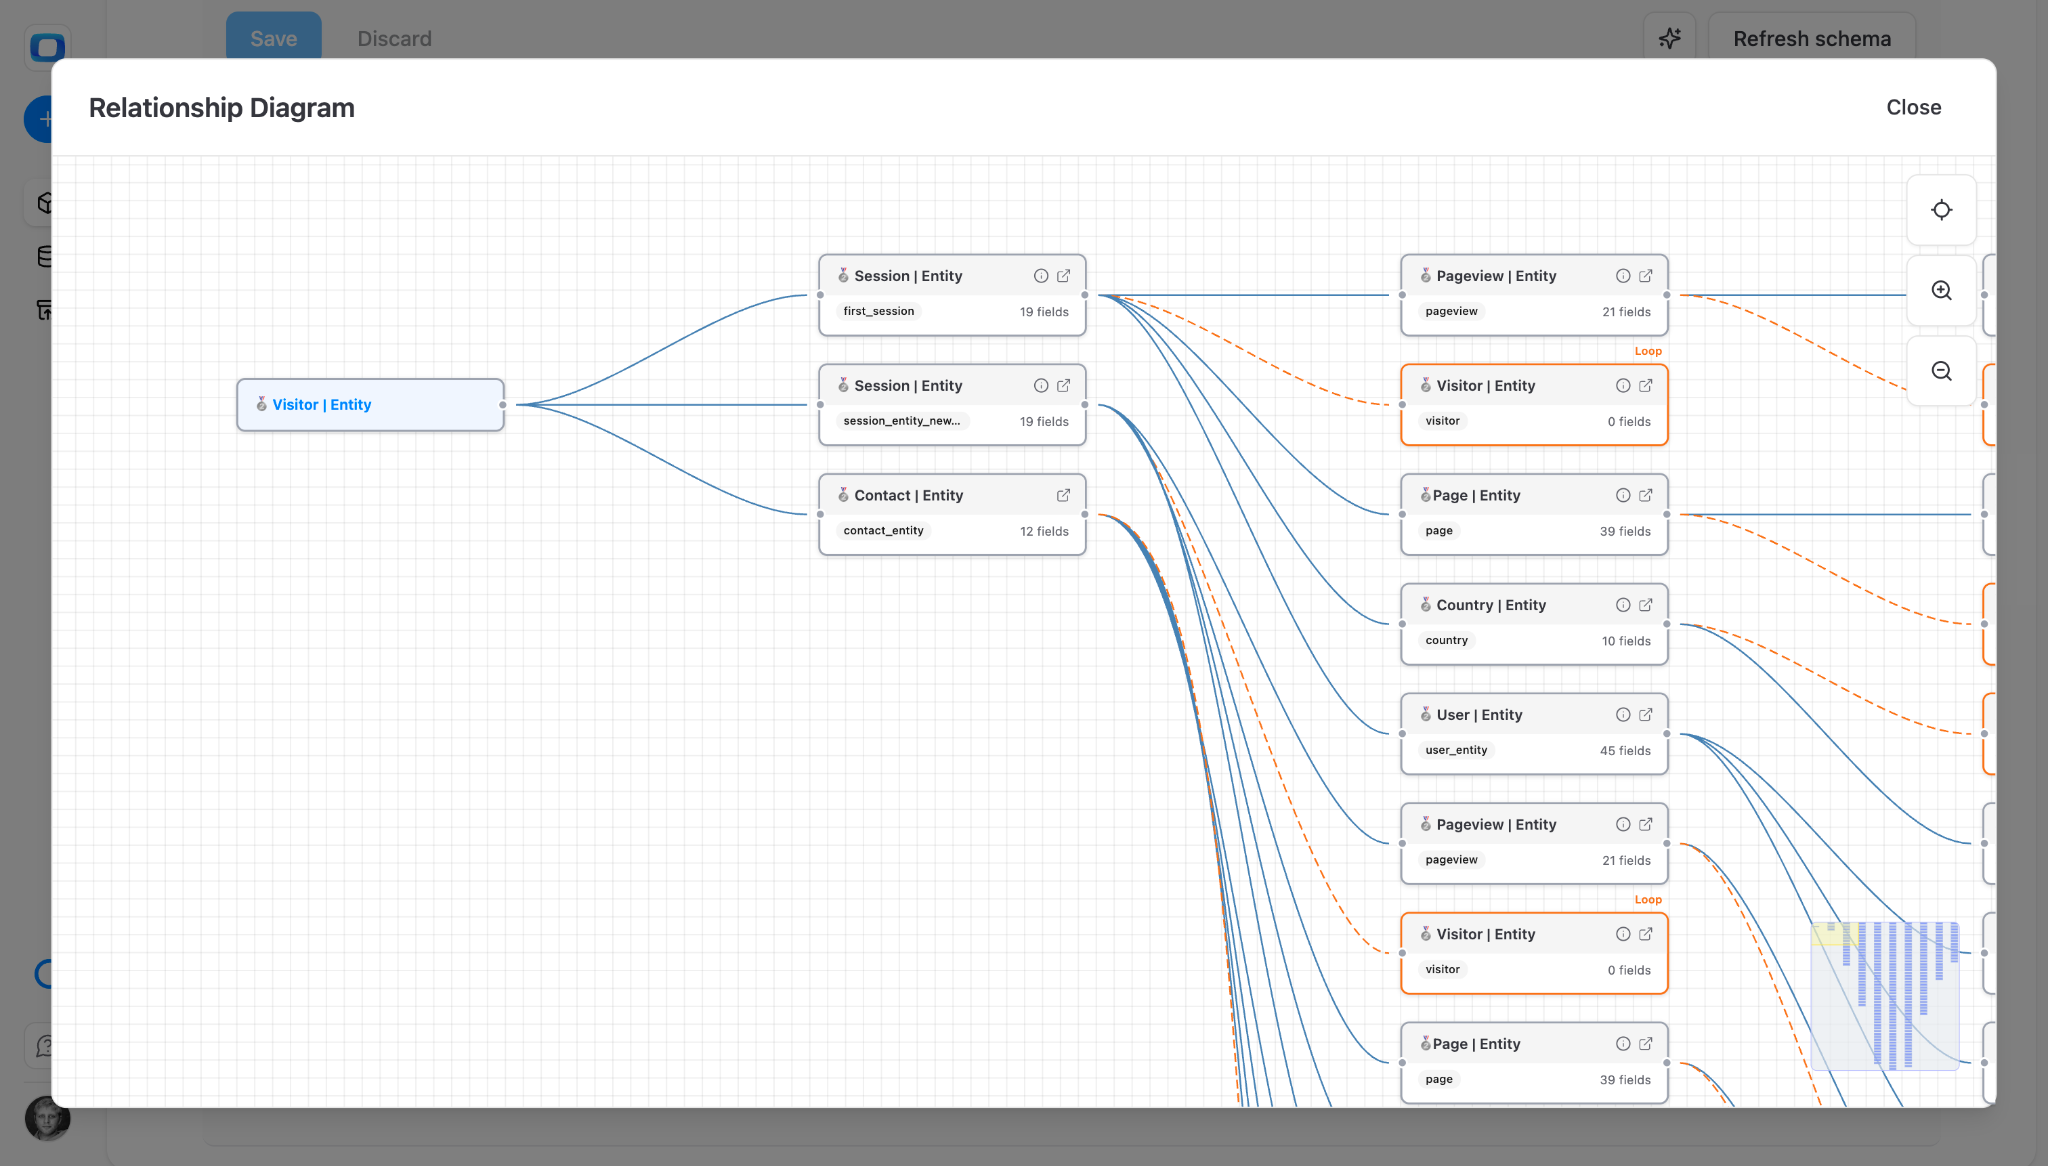
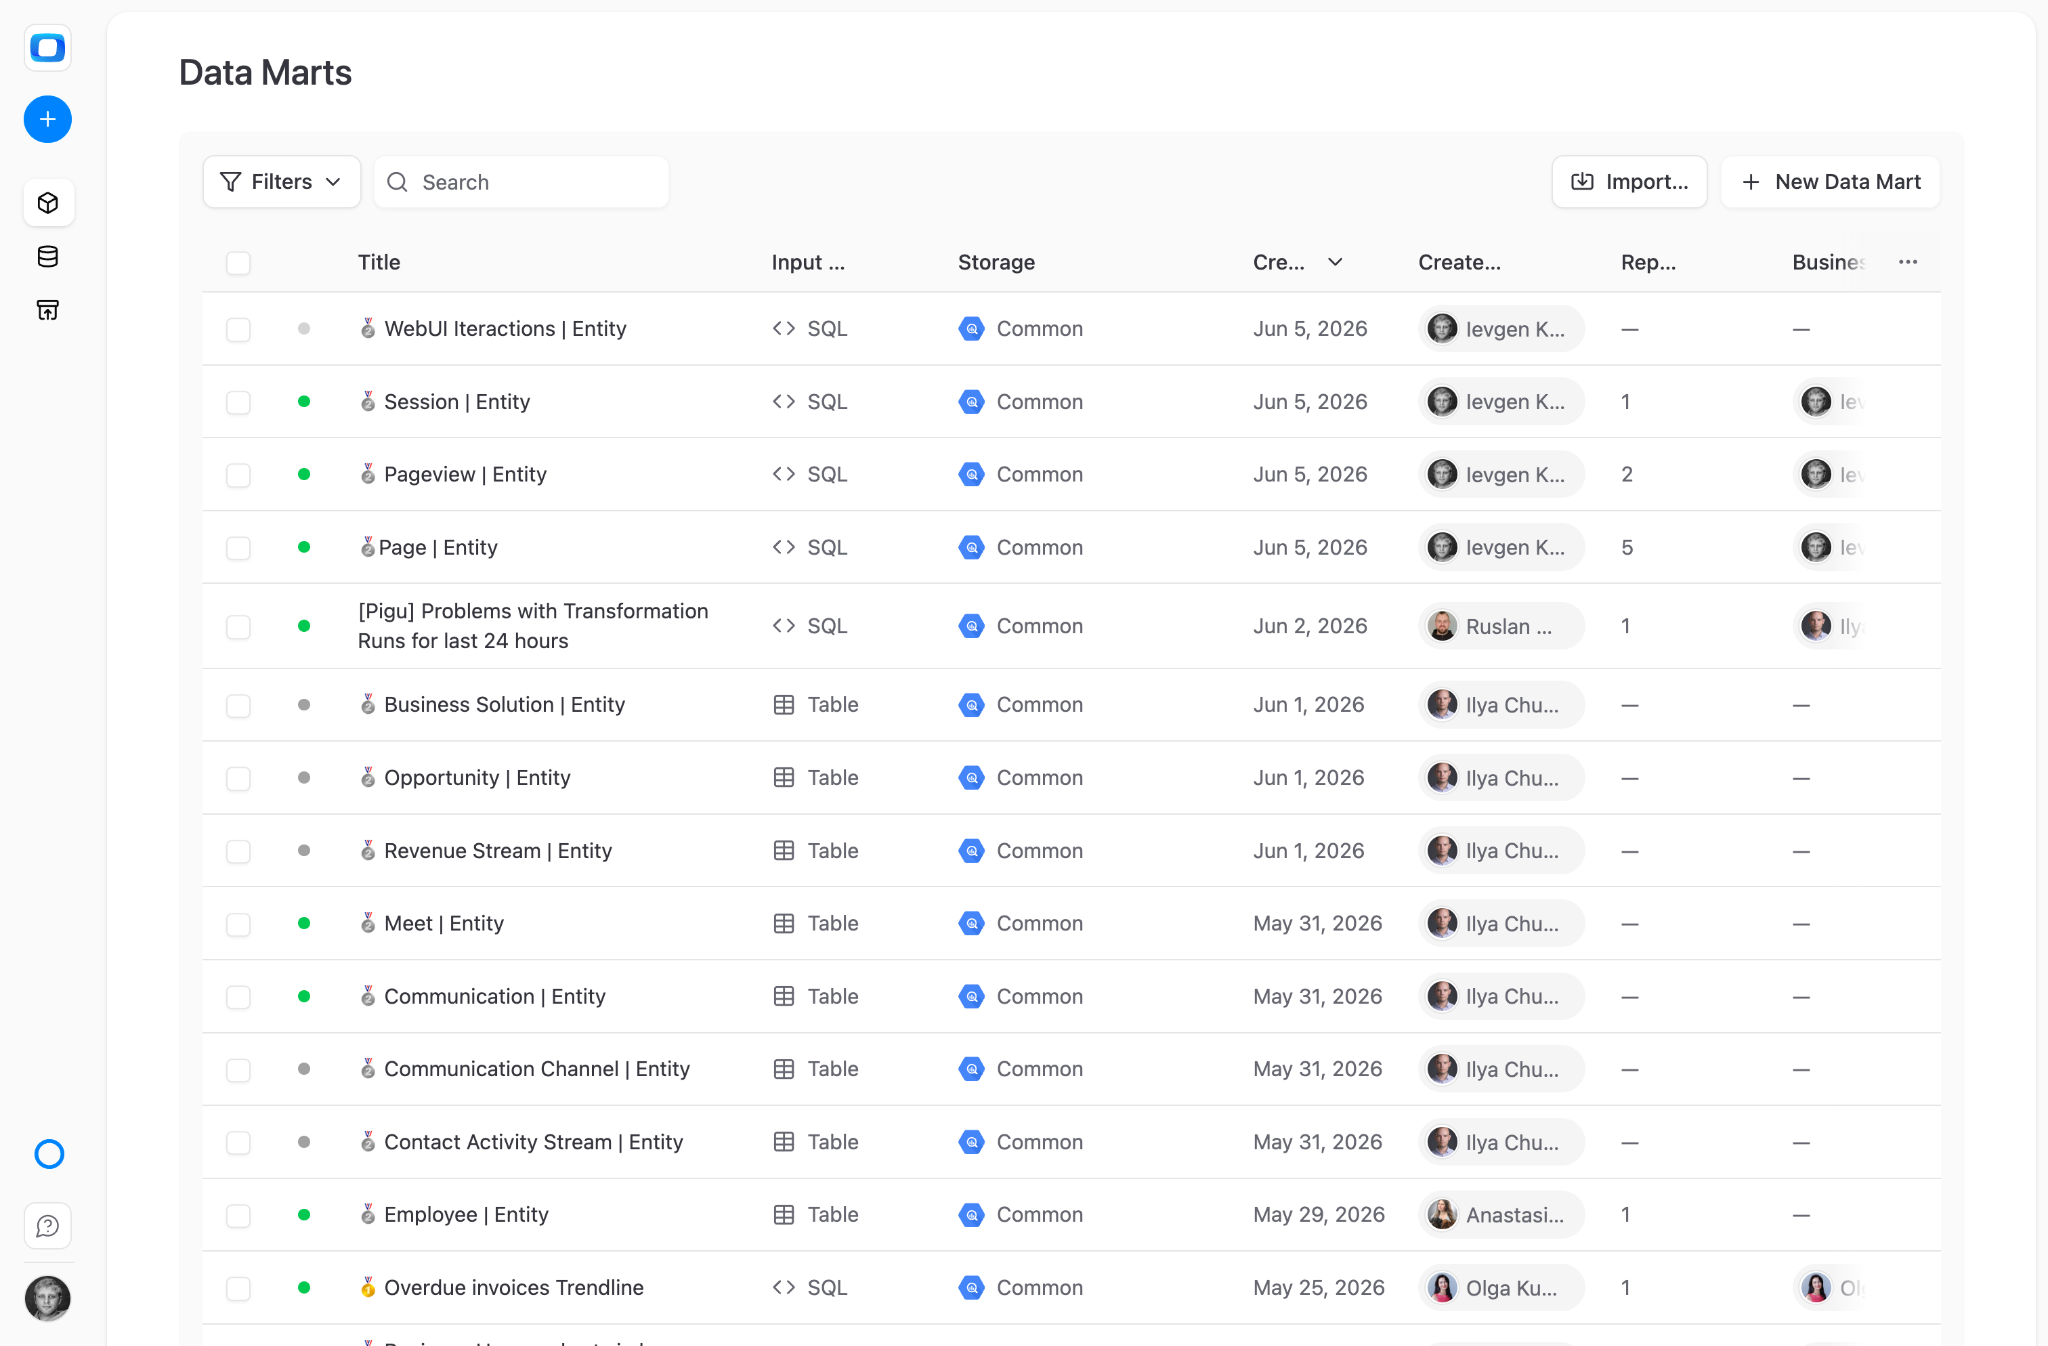
The data team defines the logic once
An analyst creates a Data Mart – a governed, reusable dataset – for each marketing entity: campaigns, channels, spend, conversions, revenue. They define what "conversion" means, how attribution works, which data sources feed in. They set the join keys so these data marts connect correctly. This is the logic layer. They own it.
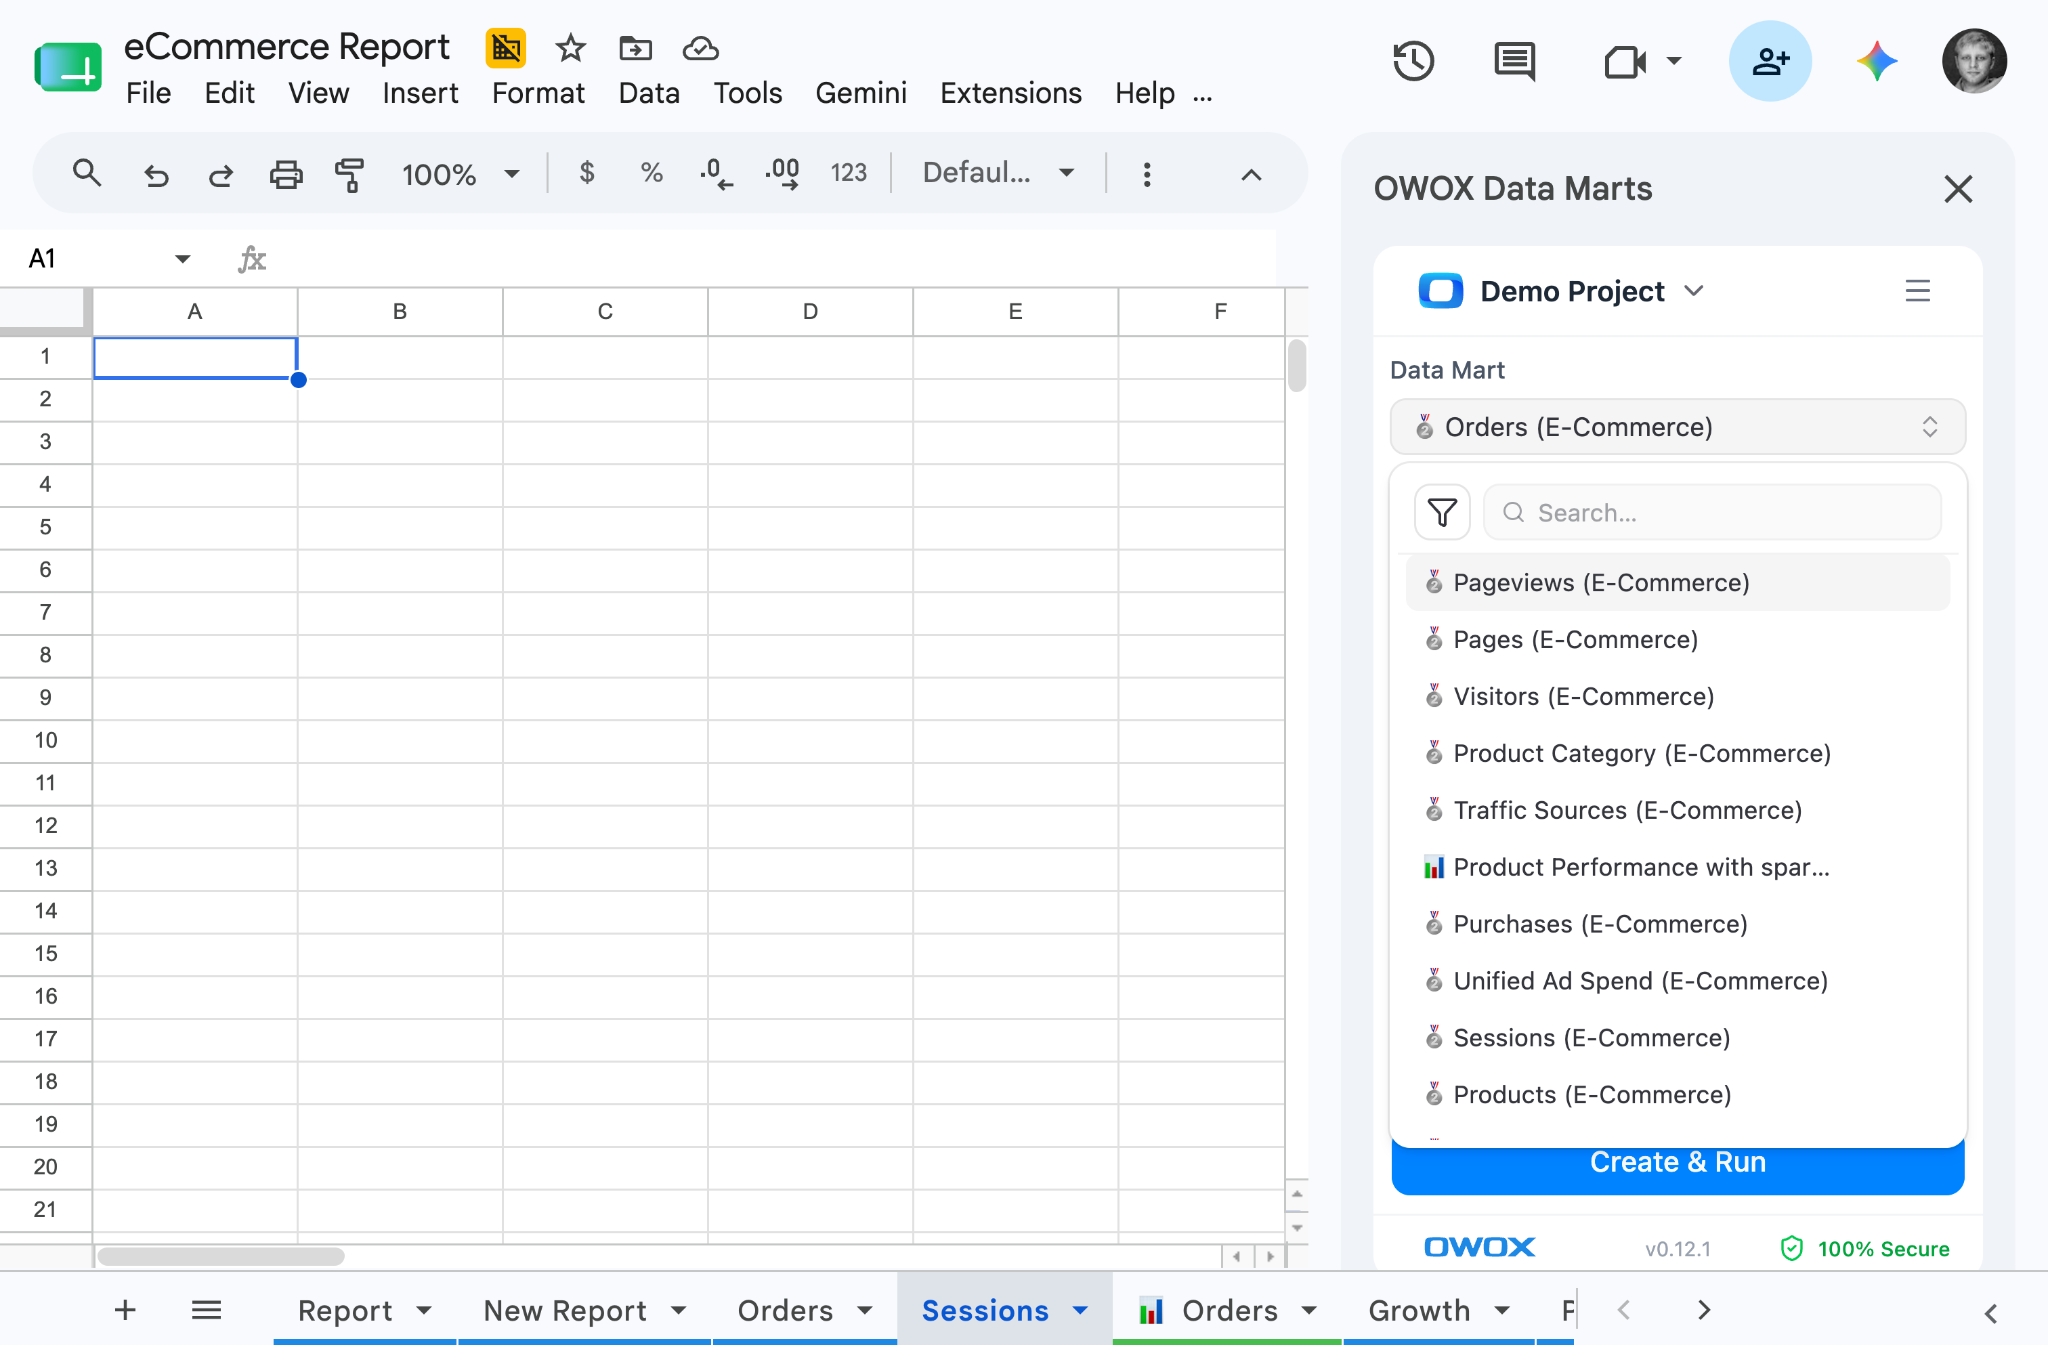
You self-serve from the library in Google Sheets
You open Google Sheets and browse the Data Mart library via the OWOX extension. You pick the columns you need – campaigns, spend, conversions, revenue by source. You apply filters – last 30 days, paid channels only. You pull. The Sheet refreshes on schedule – automated, always fresh. No SQL. No tickets. No Slack pings.
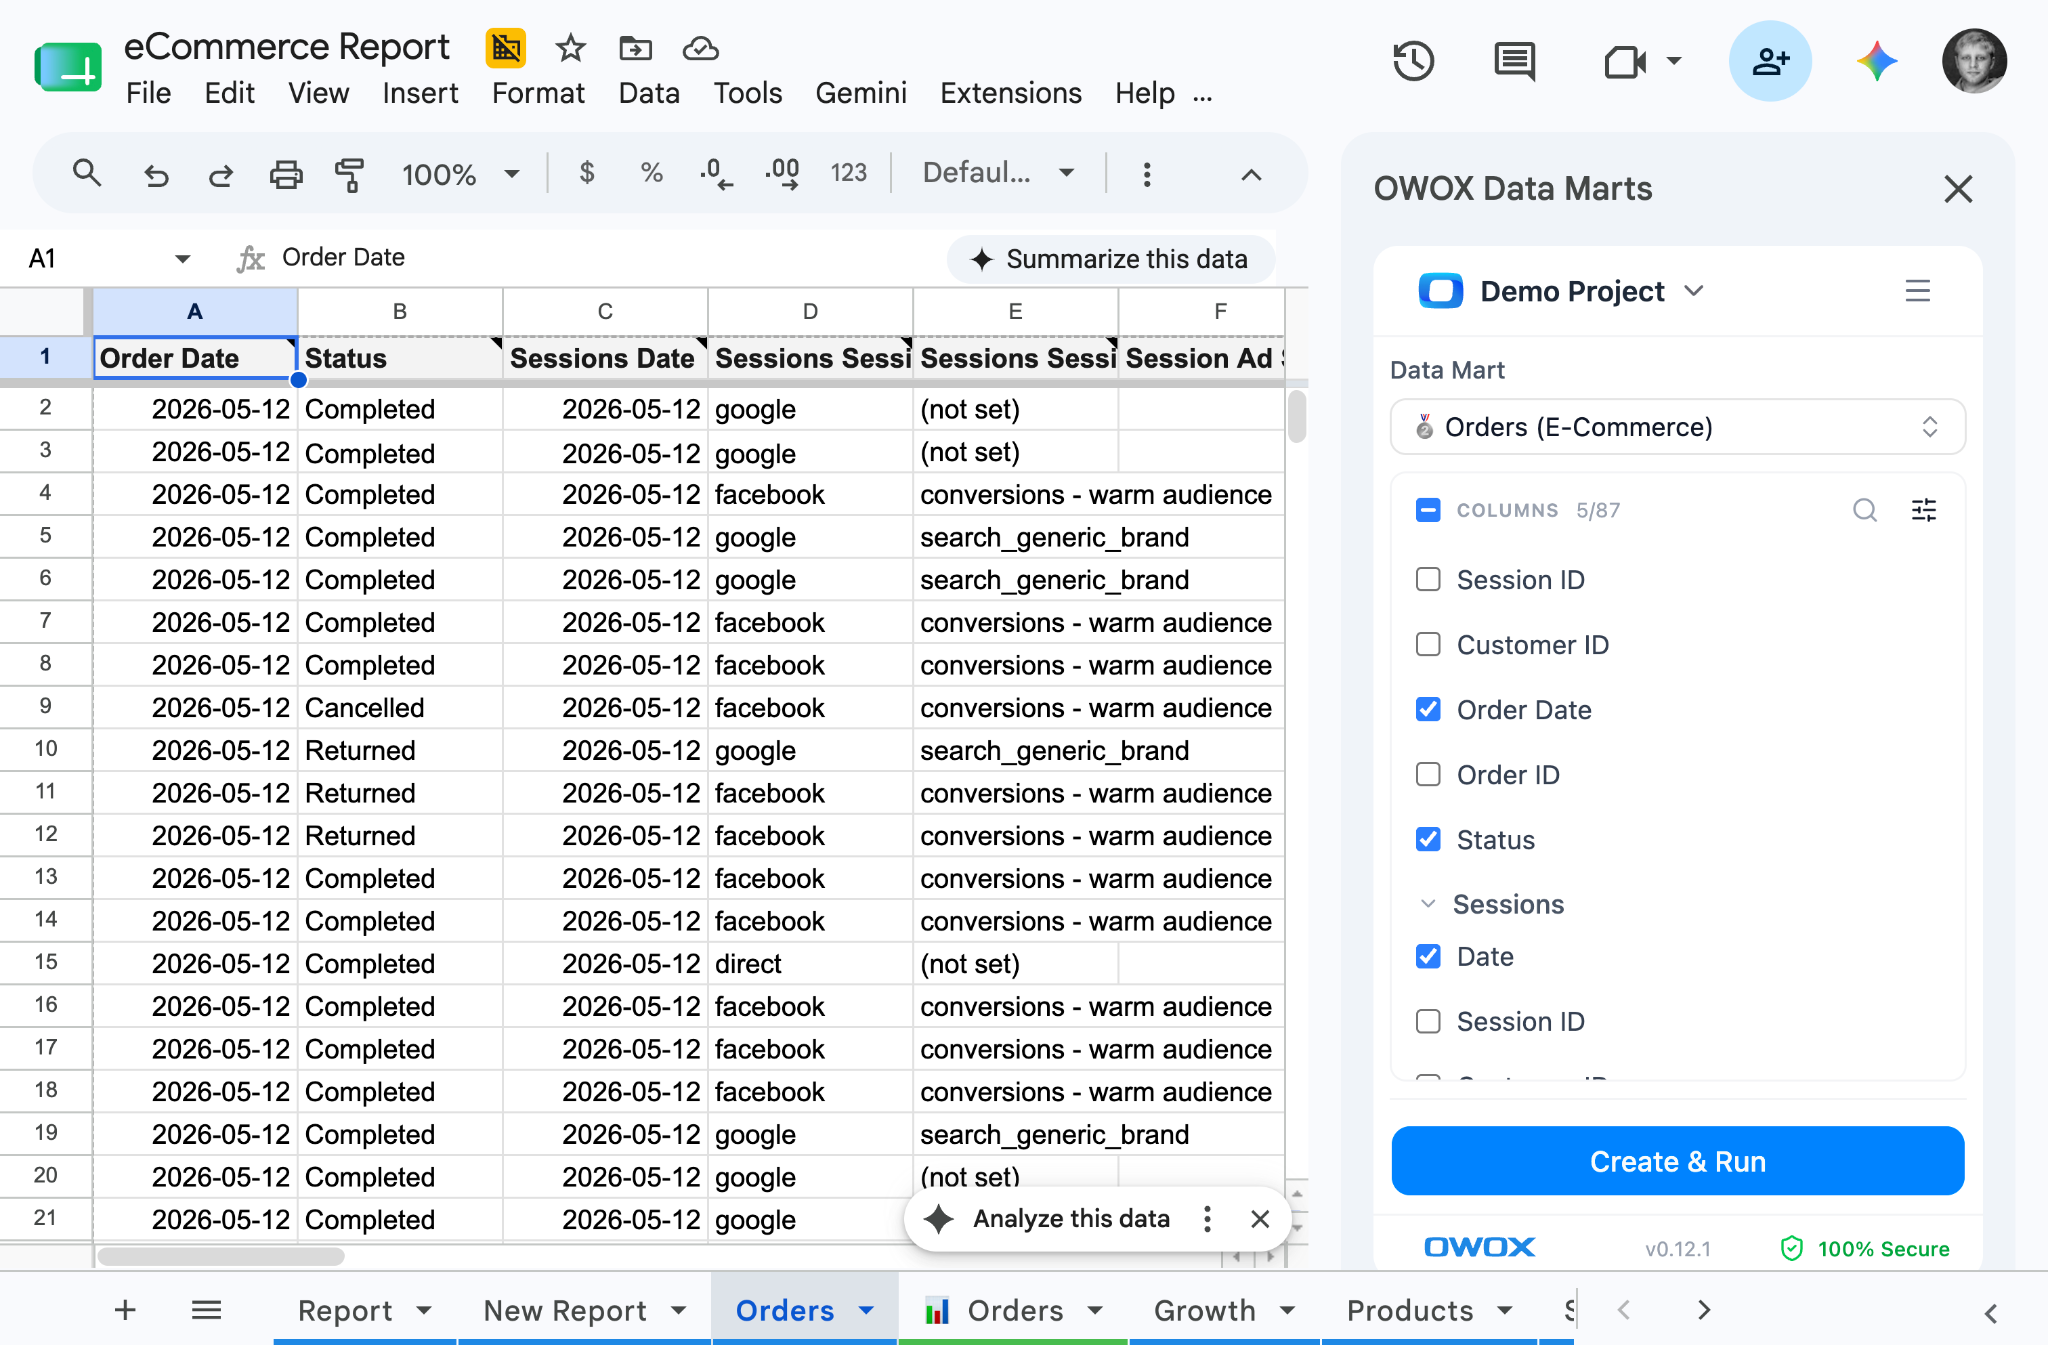
Every number traces back to a query the data team approved. Same definitions as finance. Same source as the BI dashboard. But delivered in the tool you actually use. Google Sheets.
New question? Pick different columns. No new ticket.
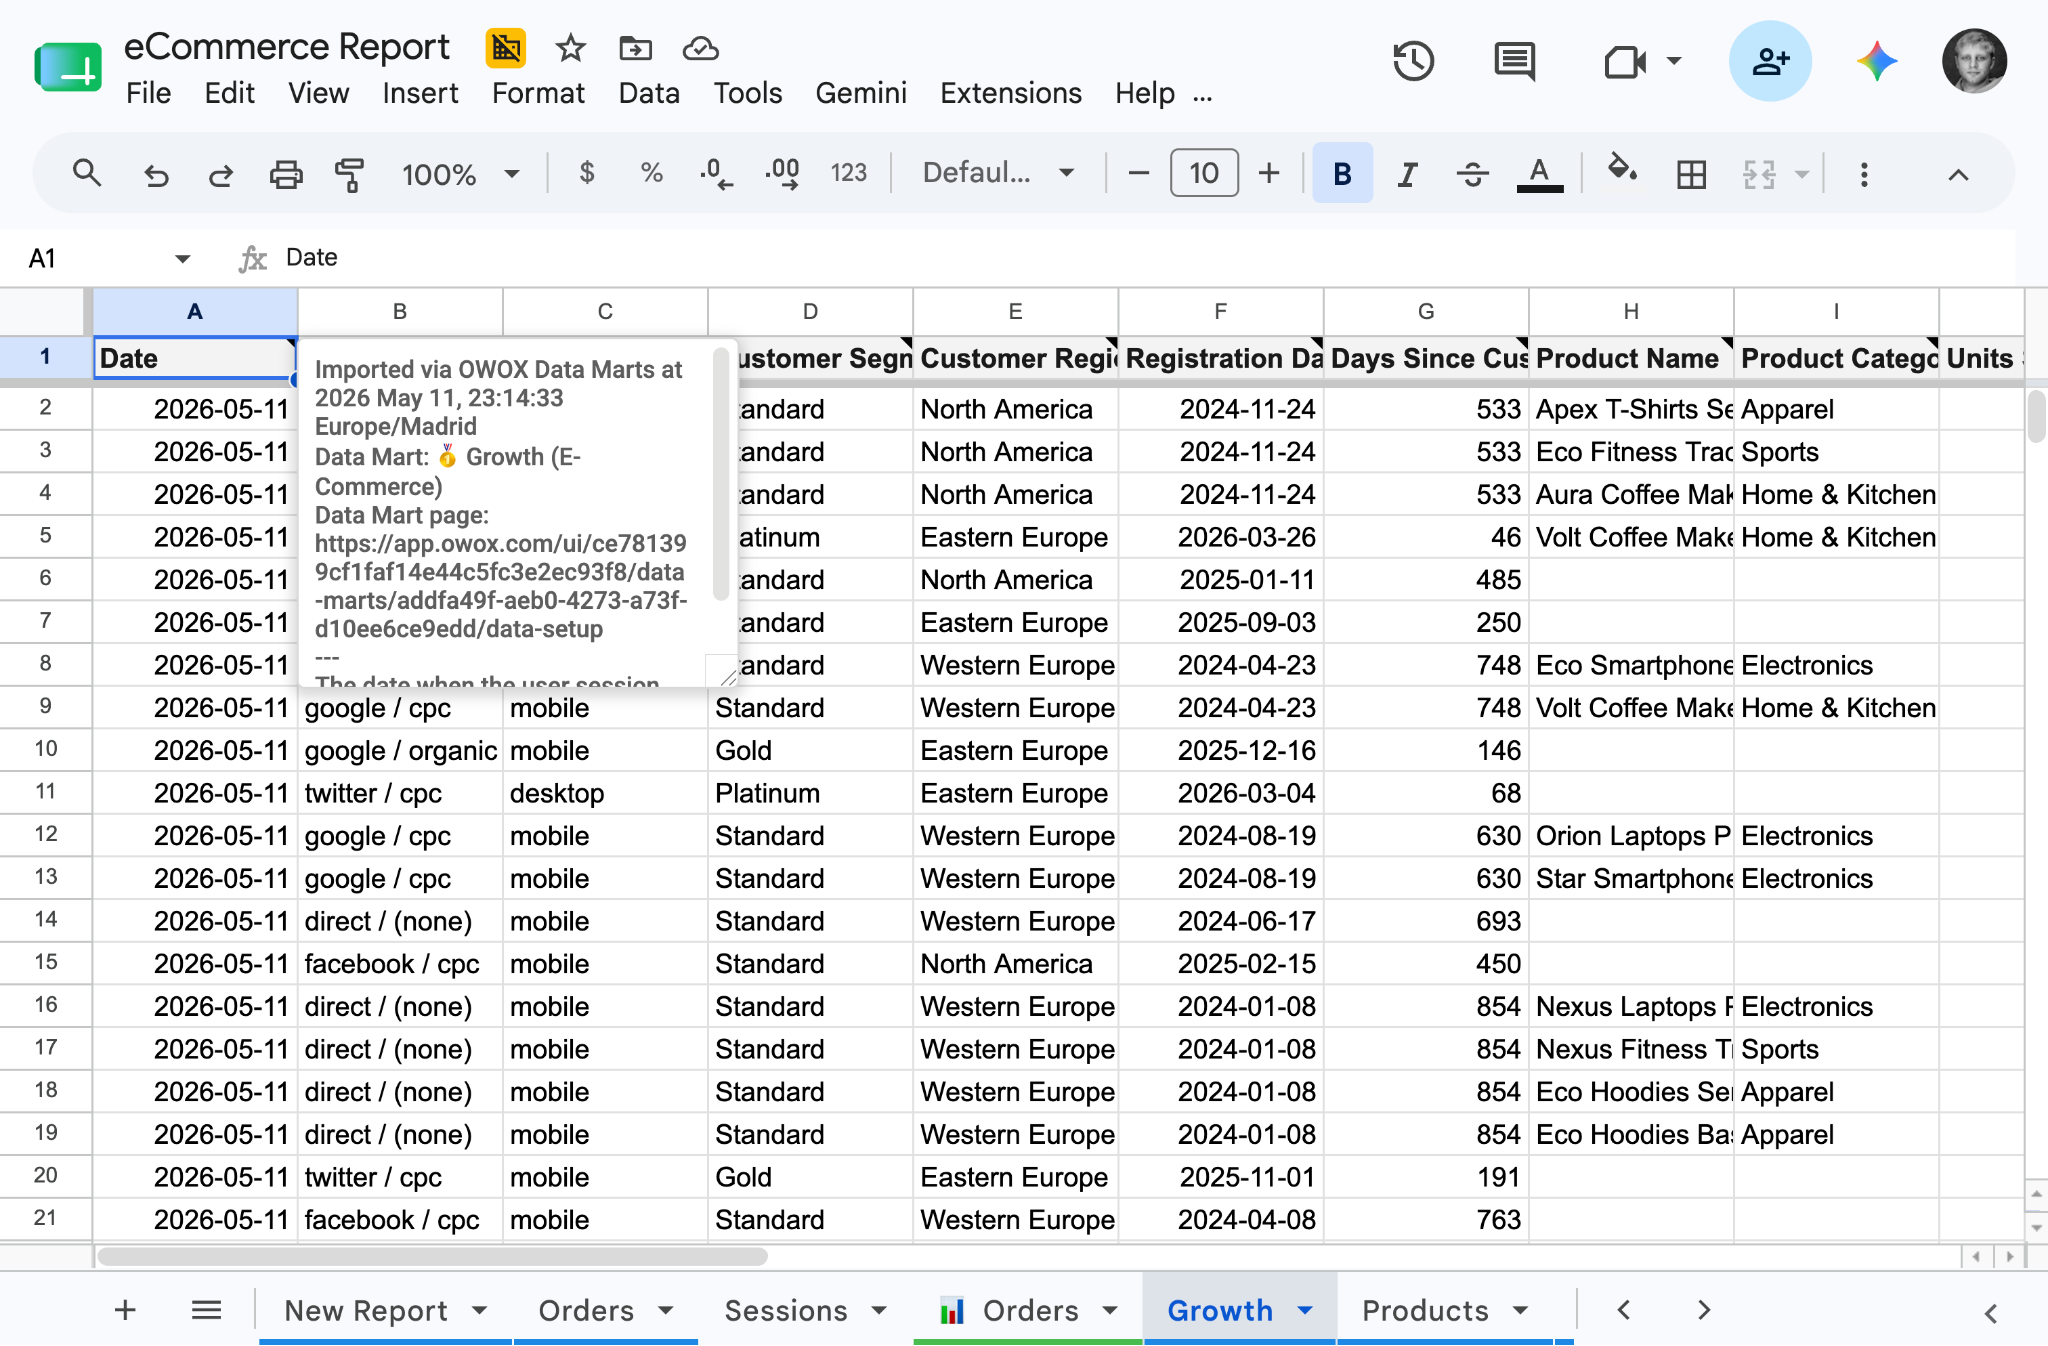
"Orders by channel" and "orders by region" and "revenue by campaign type last quarter" are all the same data mart – different column selections and filters. Each variation that used to be a separate ticket is now a self-served pull. The data team defined the logic once; you control the question.
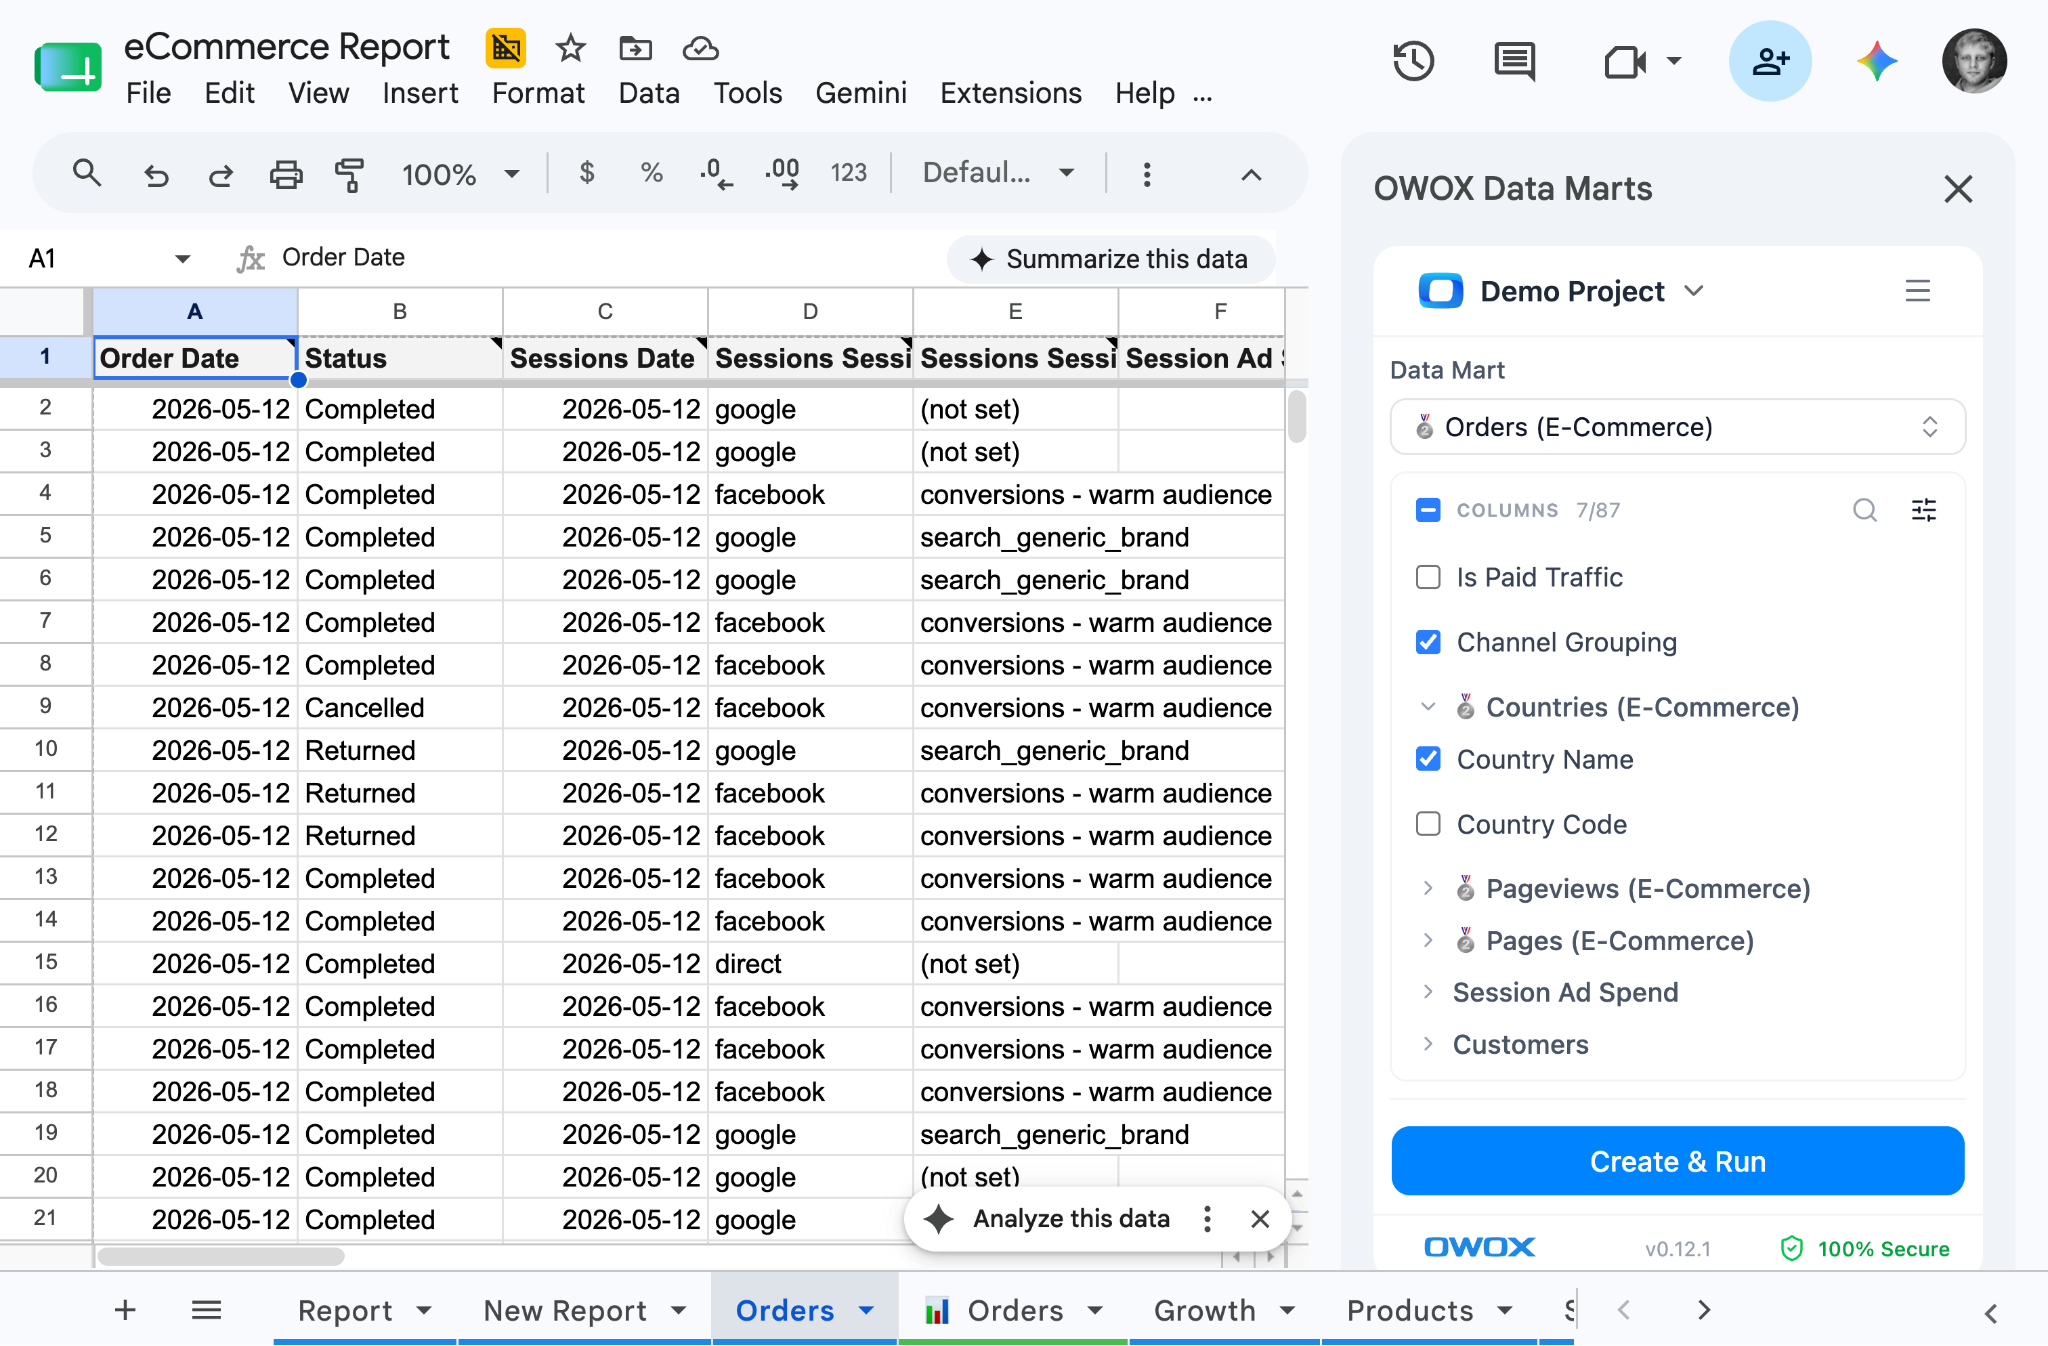
This is what self-service analytics looks like when it actually works: the data team controls the truth, you control the question, and nobody compromises.
What this looks like for a marketing team
Here's a concrete example – the reports you probably need this week.
The data marts a marketing team typically needs: Campaigns, Ad Spend, Channels, Landing Pages, Sessions, Conversions, Revenue by Source. The analyst creates these as data marts, joins them on shared keys (campaign_id, source, medium, landing_page_url), and publishes to the library.
Now you can self-serve any of these:
• "What's my ROAS by channel this month?" → pull from Campaigns + Spend + Revenue data marts
• "Which landing pages convert best?" → pull from Landing Pages + Sessions + Conversions
• "How does paid vs. organic compare for the last 90 days?" → filter by channel type
• "What's the cost per lead by campaign?" → pull from Campaigns + Spend + Conversions
Each of these used to be a ticket. Now they're column selections in a Sheet the data team set up once. And every metric traces to SQL the data team approved – the same numbers finance uses, the same logic as the BI dashboard.
Walk into the board meeting with numbers nobody can argue with. Not because you built them yourself – because the data team built them once, governed them, and you self-served the exact view you needed.
How to make the case to your data team
You're convinced. Now convince them. Here's how to frame it so the data lead says yes – not because you're pressuring them, but because it solves their problem too.
Lead with their pain, not yours
Don't say "I need faster reports." Say "I want to take marketing reporting off your plate – permanently."
The data team's #1 pain is the reporting backlog. Every marketing question you stop asking is 2–4 hours they get back for strategic work. Frame this as a trade: you get speed, they get capacity. Both of you get numbers the board trusts.
The ask is small: a few data marts, joined
You're not asking for a 6-month project. You're asking for 5–7 data marts covering the core marketing entities – Campaigns, Spend, Channels, Conversions, Revenue, Landing Pages, Sessions. They define the SQL, set the joins, publish to the library. You self-serve from there. First report in the same day.
This isn't a new tool they have to learn. It's a Data Mart library that works with their existing warehouse – BigQuery, Snowflake, Databricks, Redshift, or Athena. Their SQL, their definitions, their governance.
Your automated, self-service marketing reporting. Unlike raw data pipes (Supermetrics, Funnel.io), these are governed, analyst-defined datasets – your data survives API changes and your numbers always match finance.
What they get back
Their time. Every marketing question you stop asking is 2–4 hours they get back. Multiply that by the number of marketers on your team, by the frequency of requests, and you're looking at 20–40 hours per week returned to the data team. That's not just capacity – that's the difference between a data team that's reactive and one that's strategic.
Send this to your data lead. It makes the case for them, not against them. And point them to the analyst's guide to killing the reporting backlog – it's the same argument from their perspective.
Get started this week
Here's the shortest path to marketing reporting nobody can argue with.
Step 1: Share this article with your data lead. It makes the case for governed self-service analytics in their language – less backlog, more strategic time, same governance. And they won’t worry about being blamed for the bad data.
Step 2: Agree on the first 5-6-7 marketing data marts. Campaigns, Spend, Channels, Conversions, Revenue. These cover 80% of the marketing questions your board asks. Your data lead can set them up and join them in an hour.
Step 3: Start free here. Invite your data lead to join so he can connect the warehouse, builds the data marts, publishes to the library.
You open Google Sheets and self-serve. First board-ready report by end of today.
No more shadow disconnected spreadsheets. It all traces back to the source - the data. Updates on a schedule that you control. No more "I'll get back to you." No more numbers that don't match finance. Just marketing reporting your data team actually signs off on – and your board can't argue with.
Frequently asked questions


Finally, a tool that doesn't ask business users to learn a new dashboarding UI. Our marketing team already knows Sheets. OWOX just delivers the right data.
Joinable data marts concept was the thing that sold us. We can now use the semantic layer without building one.
Self-hosted the OSS version on Digital Ocean. Zero vendor lock-in. Contributed a Shopify connector back in week two.